CHFNZD trade ideas

NZDCHF BullishBias Bullish
Fundamental Analysis
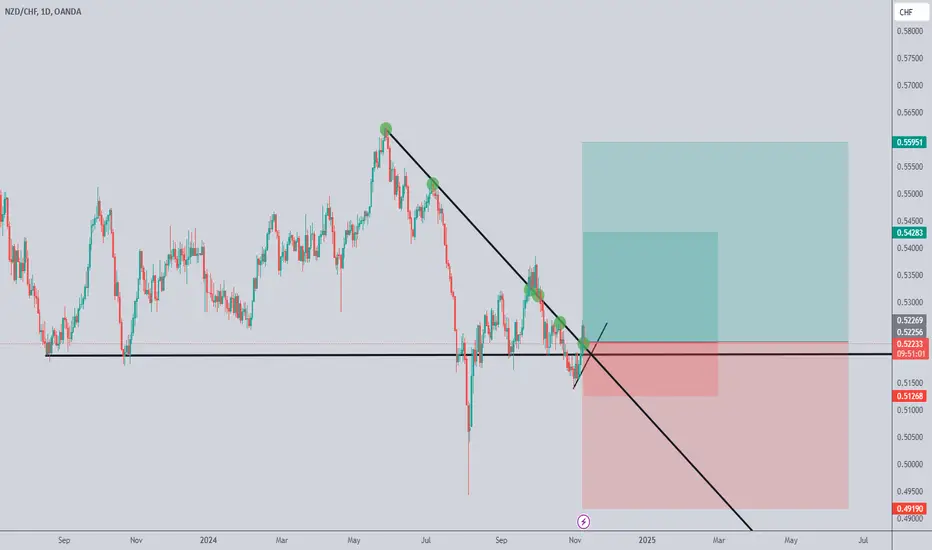
NZD is bearish data, but recent inflation is at target level close to 2%. NZD likely to stable down soon. CHF is not taking big move, more neutral position
Price Action: Price retrace back to support level. there was an rejection from Support level. It broke the H4 resistance level. As it show the continuation of bullish movement. Price expected to retest the broken resistance level. It consolidated and form a double bottom and broke through the ltf resistance level
Set up:
Long setup Broken resistance level of H4/H1
SL below swing low
TP next swing high of R:R 1:4.5

BUY NZDCHF - entry strategy explained in detail Trader Tom, a technical analyst with over 15 years’ experience, explains his trade idea using price action and a top down approach. This is one of many trades so if you would like to see more then please follow us and hit the boost button.
We are proud to be an OFFICIAL Trading View partner so please support the channel by using the link below and unleash the power of trading view today!
www.tradingview.com

long idea
Long swing trade idea. From the lows several weeks to materialize. pulled off the low with speed

NZD CHF BuyThe New Zealand Dollar (NZD) is generally considered a higher yielding currency. It is dependent on the export of agricultural and other resources. New Zealand's strong economic performance and rising commodity prices often lead to increased demand for the NZD. If the economic data from New Zealand is positive, this could have a positive effect on the currency.
However, the Swiss franc (CHF) is known as a "safe haven currency," which investors seek in times of economic instability. If there is stability in the global economy, the CHF could weaken as capital shifts to higher yielding assets, including the NZD.
NZDCHF Channel Down and Head and Shoulders driving it much lowerThe NZDCHF pair gave us a spot on buy signal last time we looked into it (August 23, see chart below) that easily hit the target and immediately after started a correction that broke the Channel Up to the downside:
What has emerged from that top is a Channel Down pattern, which made yesterday a new Lower High on the 1D MA50 (blue trend-line). That's not all however. As you can see, this Lower High can technically be the Right Shoulder of a Head and Shoulders (H&S) pattern, which makes the trend even more bearish.
The 1st Bearish Leg of the Channel Down reached a -4.55% decline, so another such Leg would price a Lower Low at 0.50255. This happens to be just above the 2.0 Fibonacci extension, which is a standard target for H&S patterns. Our Target is marginally above both at 0.50500.
-------------------------------------------------------------------------------
** Please LIKE 👍, FOLLOW ✅, SHARE 🙌 and COMMENT ✍ if you enjoy this idea! Also share your ideas and charts in the comments section below! This is best way to keep it relevant, support us, keep the content here free and allow the idea to reach as many people as possible. **
-------------------------------------------------------------------------------
💸💸💸💸💸💸
👇 👇 👇 👇 👇 👇

NZDCHF: Bears Will Push Lower
Remember that we can not, and should not impose our will on the market but rather listen to its whims and make profit by following it. And thus shall be done today on the NZDCHF pair which is likely to be pushed down by the bears so we will sell!
❤️ Please, support our work with like & comment! ❤️

NZDCHF - 1hr TF - BullishSentiments 93% long for NZDCHF
Buy Order take profit levels defined
Bullish in my view

NZDCHF Testing Mean ReversionOk, just now I exited the sell trade for NZDCHF testing of mean reversion. However, I quickly realised that price doesn't necessarily respect the 60SMA. And when price does make an oversold or overbought, and that price is moving in a certain direction based on evidence ie. higher high higher low, in this instance, then, we should take that into serious account instead of trying to go against the grain.
I think that this is just like business, you cannot stick to something when it is not working, and you know it is not working and you know that it is not something you can operate even if it turns out to be profitable.
Ni bu ke yi resistant, ni resistant yi ding hui bei tao tai. - Ryan(R U Okay!? on WahBanana CEO episode) You cannot be resistant, once you be resistant, you get disqualified.

Mean Reversion Trading NZDCHF Swing SellMean Reversion.
WHen price goes in one direction
for too far or long, it will tend to
collapse back to the average price.
Stochastics 20,1,1 shows overbought,
Price is tanking, I entered on a sell market.
I think this has to be a swing trade where
one cannot be greedy.
I think that the forex market isn't like the stock market where it can continue trending, one of the reasons being due to inflation, where price will always get more expensive for goods, services, and stocks also (since it deals with goods and services as its core.)
Unless if something major that shakes a country and keeps going, such as JPY negative interest rate for years, otherwise it is rare to see price keep on running and seeing no end.
On the other hand, products such as commodities, or metals like gold and stocks and maybe REITs (I am not familiar with REITs but with some common sense, I think that landlords would only want to keep on increasing the rent prices to pad their pockets, such as in Singapore where the price isn't controlled and rental prices can shoot up, and even if the units are not rented out FOR YEARS, the property owner doesn't care and am not affected, one of the reason being they are holding onto land deed which property prices Singaporeans call as supply and demand, but the demand is just as artificial as labubu sales due to influx of rich foreigners buying into government housing in Singapore.)
Anyway, country and country will definitely have a push and pull effect, don't expect prices to keep going for no rhythm or reason. The stock market is there for a reason if you wanna go for a no rhythm and no reason trending market.

NZD-CHF Resistance Ahead! Sell!
Hello,Traders!
NZD-USD is about to retest
A horizontal resistance
Of 0.5265 so after the
Pair hits level we will be
Expecting a local
Bearish correction
Sell!
Like, comment and subscribe to help us grow!
Check out other forecasts below too!

NZDCHF - FAKE BREAKOUTHello Traders !
After a huge bearish move,
The NZDCHF price failed to break the strong support level (0.51902 - 0.51742).
So, I predict a bullish move📉
_______________
TARGET: 0.52400🎯


6-11 ProbelegNZDCHF 6-11: Unemployment Rate elaboration 4.8%. However, we first look to see if the uptrend that is announcing itself will continue. We have placed a buy at 0.52125.

NZD/CHF SELLERS WILL DOMINATE THE MARKET|SHORT
Hello, Friends!
Bearish trend on NZD/CHF, defined by the red colour of the last week candle combined with the fact the pair is overbought based on the BB upper band proximity, makes me expect a bearish rebound from the resistance line above and a retest of the local target below at 0.514.
✅LIKE AND COMMENT MY IDEAS✅

NZD-CHF Bearish Bias! Sell!
Hello,Traders!
NZD-CHF is trading in a
Downtrend and the pair
Is making a pullback from
The horizontal resistance
Of 0.5200 while trading
In a downtrend so we are
Bearish biased and we
Will be expecting a
Further move down
Sell!
Like, comment and subscribe to help us grow!
Check out other forecasts below too!

NZDCHF LONG Market structure Bulliish on HTFs DH
Entry at Daily AOi
Weekly Rejection at AOi
Daily Rejection At AOi
Potential Head and shoulder Pattern on the Daily
Previous Daily Structure Point
H4 Candlestick rejection
Potential Head and shoulder Pattern on the 4-hour
Retest of the trendline
Rejection from Previous structure
Levels 6.48
Entry 80%
REMEMBER : Trading is a Game Of Probability
: Manage Your Risk
: Be Patient
: Every Moment Is Unique
: Rinse, Wash, Repeat!
: Christ is King

Bearish drop?NZD/CHF has reacted off the resistance level which is an overlap resistance that aligns with the 50% Fibonacci retracement and could drop from this level to our take profit.
Entry: 0.52043
Why we like it:
There is an overlap resistance level which aligns with the 50% Fibonacci retracement.
Stop loss: 0.52407
Why we like it:
There is a pullback resistance level that6 aligns with the 78.6% Fibonacci retracement.
Take profit: 0.51551
Why we like it:
There is a pullback support level.
Enjoying your TradingView experience? Review us!
Please be advised that the information presented on TradingView is provided to Vantage (‘Vantage Global Limited’, ‘we’) by a third-party provider (‘Everest Fortune Group’). Please be reminded that you are solely responsible for the trading decisions on your account. There is a very high degree of risk involved in trading. Any information and/or content is intended entirely for research, educational and informational purposes only and does not constitute investment or consultation advice or investment strategy. The information is not tailored to the investment needs of any specific person and therefore does not involve a consideration of any of the investment objectives, financial situation or needs of any viewer that may receive it. Kindly also note that past performance is not a reliable indicator of future results. Actual results may differ materially from those anticipated in forward-looking or past performance statements. We assume no liability as to the accuracy or completeness of any of the information and/or content provided herein and the Company cannot be held responsible for any omission, mistake nor for any loss or damage including without limitation to any loss of profit which may arise from reliance on any information supplied by Everest Fortune Group.

NZD/CHF Long H4 "Demand zone in play"Buy @ 0.52316
S/L @ 0.51254
T/P1 @ 0.54655
T/P2 @ ---------
R.R.R. @ 1/2
Pure Price Action Trading based on Pullback to Demand Key zone.
Good Trading to the Trading View Community! 👍

NZD/CHF: PAT + VPA 11/03/2024Good morning,
On this date, March 11, 2024, I will be conducting an analysis of the NZD/CHF currency pair.
Daily (1D): The daily timeframe has exhibited a bearish trend, initiating a downward movement from May 28, 2024, to August 5, 2024. During this period, the price encountered support at 0.494, subsequently rallying to 0.536. It is important to highlight that 0.536 represents the last swing low that was breached on the weekly chart. The price faced significant resistance at approximately 0.536 and subsequently tested the daily swing low at 0.519. Following this, the price entered a consolidation phase between 0.519 and 0.526, which persisted for 16 days before breaking below the daily swing low of 0.519.
The weekly and monthly moving averages (7EMA & 21EMA on the daily timeframe) indicate a sustained bearish trend. Presently, the support level is situated at 0.494. I anticipate that the price will trend towards 0.494 in the coming weeks.
I will be actively seeking trading opportunities targeting 0.494.
ThePipAssassin

NZDCHF TRADE SETUPWait for retest the entry level then take a trade for Sell otherwise skip this setup

NZDCHF Potential UpsidesHey Traders, in the coming week we are monitoring NZDCHF for a buying opportunity around 0.51700 zone, NZDCHF is trading in an uptrend and currently is in a correction phase in which it is approaching the trend at 0.51700 support and resistance area.
Trade safe, Joe.

