NZDCHF Set To Grow! BUY!
My dear friends,
Please, find my technical outlook for NZDCHF below:
The instrument tests an important psychological level 0.5394
Bias - Bullish
Technical Indicators: Supper Trend gives a precise Bullish signal, while Pivot Point HL predicts price changes and potential reversals in the market.
Target - 0.5411
About Used Indicators:
Super-trend indicator is more useful in trending markets where there are clear uptrends and downtrends in price.
———————————
WISH YOU ALL LUCK
CHFNZD trade ideas

NZD/CHF BEARS WILL DOMINATE THE MARKET|SHORT
Hello,Friends!
The BB upper band is nearby so NZD-CHF is in the overbought territory. Thus, despite the uptrend on the 1W timeframe I think that we will see a bearish reaction from the resistance line above and a move down towards the target at around 0.533.
✅LIKE AND COMMENT MY IDEAS✅

NZDCHF Technical Analysis! SELL!
My dear followers,
I analysed this chart on NZDCHF and concluded the following:
The market is trading on 0.5426 pivot level.
Bias - Bearish
Technical Indicators: Both Super Trend & Pivot HL indicate a highly probable Bearish continuation.
Target - 0.5407
Safe Stop Loss - 0.5434
About Used Indicators:
A super-trend indicator is plotted on either above or below the closing price to signal a buy or sell. The indicator changes color, based on whether or not you should be buying. If the super-trend indicator moves below the closing price, the indicator turns green, and it signals an entry point or points to buy.
———————————
WISH YOU ALL LUCK

NZDCHF bearishHello traders
this pair since mar-8 was tring to break above that resistance and didn't close above the resistance even one day.
Traders whats your idea can you spot and chart pattern?


NZDCHF: Bearish Continuation & Short Signal
NZDCHF
- Classic bearish formation
- Our team expects pullback
SUGGESTED TRADE:
Swing Trade
Short NZDCHF
Entry - 0.5442
Sl - 0.5456
Tp - 0.5416
Our Risk - 1%
Start protection of your profits from lower levels
❤️ Please, support our work with like & comment! ❤️

NZDCAD Buy Signal Hey guys! Its your girl forex potatoe.
NZDCHF has been ranging for some months now and we can also see a huge bullish divergence on Daily RSI.
Currently on this trade with a 1:2 risk/reward and its going to be a buy as its long overdue

If we reach to 0.53980, there is a high chance of uptrendIf we reach 0.53980, there is a high chance of an uptrend till 0.54500
📢 Signal: BUY NZDCHF 📈
Entry Point: 0.53980 🔍
Take Profit Targets:
- TP1: 0.54290 🎯
- TP2: 0.54460 🎯
SL: 0.53760 ⛔️
Ensure proper risk management when following signals! 💡
@Mr_Bombastic_Signal

NZDCHF..BUY..SHORTFX:NZDCHF BUY AND SHORT position can be taken in the specified ZONE
There is no position before the ZONE

NZDCHF Possible Sells ?I'm probably crazy, Yeah I know
What's up folks Brandon here. Today I have some possible sells on NZDCHF, I think sells just make overall sense as none of the data I have taken in builds my confidence in a buy.
Furthermore it feels like a buy seems to obvious. I am extremely cautious of when a set up feels obvious. I like to go against the grain, and No that doesn't mean I am simply interested in doing the exact opposite of what I think everyone is doing. It simply means trying to have my own opinion, one that isn't afraid of being judged because it is different.
I'm not here to be liked, I'm here to win trades, and even if this trade doesn't win, that's fine there will be others, at least I know I've tried to have a unique perspective on what it is I am seeing
Let's see what happens on NZDCHF in the next few hours or so

NZD/CHF SENDS CLEAR BEARISH SIGNALS|SHORT
Hello,Friends!
NZD/CHF pair is in the uptrend because previous week’s candle is green, while the price is evidently rising on the 1D timeframe. And after the retest of the resistance line above I believe we will see a move down towards the target below at 0.533 because the pair overbought due to its proximity to the upper BB band and a bearish correction is likely.
✅LIKE AND COMMENT MY IDEAS✅

NZDCHF BUYUpon analyzing the NZDCHF currency pair chart on a 4-hour time frame, it is observed that there has been a notable break in the trend line in the upward direction. This breakout suggests a potential bullish momentum in the market.
The strategy employed involves taking trades when the market retraces after the initial breakout. This approach anticipates the continuation of the upward trend with the next wave expected to move in an upward direction.
By identifying and capitalizing on retracements within the overall upward trend, traders aim to enter positions at favorable prices before the market resumes its upward trajectory.
It's crucial to exercise caution and employ risk management techniques to mitigate potential losses, as trading involves inherent risks. Additionally, staying updated with market developments and adjusting strategies accordingly is advisable to adapt to changing market conditions.
In summary, the analysis of the NZDCHF currency pair on the 4-hour time frame indicates a bullish sentiment following the breakout of the trend line, with a strategy focused on trading retracements to capture potential upward movements in the market.

NZDCHF BuyPolicy shift on the NZD would indicate higher prices, 1st target 0.56500 then towards 0.62

Swing trade NZDCHF #2After the interest news on CHF i still believe on this going down!
If you want to follow this idea please risk only 1%
Follow me for more details about my analysis, i trade based on indicators AND on Swing mode ONLY! 👑
Feel free to send me a dm, here on tradingview! 📩
Enjoy! 🦍

NZDCHF Expected Growth! BUY!
My dear friends,
My technical analysis for NZDCHF is below:
The market is trading on 0.5371 pivot level.
Bias - Bullish
Technical Indicators: Both Super Trend & Pivot HL indicate a highly probable Bullish continuation.
Target - 0.5388
Recommended Stop Loss - 0.5360
About Used Indicators:
A pivot point is a technical analysis indicator, or calculations, used to determine the overall trend of the market over different time frames.
———————————
WISH YOU ALL LUCK

Swing trade NZDCHFI see a long run to the down side soon. We surf the trends.
Follow me for more details about my analysis, i trade based on indicators AND on Swing mode ONLY! 👑
Feel free to send me a dm, here on tradingview! 📩
Enjoy! 🦍

NZDCHF: Is That a Trap?! 🇳🇿🇨🇭
NZDCHF can form a bearish trap after a potentially false violation of
a key horizontal support.
I see a local sign of strength of the buyers.
We can expect a pullback to 0.54
❤️Please, support my work with like, thank you!❤️

NZDCHF Bullish TradeHey Traders this is my master plan to loot NZDCHF Bank. My target is escape area. MAKE MONEY TAKE MONEY.


NZDCHF - Short from bearish order block ✅Hello traders!
‼️ This is my perspective on NZDCHF.
Technical analysis: As we can see here price changed the character and started to form lower lows and lower highs which means we are bearish, so I look for a short position if price makes a retracement to fill the imbalance higher and then rejects from bearish order block.
Fundamental news: On Thursday we will have news with high impact on CHF, we will see results of Interest Rate.
Like, comment and subscribe to be in touch with my content!

NZDCHF bearishIt is based on weekly, H4 indiators, daily R/S.
I am not a profi. It is no professional advice.

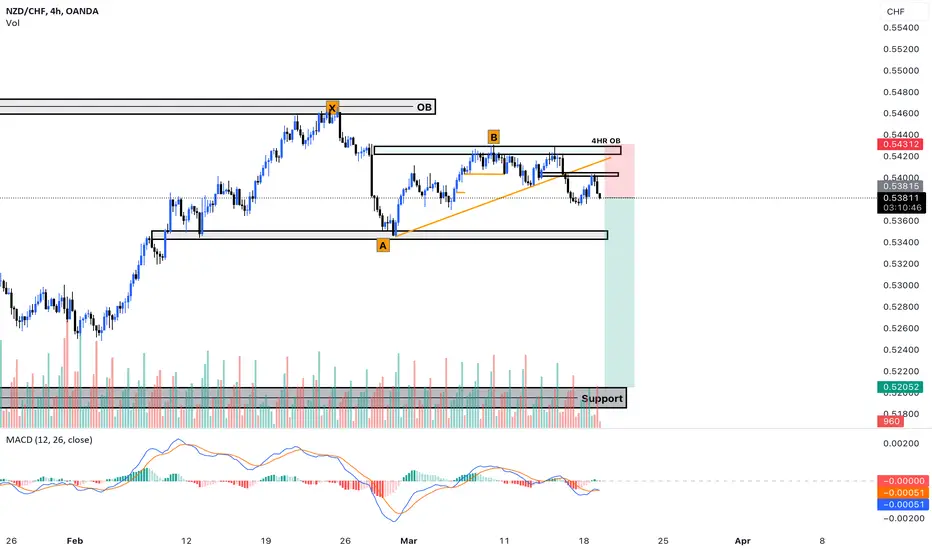
NZDCHF SELL After a retracement XA= 61.8 % B, we see that market broke the support trendline and retest of the zone that now became resistance. We have a bearish confirmation all the way to the demand zone.