NZDCHF: Market Sentiment & Forecast
The charts are full of distraction, disturbance and are a graveyard of fear and greed which shall not cloud our judgement on the current state of affairs in the NZDCHF pair price action which suggests a high likelihood of a coming move up.
Disclosure: I am part of Trade Nation's Influencer program and receive a monthly fee for using their TradingView charts in my analysis.
❤️ Please, support our work with like & comment! ❤️
CHFNZD trade ideas
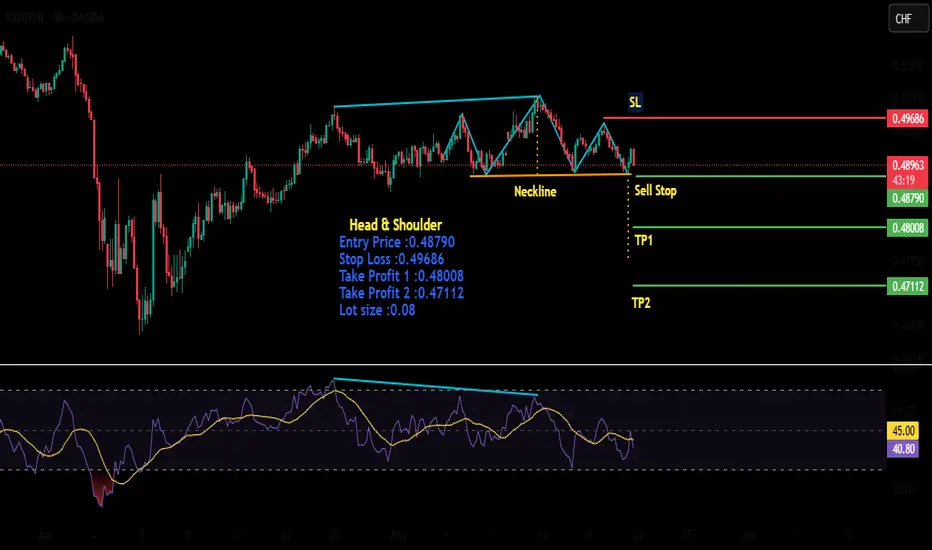
NZDCHF | Head & Shoulder PatternNZDCHF has printed a head and shoulder pattern with prior divergence on the top of bullish trend.
NZDCHF ANALYSISPrice is overall bearish but has been making a bullish rettacement. Price formed a double top at a and daily bearish variation at weekly AOI. Price also form an H4 LH, so I'd wait for price to break h4 support before taking sells.

NZD/CHF For Bullishwait for pull-back near by entry point and then go long
general trend is up trend
have fun :)

Looking Good for buy, Price at a support zoneNZDCHF looking good for Buy
Entry - 0.49023
SL - 0.48866
TP - 0.49564

NZDCHF H4We have break of structure, and we have our target which is our buyside Liquidity,so makert so market just filled the gap (imbalance) so it's going to react on our OB ( Order block) and continue going up

nzdchf up!hi dears
target tp 49330
- Like our ideas
- Comment on our ideas
- Share our ideas
Thanks a bunch for your support! 😊
Cheers,

NZDCHF SHORT Price did not do much the previous week, There was no break of any structure so now reposting the trade idea;
Market Structure bearish on HTFs DW
Entry at Daily AOi
Weekly Rejection At AOi
Previous Weekly Structure Point
Daily Rejection At AOi
Previous Structure point Daily
Around Psychological Level 0.50000
H4 Candlestick rejection
Levels 6.98
Entry 95%
REMEMBER : Trading is a Game Of Probability
: Manage Your Risk
: Be Patient
: Every Moment Is Unique
: Rinse, Wash, Repeat!
: Christ is King.

NZD/CHF For Bearish as pull-backyou can go short now
or
wait for entry point and then go short
general trend is up trend
current phase is pull-back
have fun :)

NZD-CHF Free Signal! Sell!
Hello,Traders!
NZD-CHF hit a horizontal
Resistance of 0.5002 and
Its a strong supply area so
We will be expecting a local
Pullback, which means we
Can enter a short trade
With the Take Profit of 0.4950
And the Stop Loss of 0.5016
Sell!
Comment and subscribe to help us grow!
Check out other forecasts below too!
Disclosure: I am part of Trade Nation's Influencer program and receive a monthly fee for using their TradingView charts in my analysis.

NZDCHF is going with the BIG TrendThe trend is down on Daily and 4H TF and 1H TF has finished 3 correction waves
and start going with the main Trend also we see triple tops pattern
we will sell at market price
Sell @ 0.4950
Stoploss @ 0.4990
Target @ 0.4790
RR 1 : 4

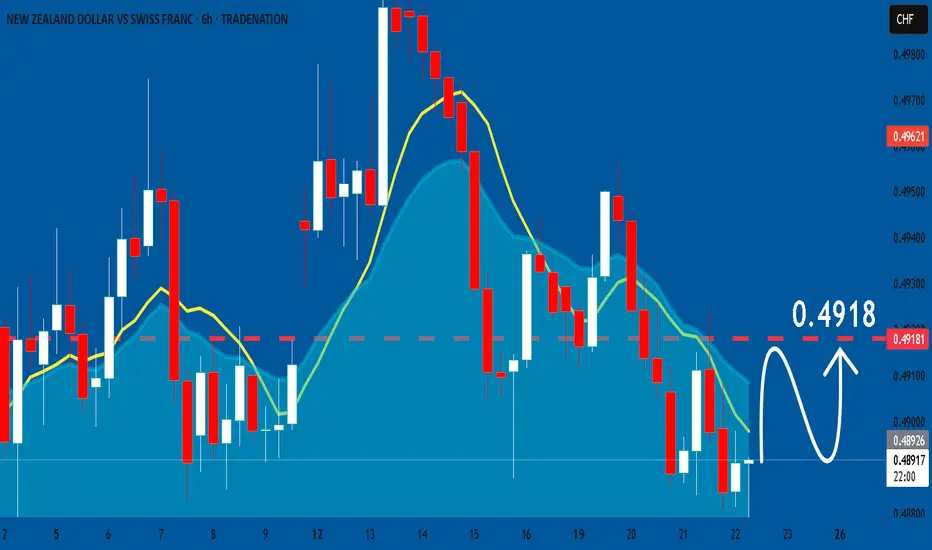
NZDCHF: Best Gap to Trade Today?! 📈NZDCHF appears to be a promising trade, out of the different gap openings we see today.
The price has reached a significant intraday resistance level.
I believe that the gap will likely be filled soon, as I am already observing signs of selling pressure on the hourly chart, including the formation of a double top pattern.
It is possible to anticipate a bearish movement towards the 0.4920 support level.

NZDCHF: Classic Gap Trade 🇳🇿🇨🇭
On a today's live stream with my students we discussed
a gap up opening on NZDCHF.
I have a strong feeling that it is going to be filled tonight.
A double top pattern on an hourly time frame and its neckline
violation provide a strong bearish confirmation.
Goal - 0.492
❤️Please, support my work with like, thank you!❤️
I am part of Trade Nation's Influencer program and receive a monthly fee for using their TradingView charts in my analysis.

NZD/CHF BEST PLACE TO SELL FROM|SHORT
Hello, Friends!
NZD/CHF pair is in the uptrend because previous week’s candle is green, while the price is clearly rising on the 1D timeframe. And after the retest of the resistance line above I believe we will see a move down towards the target below at 0.483 because the pair overbought due to its proximity to the upper BB band and a bearish correction is likely.
Disclosure: I am part of Trade Nation's Influencer program and receive a monthly fee for using their TradingView charts in my analysis.
✅LIKE AND COMMENT MY IDEAS✅

NZDCHF SHORtsEntry at Daily AOi
Weekly Rejection At AOi
Previous Weekly Structure Point
Daily Rejection At AOi
Previous Structure point Daily
Around Psychological Level 0.50000
H4 Candlestick rejection
Levels 6.98
Entry 95%
REMEMBER : Trading is a Game Of Probability
: Manage Your Risk
: Be Patient
: Every Moment Is Unique
: Rinse, Wash, Repeat!
: Christ is King.

NZD/CHF For Bullishyou can go long now
or
wait for pull-back near by entry point and then go long
have fun :)

nzdchf buy tradeThe Relative Strength Index (RSI) is showing an upward trend, indicating increasing momentum. Additionally, the Moving Average Convergence Divergence (MACD) is showing a bullish crossover, further supporting the potential for an upward move.

SHORT ON NZD/CHFNZD/CHF is currently falling from a major resistance level.
I will be selling this pair to the next level of demand/support for 150-200 pips.

nzdchf LongThe lines represents yesterday's high and Low, As you can see yesterday's high has been taken out showing buying pressure is live. We are looking to buy at the level shown which is a fair value gap, targeting yesterday's high

NZDCHF short: trend continuationMain trend – bearish.
Pull back to nearest s/r level at 0.49850 has been completed.
A lower high has now been formed.
Price is below the 200dma.
We are in all time low territory, so I will be targeting the 0.4700 round number and then evaluate again.
This is not a trade recommendation; it’s merely my own analysis. Trading carries a high level of risk, so only trade with money you can afford to lose and carefully manage your capital and risk. If you like my idea, please give a “boost” and follow me to get even more. Please comment and share your thoughts too!!
It’s not whether you are right or wrong, but how much money you make when you are right and how much you lose when you are wrong – George Soros

NZD/CHF ShortNDZ/CHF Has Broken Daily Support Reaching My Fibonnaci Level On The PullBack.
The Markets Are Very Unpredictable Right Now, But My Bias On The Swiss Franc Is That It Is Going To Start To Loosing Strength..
Since Reaching The Golden Zone On Fibonacci Retracment Nzd Had Broken Structure And Changed Character On The 30/1H Timeframe. I Have Longed The Retracement Back To My POI And I Am Now Anticipating A Lower Timeframe Break Of Structure And Change Of Charachter On The Lower Timeframes To Look For A Short Back To The Low Of The Fibonacci.
I Will Update Once Trade Is Valid.
Trade Safefully,
HK

NZDCHF: Short-Term Bullish OutlookNZDCHF: Short-Term Bullish Outlook
NZDCHF has formed a bullish Megaphone pattern, which signals a continuation of the existing uptrend when it aligns with the market’s direction.
After a minor pullback, the pair is expected to resume its short-term bullish movement. A breakout above 0.4925 could strengthen buying momentum, potentially pushing NZDCHF toward 0.4952 and 0.4980 in the near term.
You may find more details in the chart!
Thank you and Good Luck!
❤️PS: Please support with a like or comment if you find this analysis useful for your trading day❤️
Disclosure: I am part of Trade Nation's Influencer program and receive a monthly fee for using their TradingView charts in my analysis.

NZDCHF Elliott Wave AnalysisHello friends
In the NZDCHF currency pair chart, we are witnessing the formation of a complete Elliott wave pattern. These waves from 1 to 5 are clearly defined. Now this 5-wave pattern is an upward contracting triangle that usually forms in waves 1 or 4 or 5 or C.
Considering the counting of the previous waves, which is a wide ABC with a C wave extended or waves 1 to 3, we assume that we are facing wave 1 or 4. It is definitely not wave 5 or C.
So if it is wave 1, then it must correct at least 50 to 61.8% of Fibonacci from wave 1.
So the first target is the 04800 range.
If it is wave 5, it must go below the bottom of wave 3 and the second target is at least the 04600 range.
This movement usually occurs with a break of the trend line and a pullback to it.
Good luck and be profitable.
