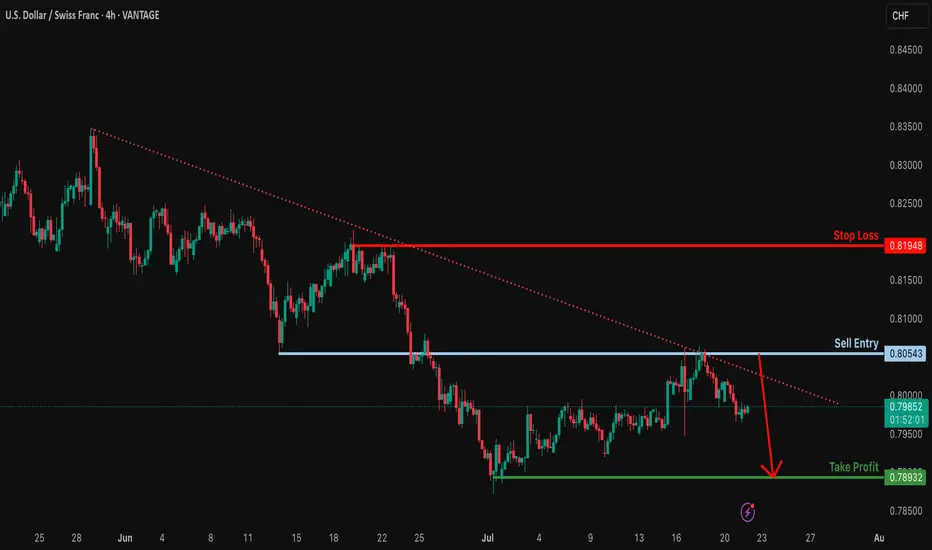
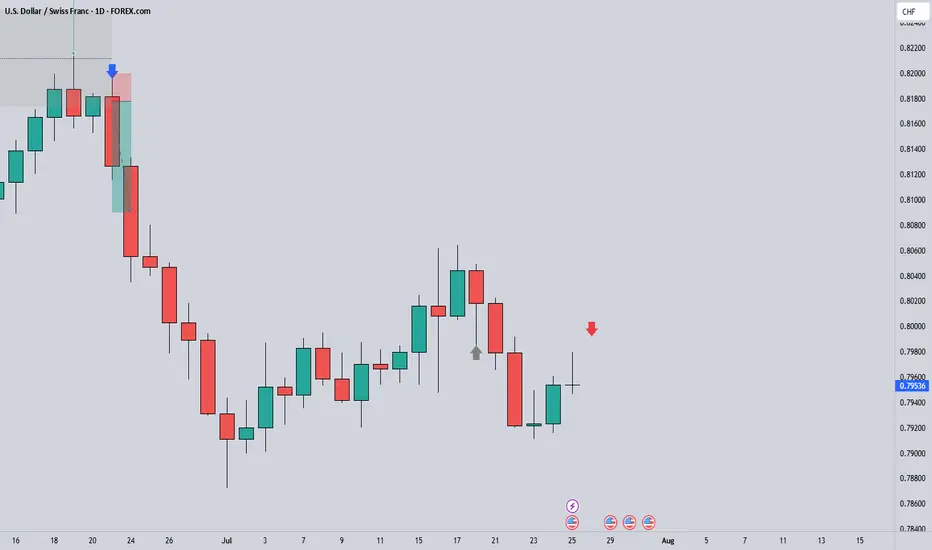
Bearish continuation?USD/CHF is rising towards the resistance level which is an overlap resistance and could drop from this level to our take profit.
Entry: 0.8054
Why we like it:
There is an overlap resistance level.
Stop loss: 0.8194
Why we like it:
There is a pullback resistance.
Take profit: 0.7893
Why we like it:
There a pullback support.
Enjoying your TradingView experience? Review us!
Please be advised that the information presented on TradingView is provided to Vantage (‘Vantage Global Limited’, ‘we’) by a third-party provider (‘Everest Fortune Group’). Please be reminded that you are solely responsible for the trading decisions on your account. There is a very high degree of risk involved in trading. Any information and/or content is intended entirely for research, educational and informational purposes only and does not constitute investment or consultation advice or investment strategy. The information is not tailored to the investment needs of any specific person and therefore does not involve a consideration of any of the investment objectives, financial situation or needs of any viewer that may receive it. Kindly also note that past performance is not a reliable indicator of future results. Actual results may differ materially from those anticipated in forward-looking or past performance statements. We assume no liability as to the accuracy or completeness of any of the information and/or content provided herein and the Company cannot be held responsible for any omission, mistake nor for any loss or damage including without limitation to any loss of profit which may arise from reliance on any information supplied by Everest Fortune Group.
CHFUSD trade ideas
SHORT ON USD/CHFUSD/CHF has given a nice head and shoulders pattern on the 2hr timeframe.
I expect price to sweep sell side liquidity below the uptrend line and tap into the next level of support.
Looking to catch over 132 pips to the downside.

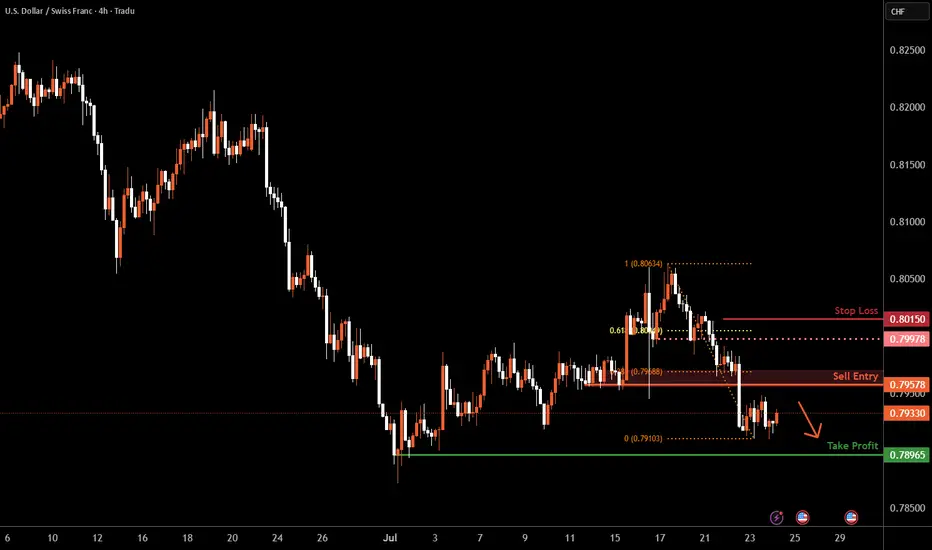
USD/CHF H4 | Pullback resistance at 61.8% Fibonacci retracementUSD/CHF is rising towards a pullback resistance and could potentially reverse off this level to drop lower.
Sell entry is at 0.7957 which is a pullback resistance that aligns closely with the 38.2% Fibonacci retracement.
Stop loss is at 0.815 which is a level that sits above the 61.8% Fibonacci retracement and a pullback resistance.
Take profit is at 0.7896 which is a swing-low support.
High Risk Investment Warning
Trading Forex/CFDs on margin carries a high level of risk and may not be suitable for all investors. Leverage can work against you.
Stratos Markets Limited (tradu.com ):
CFDs are complex instruments and come with a high risk of losing money rapidly due to leverage. 66% of retail investor accounts lose money when trading CFDs with this provider. You should consider whether you understand how CFDs work and whether you can afford to take the high risk of losing your money.
Stratos Europe Ltd (tradu.com ):
CFDs are complex instruments and come with a high risk of losing money rapidly due to leverage. 66% of retail investor accounts lose money when trading CFDs with this provider. You should consider whether you understand how CFDs work and whether you can afford to take the high risk of losing your money.
Stratos Global LLC (tradu.com ):
Losses can exceed deposits.
Please be advised that the information presented on TradingView is provided to Tradu (‘Company’, ‘we’) by a third-party provider (‘TFA Global Pte Ltd’). Please be reminded that you are solely responsible for the trading decisions on your account. There is a very high degree of risk involved in trading. Any information and/or content is intended entirely for research, educational and informational purposes only and does not constitute investment or consultation advice or investment strategy. The information is not tailored to the investment needs of any specific person and therefore does not involve a consideration of any of the investment objectives, financial situation or needs of any viewer that may receive it. Kindly also note that past performance is not a reliable indicator of future results. Actual results may differ materially from those anticipated in forward-looking or past performance statements. We assume no liability as to the accuracy or completeness of any of the information and/or content provided herein and the Company cannot be held responsible for any omission, mistake nor for any loss or damage including without limitation to any loss of profit which may arise from reliance on any information supplied by TFA Global Pte Ltd.
The speaker(s) is neither an employee, agent nor representative of Tradu and is therefore acting independently. The opinions given are their own, constitute general market commentary, and do not constitute the opinion or advice of Tradu or any form of personal or investment advice. Tradu neither endorses nor guarantees offerings of third-party speakers, nor is Tradu responsible for the content, veracity or opinions of third-party speakers, presenters or participants.
USD/CHF LongPrice broke structure and retraced back to a major support area that was resistance in the past the bulls are stepping in this week.
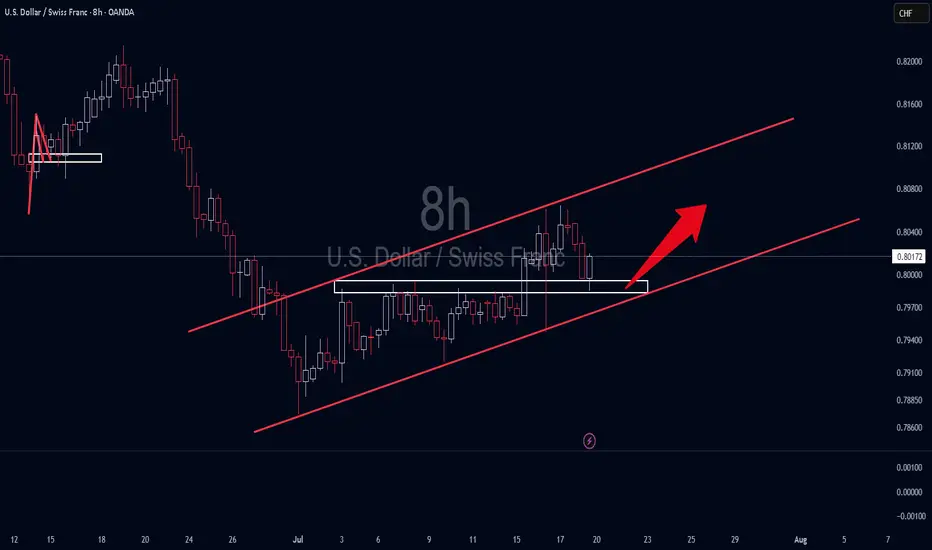
Buy usdchfStrong buy expected from marked level
Already oversold in months chart
Here strong bullish correction needed

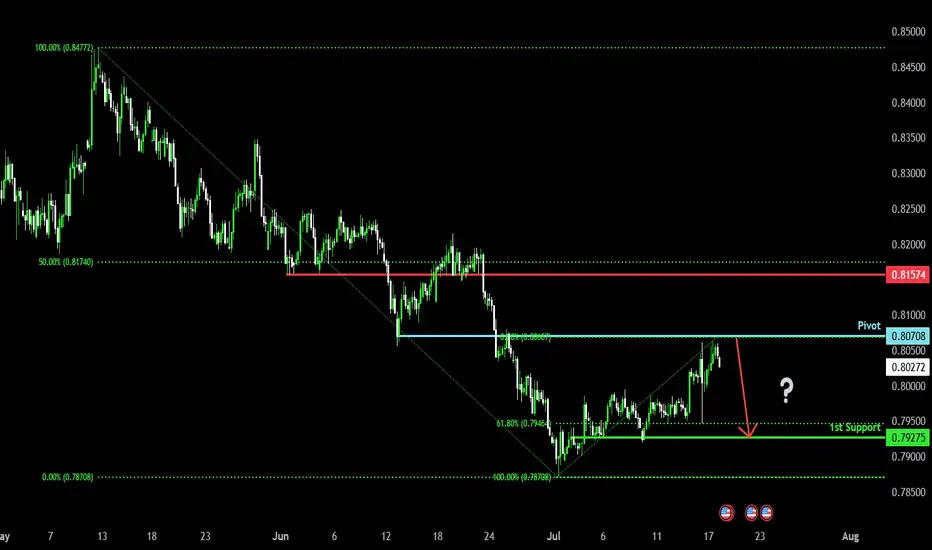
Bearish reversal off pullback resistance?The Swissie (USD/CHF) has rejected off the pivot and could drop to the 1st support which is a pullback support that is slightly below the 61.8% Fibonacci retracement.
Pivot: 0.8070
1st Support: 0.7927
1st Resistance: 0.8157
Risk Warning:
Trading Forex and CFDs carries a high level of risk to your capital and you should only trade with money you can afford to lose. Trading Forex and CFDs may not be suitable for all investors, so please ensure that you fully understand the risks involved and seek independent advice if necessary.
Disclaimer:
The above opinions given constitute general market commentary, and do not constitute the opinion or advice of IC Markets or any form of personal or investment advice.
Any opinions, news, research, analyses, prices, other information, or links to third-party sites contained on this website are provided on an "as-is" basis, are intended only to be informative, is not an advice nor a recommendation, nor research, or a record of our trading prices, or an offer of, or solicitation for a transaction in any financial instrument and thus should not be treated as such. The information provided does not involve any specific investment objectives, financial situation and needs of any specific person who may receive it. Please be aware, that past performance is not a reliable indicator of future performance and/or results. Past Performance or Forward-looking scenarios based upon the reasonable beliefs of the third-party provider are not a guarantee of future performance. Actual results may differ materially from those anticipated in forward-looking or past performance statements. IC Markets makes no representation or warranty and assumes no liability as to the accuracy or completeness of the information provided, nor any loss arising from any investment based on a recommendation, forecast or any information supplied by any third-party.
USDCHF Short ProjectHi guys...😎
My custom indicator says it's time to do a Short Project on USDCHF with 3 key reasons:
1. Price Drivers: institutional shorting
2. Trend: down
3. Momentum: bearish
Action: waiting for entry on the intraday timeframe (entry will be published further)
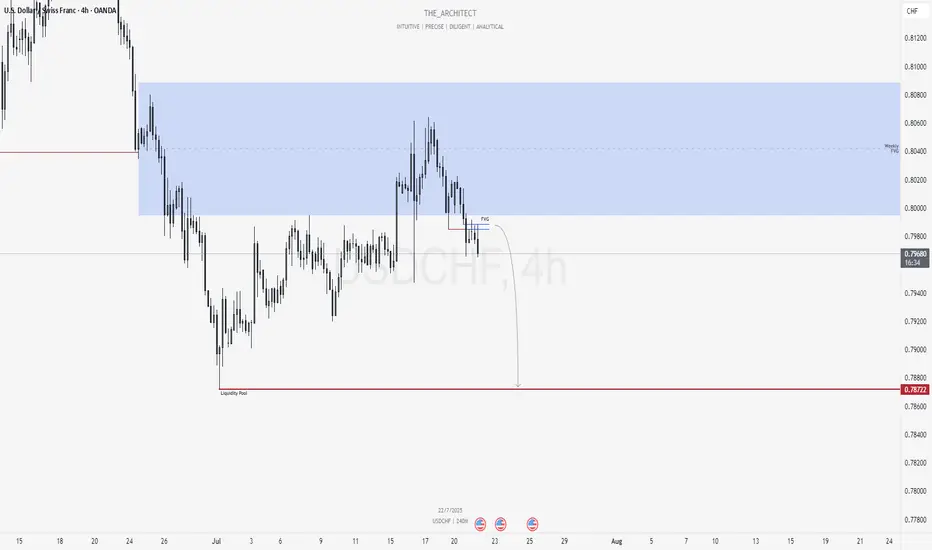
USDCHF: Bearish Shift Offers Premium Selling ZonesGreetings Traders,
At present, USDCHF is exhibiting a clear shift in institutional order flow toward the bearish side. In response, we aim to align with this directional bias by identifying high-probability selling opportunities within premium price zones.
Higher Timeframe Context:
The weekly timeframe remains bearish, offering a macro-level bias. Price recently pulled back into the weekly Fair Value Gap (FVG), a key internal range area. With this retracement complete, we now expect the market to begin its delivery toward external liquidity pools located in discounted price zones.
Key Observations on H4:
Market Structure Shift (MSS): USDCHF has recently presented a bearish MSS on the H4, confirming a change in the internal structure and further validating the bearish narrative.
H4 Fair Value Gap Rejection: Following the MSS, price retraced into a newly formed H4 FVG. This area now serves as a short-term institutional resistance zone.
Sell Opportunity Zone: This H4 FVG provides a valid zone to seek confirmation-based entries on the lower timeframes (e.g., M15), with the objective of targeting downside liquidity.
Trading Plan:
Entry Strategy: Look for short setups via confirmation on the M15 timeframe within the current H4 FVG zone.
Targets: Focus on internal liquidity pools within discounted price levels, with the broader objective being the external liquidity resting beneath recent swing lows.
For a detailed market walkthrough and in-depth execution zones, be sure to watch this week’s Forex Market Breakdown:
Kind Regards,
The Architect 🏛️📉
Buy usdchfStrong buy expected with minimum 700 pips target
Monthly and weekly still oversold pair
Strong bullish correction expected from this strong buying area
Wait to break the inner week down trend then enter into buy trade

USDCHF Technical Analysis – Key Support Under PressureUSDCHF Technical Analysis – Key Support Under Pressure: Breakdown or Reversal?
As shown in the chart, USDCHF is currently trading at one of its most critical levels in recent years, testing a major historical support zone after reaching multi-year lows.
🔻 If this key support fails to hold, the next potential downside targets are:
0.79210
0.78540
🔹 However, if the pair finds support here and rebounds, the next resistance levels to watch are:
0.80500
0.81780
Should the bullish momentum continue, a major resistance lies around 0.83000.
📌 This zone could be a turning point for USDCHF. Keep a close eye on lower timeframes for confirmation of the next move.
📊 Follow for more real-time updates and price action breakdowns!

USDCHF – The Wind Still Blows South!USDCHF remains trapped below the descending trendline since June. Every bullish attempt has been sharply rejected – showing sellers are still in control.
Fresh U.S. data just released:
Jobless claims dropped → strong labor market → Fed likely to keep rates high → USD gains strength.
Manufacturing PMI beat expectations → resilient economy → more reason for a hawkish Fed.
But don’t forget: CHF is attracting safe-haven flows, adding downward pressure on USD!
If price fails to break above 0.7990 and gets rejected at the trendline, a drop toward 0.7890 is likely.
Strategy: Look to SELL around the trendline – follow the trend, not your emotions!

USDCHF – Two Levels, One PlanWe’re watching two key resistance zones for a potential short.
If the first level holds and gives a signal, we’ll short from there.
If that level breaks, we may switch to a short-term buy up to the next level.
Once price reaches the second resistance, we’ll be ready for another sell opportunity.
No predictions — just following the flow.

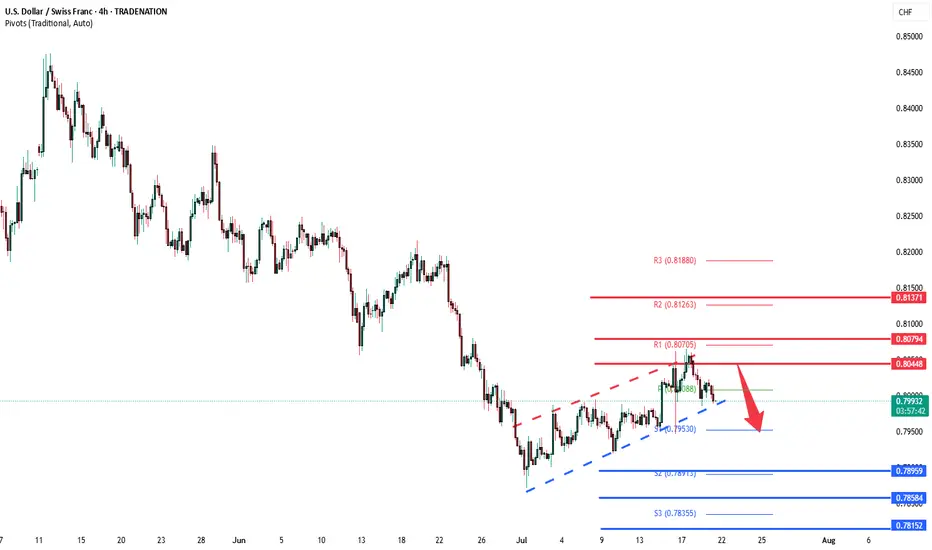
USDCHF extension to the downside The USD/CHF pair is currently trading with a bearish bias, aligned with the broader downward trend. Recent price action shows a retest of the falling resistance, suggesting a temporary relief rally within the downtrend.
Key resistance is located at 0.8045, a prior consolidation zone. This level will be critical in determining the next directional move.
A bearish rejection from 0.8045 could confirm the resumption of the downtrend, targeting the next support levels at 0.7900, followed by 0.7860 and 0.7810 over a longer timeframe.
Conversely, a decisive breakout and daily close above 0.8045 would invalidate the current bearish setup, shifting sentiment to bullish and potentially triggering a move towards 0.8080, then 0.8140.
Conclusion:
The short-term outlook remains bearish unless the pair breaks and holds above 0.8045. Traders should watch for price action signals around this key level to confirm direction. A rejection favours fresh downside continuation, while a breakout signals a potential trend reversal or deeper correction.
This communication is for informational purposes only and should not be viewed as any form of recommendation as to a particular course of action or as investment advice. It is not intended as an offer or solicitation for the purchase or sale of any financial instrument or as an official confirmation of any transaction. Opinions, estimates and assumptions expressed herein are made as of the date of this communication and are subject to change without notice. This communication has been prepared based upon information, including market prices, data and other information, believed to be reliable; however, Trade Nation does not warrant its completeness or accuracy. All market prices and market data contained in or attached to this communication are indicative and subject to change without notice.
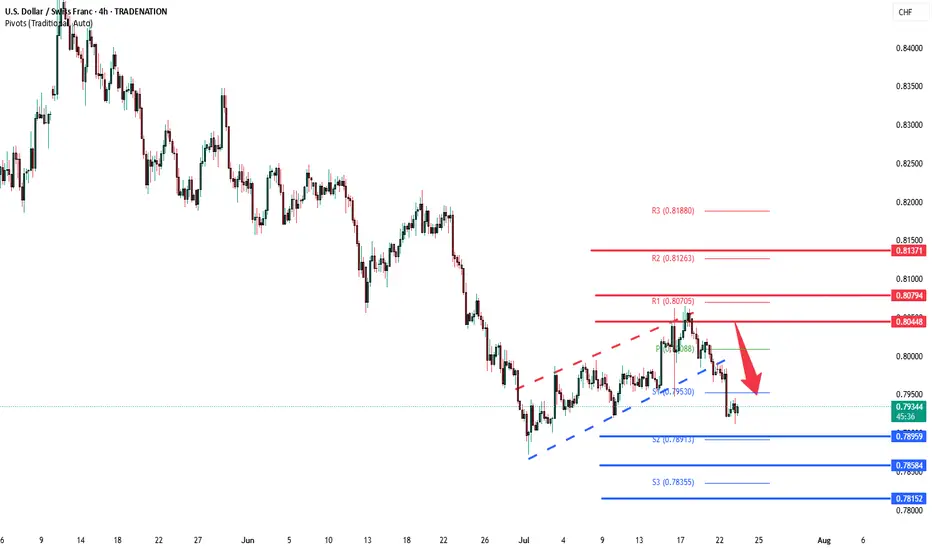
USDCHF Bearish oversold rally resistance at 0.8045The USD/CHF pair is currently trading with a bearish bias, aligned with the broader downward trend. Recent price action shows a retest of the falling resistance, suggesting a temporary relief rally within the downtrend.
Key resistance is located at 0.8045, a prior consolidation zone. This level will be critical in determining the next directional move.
A bearish rejection from 0.8045 could confirm the resumption of the downtrend, targeting the next support levels at 0.7900, followed by 0.7860 and 0.7810 over a longer timeframe.
Conversely, a decisive breakout and daily close above 0.8045 would invalidate the current bearish setup, shifting sentiment to bullish and potentially triggering a move towards 0.8080, then 0.8140.
Conclusion:
The short-term outlook remains bearish unless the pair breaks and holds above 0.8045. Traders should watch for price action signals around this key level to confirm direction. A rejection favours fresh downside continuation, while a breakout signals a potential trend reversal or deeper correction.
This communication is for informational purposes only and should not be viewed as any form of recommendation as to a particular course of action or as investment advice. It is not intended as an offer or solicitation for the purchase or sale of any financial instrument or as an official confirmation of any transaction. Opinions, estimates and assumptions expressed herein are made as of the date of this communication and are subject to change without notice. This communication has been prepared based upon information, including market prices, data and other information, believed to be reliable; however, Trade Nation does not warrant its completeness or accuracy. All market prices and market data contained in or attached to this communication are indicative and subject to change without notice.
USDCHF looking Bearish!!USDCHF Looking for sell side as it holding at trendline support.
Safe Player go after breaking trendline and risky can look out for now before the US Session.
Support Zone is 0.79200, We can expect a buy from that zone or Buys above 0.79900 after breaking and retesting the resistance.

USDCHFI see a wycoff pattern here that interests me into opening a short position after creating the identified phases. shooting for a tp 2 here.

USDCHF Will Move Lower! Sell!
Here is our detailed technical review for USDCHF.
Time Frame: 4h
Current Trend: Bearish
Sentiment: Overbought (based on 7-period RSI)
Forecast: Bearish
The market is on a crucial zone of supply 0.799.
The above-mentioned technicals clearly indicate the dominance of sellers on the market. I recommend shorting the instrument, aiming at 0.794 level.
P.S
Please, note that an oversold/overbought condition can last for a long time, and therefore being oversold/overbought doesn't mean a price rally will come soon, or at all.
Disclosure: I am part of Trade Nation's Influencer program and receive a monthly fee for using their TradingView charts in my analysis.
Like and subscribe and comment my ideas if you enjoy them!

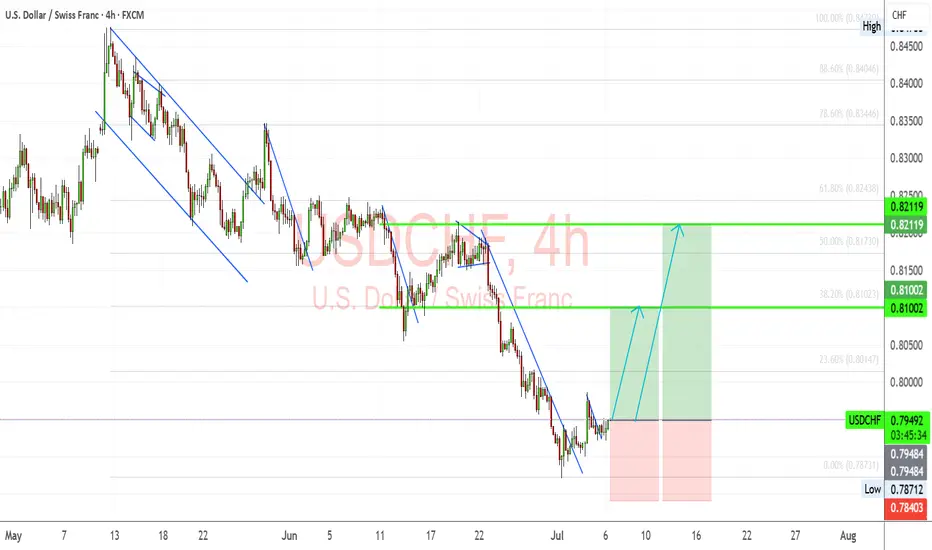
USDCHF – Reversal Setup Building Above 0.79 SupportUSDCHF has broken out of its steep downward channel and is now forming a potential bullish reversal base above the key support zone at 0.7940–0.7870. Price action suggests momentum could be shifting in favor of the bulls, with upside targets sitting at 0.8100 (Fibonacci 38.2%) and 0.8210 (previous resistance and 61.8% retracement).
🔍 Technical Structure:
Clean descending channel now broken.
Price holding above May–June lows, forming a potential higher low.
First target: 0.8100 zone.
Final target: 0.8210 resistance.
Stop: Below 0.7870 structure low.
🧠 Fundamentals:
USD Outlook: Bullish tilt as Fed members push back against early cuts. Markets eye July 11 CPI, which could confirm inflation stickiness and reinforce USD strength.
CHF Outlook: Weak bias, as the SNB has turned more dovish. With safe-haven demand easing and growth outlook softening, CHF is losing favor across the board.
Global sentiment: Risk appetite improving as geopolitical concerns (e.g., Strait of Hormuz, Iran) temporarily ease—removing upward pressure on CHF.
⚠️ Risk Factors:
A surprise drop in U.S. CPI this week could shift USDCHF sharply lower.
Renewed geopolitical tensions may revive CHF demand suddenly.
Fed speak and yields must remain supportive for this structure to play out.
🔁 Asset Dynamics:
USDCHF tends to lag behind DXY and USDJPY. Watch those pairs for confirmation. It can also follow moves in US10Y yields and react inversely to Gold volatility (safe-haven flow shifts).
✅ Trade Bias: Bullish
TP1: 0.8100
TP2: 0.8210
SL: Below 0.7870
Event to Watch: 🇺🇸 U.S. CPI – July 11
📌 If CPI confirms sticky inflation, USDCHF could rally toward the upper retracement zones quickly. Watch for confirmation candles near breakout.
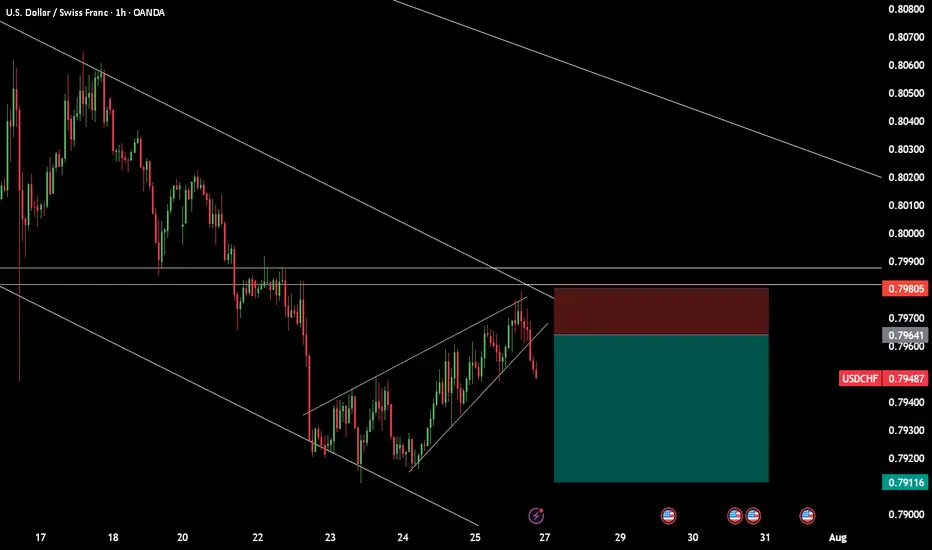
USDCHFPossible move to the down side. Waiting for a retracement around the 0.79650 zone before we go short.
@musehanezwothe
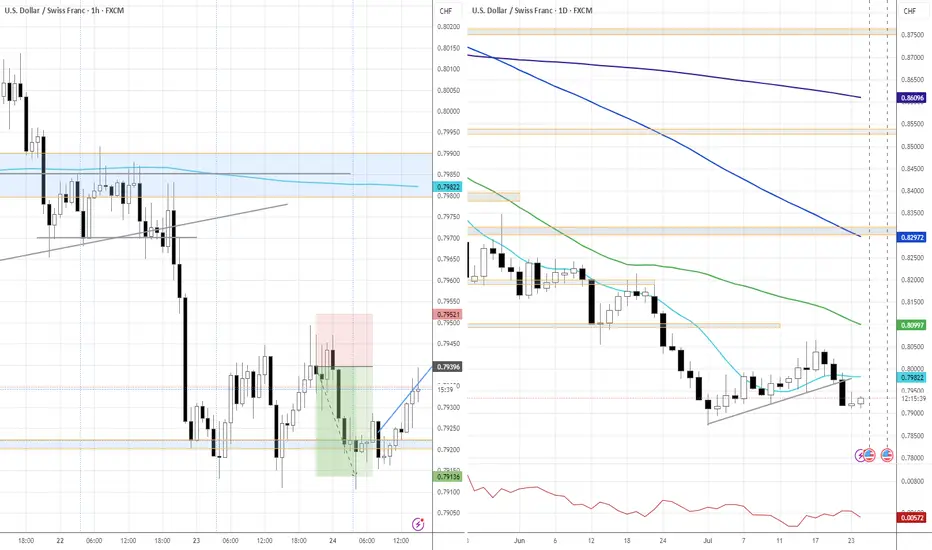
USDCHF 23.07.25~+ Pressure on Powell, Waller is dovish
~+ Anticipation of the Trade deals deadline
+ Risk-on general sentiment after Japan trade deal
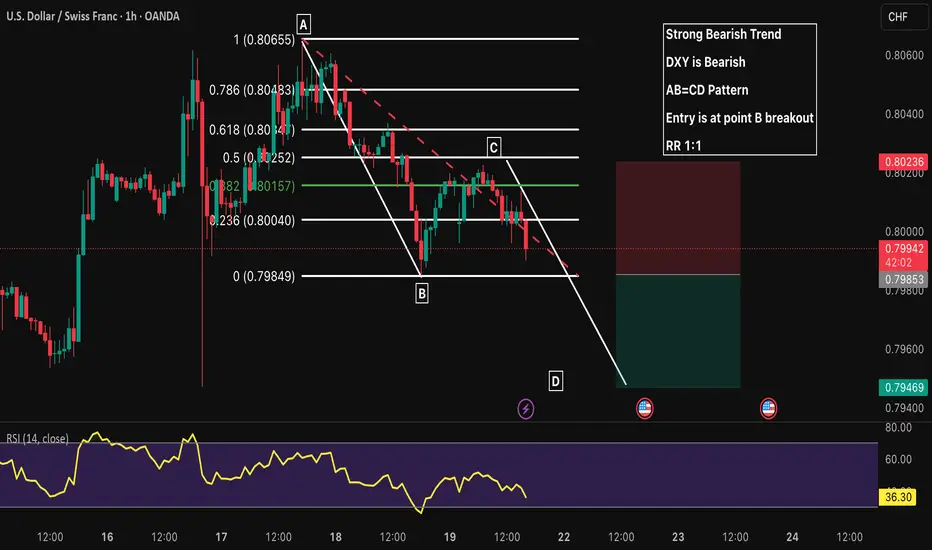
USDCHF 1H Short Strong Bearish Trend
DXY is Bearish
AB=CD Pattern
Entry is at point B breakout
RR 1:1
USDCHF Will Grow! Long!
Here is our detailed technical review for USDCHF.
Time Frame: 9h
Current Trend: Bullish
Sentiment: Oversold (based on 7-period RSI)
Forecast: Bullish
The market is approaching a significant support area 0.796.
The underlined horizontal cluster clearly indicates a highly probable bullish movement with target 0.804 level.
P.S
We determine oversold/overbought condition with RSI indicator.
When it drops below 30 - the market is considered to be oversold.
When it bounces above 70 - the market is considered to be overbought.
Disclosure: I am part of Trade Nation's Influencer program and receive a monthly fee for using their TradingView charts in my analysis.
Like and subscribe and comment my ideas if you enjoy them!

USDCHF in Uptrend ContinuationBuy Limit
Entry Price 0.7995
Stop Loss 0.7968
Risk 1%
Lot Size 0.74
TP (1RR) 0.8022
TP (3RR) 0.8076
