USDCHF LONG FORECAST Q2 W19 D7 Y25USDCHF LONG FORECAST Q2 W19 D7 Y25
Professional Risk Managers👋
Welcome back to another FRGNT chart update📈
Diving into some Forex setups using predominantly higher time frame order blocks alongside confirmation breaks of structure.
Let’s see what price action is telling us today!
💡Here are some trade confluences📝
✅Weekly order block rejection
✅Daily order block rejection
✅15’ order block
✅Intraday bullish breaks of structure
🔑 Remember, to participate in trading comes always with a degree of risk, therefore as professional risk managers it remains vital that we stick to our risk management plan as well as our trading strategies.
📈The rest, we leave to the balance of probabilities.
💡Fail to plan. Plan to fail.
🏆It has always been that simple.
❤️Good luck with your trading journey, I shall see you at the very top.
🎯Trade consistent, FRGNT X
CHFUSD trade ideas
USDCHF SUPPLY ZONE (DOWNTREND)PATTERN. Key Technical Levels:
Support: The pair has found support near 0.8220, which has helped stabilize its recent movements .
Resistance: Immediate resistance is observed at 0.8333, with a more significant resistance zone between 0.8482 and 0.8550, aligning with the 38.2% Fibonacci retracement level from the 0.9200 to 0.8038 decline .
Trading Strategy:
Bullish Scenario: A sustained move above 0.8333 could open the path toward the 0.8482–0.8550 resistance zone.
Bearish Scenario: Failure to hold above 0.8220 may lead to a retest of the recent low at 0.8038, potentially resuming the broader downtrend.
Traders should remain vigilant for the Federal Reserve's announcement, as it may introduce volatility and influence the USD/CHF's direction.

USDCHF INTRADAY sideways consolidation Recent price action in USDCHF suggests an oversold bounce, with resistance capping gains at the 0.8300 level.
The continuation of selling pressure could extend the downside move, with key support levels at 0.8130, followed by 0.8090 and 0.8050.
Alternatively, a confirmed breakout above 0.8300, accompanied by a daily close higher, would invalidate the bearish outlook. In this scenario, USDCHF could target 0.8365, with further resistance at 0.8400 and 0.8470.
Conclusion:
The price remains below pivotal level, with 0.8300 acting as a key resistance. Failure to break above this level could reinforce downside risks, while a breakout could shift momentum back in favour of bulls. Traders should watch for confirmation signals before positioning for the next move.
This communication is for informational purposes only and should not be viewed as any form of recommendation as to a particular course of action or as investment advice. It is not intended as an offer or solicitation for the purchase or sale of any financial instrument or as an official confirmation of any transaction. Opinions, estimates and assumptions expressed herein are made as of the date of this communication and are subject to change without notice. This communication has been prepared based upon information, including market prices, data and other information, believed to be reliable; however, Trade Nation does not warrant its completeness or accuracy. All market prices and market data contained in or attached to this communication are indicative and subject to change without notice.

USDCHF - EVERYONE Lets make million tonightTeam,
please do very small first
i think we may get a chance buy the second dipped
so take it easy.. the DOW may fall hard later tonight
WHY? Because RATE announcement will create high volatility
which will bring the USDCHF deeper into our double up entry.
We will send out US30 AND NAS later tonight.
Lets kill the market together

USDCHF set for big move? Fed meeting could trigger breakoutUSDCHF is stuck in a tight range ahead of today’s Fed meeting, with technical patterns pointing to a possible breakout. A dovish Fed could trigger a move toward 0.8872 or lower, with risk-reward setups as high as 11:1.
This content is not directed to residents of the EU or UK. Any opinions, news, research, analyses, prices or other information contained on this website is provided as general market commentary and does not constitute investment advice. ThinkMarkets will not accept liability for any loss or damage including, without limitation, to any loss of profit which may arise directly or indirectly from use of or reliance on such information.

TOKYO knows something...SUS @ 0.8270OANDA:USDCHF
Tokyo opened as usual...but so hard to swallow...that they control direction of USD and more surprisingly CHF...
btw...just shorted USDCHF ...watch this 🙈
SUS @ 0.8270
and y'all what that means for Gold 🪙🥇 😉
sorry no trendlines OB or FVG or fib ...since unreliable for execution of investment grade...they monitor DD and other KPIs like RR and return in K/hr...
this is a system generated alert based on statistical significance...kinda like math.
can't predict manipulation magnitude...but usually -33p...our SL is $ value based on position size...
🥂

Bullish bounce?The Swissie (USD/CHF) is reacting off the pivot which is an overlap support and could bounce to the 1st resistance which lines up with the 38.2% Fibonacci retracement.
Pivot: 0.8199
1st Support: 0.8116
1st Resistance: 0.8371
Risk Warning:
Trading Forex and CFDs carries a high level of risk to your capital and you should only trade with money you can afford to lose. Trading Forex and CFDs may not be suitable for all investors, so please ensure that you fully understand the risks involved and seek independent advice if necessary.
Disclaimer:
The above opinions given constitute general market commentary, and do not constitute the opinion or advice of IC Markets or any form of personal or investment advice.
Any opinions, news, research, analyses, prices, other information, or links to third-party sites contained on this website are provided on an "as-is" basis, are intended only to be informative, is not an advice nor a recommendation, nor research, or a record of our trading prices, or an offer of, or solicitation for a transaction in any financial instrument and thus should not be treated as such. The information provided does not involve any specific investment objectives, financial situation and needs of any specific person who may receive it. Please be aware, that past performance is not a reliable indicator of future performance and/or results. Past Performance or Forward-looking scenarios based upon the reasonable beliefs of the third-party provider are not a guarantee of future performance. Actual results may differ materially from those anticipated in forward-looking or past performance statements. IC Markets makes no representation or warranty and assumes no liability as to the accuracy or completeness of the information provided, nor any loss arising from any investment based on a recommendation, forecast or any information supplied by any third-party.

VERY CLEAR, MORE SELL TREND ON USDCHFI saw a retracement on USDCHF, I waited patiently for a direction after today's impulse moves. its so clear we are riding a downtrend all retracement to cheap prices has been concluded so join me has we ride the trend down this weekend for "NFP"

USDCHF - another opportunityTeam, this week, we done many trades with USDCHF and very successfully,
Tomorrow RATE announce and NO change.
that mean the USD will like moving strong against most currencies,
We found opportunity to RE-ENTER the USDCHF again
Target base on the chart.
TARGET 1 - reduce 30% volume
TARGET 2 - reduce another 50%
Target 3 - close the remaining
Please follow it accordingly. Do NOT forget to bring trail stop loss to BE once target 1 meet.

USD/CHF: Break and Retest of Broken SupportUSD/CHF has broken down from a long-term range — and is now retesting that breakdown area as
the market weighs diverging macro signals. With safe-haven demand lifting the franc and improving
US data supporting the dollar, this is a classic battle between structure and sentiment.
Flight to Safety vs Improving US Economic Data
The initial break lower in April came as money flowed into the franc on a wave of risk aversion and
safe-haven demand following Trump’s tariff announcement. But sentiment has shifted in recent
weeks. Friday’s nonfarm payrolls report showed stronger-than-expected job creation and a rise in
labour force participation, while weekly hours remained steady. Although wage growth softened
slightly, there was nothing in the data to accelerate rate cut bets — and that’s given the dollar some
breathing room.
At the same time, the Swiss National Bank is facing the opposite challenge. Annual CPI for April came
in flat at 0.0%, down from 0.3% in March and uncomfortably close to outright deflation. With the
SNB already having delivered a rate cut in March — ahead of the Fed — markets are now
questioning whether negative interest rates could return if inflation stays subdued. That policy
divergence has fuelled a modest retracement in USD/CHF over the past fortnight.
Retesting the Breakdown
On the weekly candle chart, the break of long-term support in April marked a decisive shift in
structure. The pair had been trapped in a wide range for months, but the sell-off sliced through the
bottom of that range, confirming bearish momentum and ushering in a new phase of downside
exploration. Since then, we’ve seen a period of sideways consolidation as USD/CHF grinds along the
lower end of the chart.
Crucially, the pair has now retested that old support level — and it’s struggling to reclaim it. Price
has stalled beneath this zones, which reinforces the idea that it has flipped from support to
resistance.
USD/CHF Weekly Candle Chart
Past performance is not a reliable indicator of future results
Zooming in on the daily chart, the recent bounce off April’s lows has run into trouble. Price action
over the last week has carved out a small double top-type formation following the retracement —
not a classic top in the trend sense, but a clear sign of hesitation. This stalling comes right at the
21EMA, offering dynamic resistance in line with the broader bearish trend.
A clean break below last week’s lows would be a strong signal that the corrective bounce is over —
and could open the door for a retest of April’s low, or potentially deeper downside, in line with the
prevailing trend and market structure.
This is a classic break-and-retest setup — and with fundamentals pushing in both directions, the
technical levels will likely determine who wins the next round.
USD/CHF Daily Candle Chart
Past performance is not a reliable indicator of future results
Disclaimer: This is for information and learning purposes only. The information provided does not
constitute investment advice nor take into account the individual financial circumstances or
objectives of any investor. Any information that may be provided relating to past performance is not
a reliable indicator of future results or performance. Social media channels are not relevant for UK
residents.
Spread bets and CFDs are complex instruments and come with a high risk of losing money rapidly
due to leverage. 83% of retail investor accounts lose money when trading spread bets and CFDs
with this provider. You should consider whether you understand how spread bets and CFDs work
and whether you can afford to take the high risk of losing your money.

USDCHF - ENTER SLOWLY NOWTeam, we have been busy, but today we kill the USDCHF almost few times
also yesterday as well
Now it is time to buy slowly
follow the instruction
DOUBLE at the price given second chart.
please enter slowly with risk management
PREPARING FOR SHORT POSITIONSUSD/CHF 4H - With this market we are simply waiting for price to finish correcting itself, trading price up and into the Supply Zone above. Once it has done we can then look to go short.
We want to see price trade up and into this zone as we can expect enough Supply to be introduced to flip the balance.
Those who bought into the market will look to remove orders, essentially taking profit and those looking to short will be looking to enter in once confirmation has been given to get involved.
Confirmation will come via a break of structure to the downside, its tells us that the correction has finished and the new impulse is ready to take place.
The end of one trend and the start of another, once we have that confirmation, we look inside the impulse that broke the structure for areas that price can pullback up and into, this is to set a lower high before the next move lower.

ORBimport pandas as pd
import matplotlib.pyplot as plt
# Load your data (CSV must have 'Datetime', 'Open', 'High', 'Low', 'Close')
df = pd.read_csv('EURUSD_15min.csv', parse_dates= )
df.set_index('Datetime', inplace=True)
# Define the ORB time window (e.g., 9:00 to 9:15)
orb_start = '09:00:00'
orb_end = '09:15:00'
# Extract opening range
orb_range = df.between_time(orb_start, orb_end)
orb_high = orb_range .max()
orb_low = orb_range .min()
# Identify breakout
df = df > orb_high
df = df < orb_low
# Plot breakout levels and entries
plt.figure(figsize=(14,6))
plt.plot(df , label='Close Price', alpha=0.7)
plt.axhline(orb_high, color='green', linestyle='--', label='ORB High')
plt.axhline(orb_low, color='red', linestyle='--', label='ORB Low')
# Mark breakout points
plt.plot(df [df ].index, df [df ] , '^', color='green', label='Long Entry')
plt.plot(df [df ].index, df [df ] , 'v', color='red', label='Short Entry')
plt.title('EUR/USD ORB Strategy (15-Min)')
plt.legend()
plt.grid()
plt.show()


06.05.25 Morning ForecastPairs on Watch -
FOREXCOM:COFFEE
FX:AUDJPY
FX:GBPUSD
FX:USDCHF
A short overview of the instruments I am looking at for today, multi-timeframe analysis down to what I will be looking at for an entry. Enjoy!

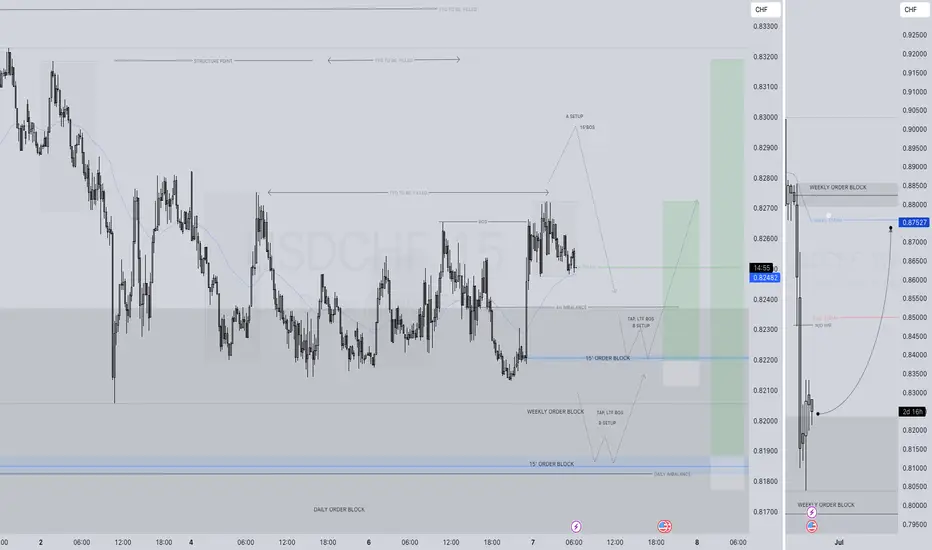
USDCHF LONG FORECAST Q2 W19 D6 Y25USDCHF LONG FORECAST Q2 W19 D6 Y25
Professional Risk Managers👋
Welcome back to another FRGNT chart update📈
Diving into some Forex setups using predominantly higher time frame order blocks alongside confirmation breaks of structure.
Let’s see what price action is telling us today!
💡Here are some trade confluences📝
✅Weekly order block rejection
✅Daily order block rejection
✅15’ order block
✅Intraday bullish breaks of structure
🔑 Remember, to participate in trading comes always with a degree of risk, therefore as professional risk managers it remains vital that we stick to our risk management plan as well as our trading strategies.
📈The rest, we leave to the balance of probabilities.
💡Fail to plan. Plan to fail.
🏆It has always been that simple.
❤️Good luck with your trading journey, I shall see you at the very top.
🎯Trade consistent, FRGNT X

USDCHF H4 I Bearish Fall from the 50% FIboBased on the H4 chart, the price is approaching our sell entry level at 0.8265, a pullback resistance that aligns with the 50% Fibo retracement.
Our take profit is set at 0.8195, an overlap support.
The stop loss is set at 0.8332, a swing high resistance.
High Risk Investment Warning
Trading Forex/CFDs on margin carries a high level of risk and may not be suitable for all investors. Leverage can work against you.
Stratos Markets Limited (tradu.com):
CFDs are complex instruments and come with a high risk of losing money rapidly due to leverage. 63% of retail investor accounts lose money when trading CFDs with this provider. You should consider whether you understand how CFDs work and whether you can afford to take the high risk of losing your money.
Stratos Europe Ltd (tradu.com):
CFDs are complex instruments and come with a high risk of losing money rapidly due to leverage. 63% of retail investor accounts lose money when trading CFDs with this provider. You should consider whether you understand how CFDs work and whether you can afford to take the high risk of losing your money.
Stratos Global LLC (tradu.com):
Losses can exceed deposits.
Please be advised that the information presented on TradingView is provided to Tradu (‘Company’, ‘we’) by a third-party provider (‘TFA Global Pte Ltd’). Please be reminded that you are solely responsible for the trading decisions on your account. There is a very high degree of risk involved in trading. Any information and/or content is intended entirely for research, educational and informational purposes only and does not constitute investment or consultation advice or investment strategy. The information is not tailored to the investment needs of any specific person and therefore does not involve a consideration of any of the investment objectives, financial situation or needs of any viewer that may receive it. Kindly also note that past performance is not a reliable indicator of future results. Actual results may differ materially from those anticipated in forward-looking or past performance statements. We assume no liability as to the accuracy or completeness of any of the information and/or content provided herein and the Company cannot be held responsible for any omission, mistake nor for any loss or damage including without limitation to any loss of profit which may arise from reliance on any information supplied by TFA Global Pte Ltd.
The speaker(s) is neither an employee, agent nor representative of Tradu and is therefore acting independently. The opinions given are their own, constitute general market commentary, and do not constitute the opinion or advice of Tradu or any form of personal or investment advice. Tradu neither endorses nor guarantees offerings of third-party speakers, nor is Tradu responsible for the content, veracity or opinions of third-party speakers, presenters or participants.

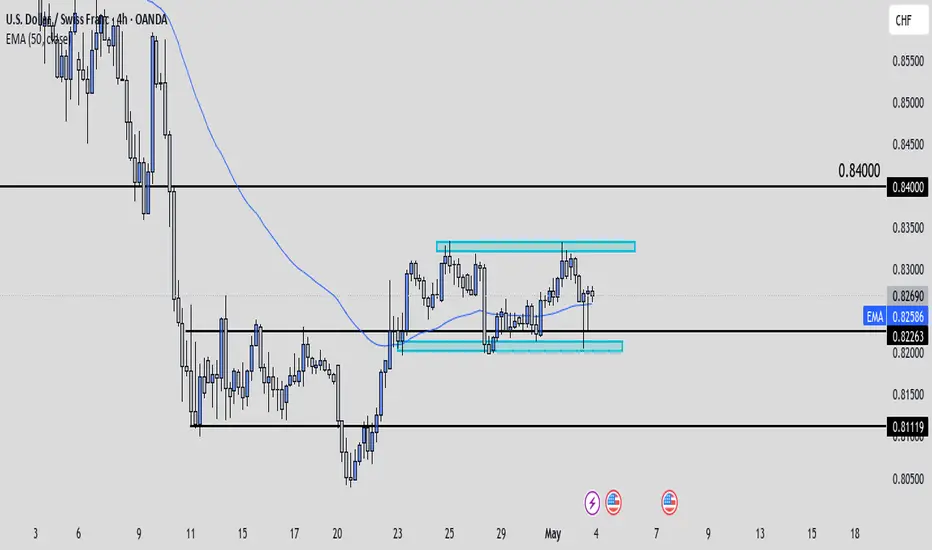
USDCHF Trade IdeaUSDCHF trades flat despite upbeat US jobs data.It hits an intraday low of 0.82189 and is currently trading around 0.82590. Intraday bias appears to be bullish as long as the support 0.8180 holds.
The U.S. April 2025 Non-Farm Payrolls (NFP), released on May 2, 2025, reported decelerating employment expansion with a rise of 177,000 jobs, lower than a revised 185,000 in the prior month, while the unemployment rate held steady at 4.2%. Significant job gains were seen in health care, transport and warehousing, financial activities, and social assistance, but federal government jobs fell. Median hourly earnings increased 0.3% from last month and 3.8% over the year, and the average workweek continued at 34.3 hours.
Technical Analysis Points to Further Upside
The pair is trading below the 34-EMA and 55-EMA on the 4-hour chart indicates a minor down trend. The immediate resistance is at 0.8280 any break above targets 0.8300/0.8350/0.8380/0.8500.
Support Levels and Potential Declines
On the downside, near-term support is around 0.8180, any violation below will drag the pair to 0.8135/0.8090/0.8000.
Indicators
CCI (50) - Bearish
Directional movement Index - Neutral
Trading Strategy Recommendation
It is good to buy on dips around 0.8230 with a stop-loss at 0.8180 for a TP of 0.8500.

05.05.25 Morning ForecastPairs on Watch -
FX:USDCHF
FX:AUDUSD
FX:AUDCAD
FOREXCOM:COFFEE
A short overview of the instruments I am looking at for today, multi-timeframe analysis down to what I will be looking at for an entry. Enjoy!

USDCHF | BullishUSDCHF is bouncing back after testing its trendline and support level.Now after forming morning star pattern its look good and bullish.

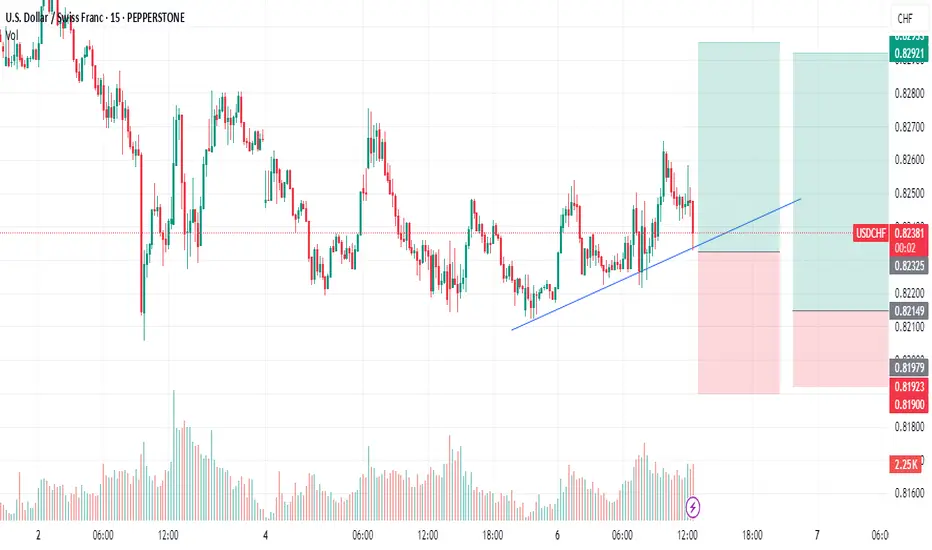
USD/CHF at Resistance Wall: Short Setup Poised for Drop!Timeframe: 15-Minute (M15)
Fast-paced short-term trade.
Supply Zone (Entry Area):
Price is rejecting from 0.82720 – 0.82840 resistance zone.
Bearish Signal:
Multiple rejections at red zone suggest sellers are active.
Stop Loss:
Placed slightly above resistance at 0.82846.
Target Zone:
Demand area near 0.82100 – 0.82120, marked as the take-profit zone.
Trend Confirmation:
Lower highs and resistance hold confirm bearish bias.
Risk-Reward Ratio:
Wide green zone vs tight stop — high reward-to-risk trade.

USDCHF H4 I Bullish Bounce Off Based on the H4 chart analysis, the price is falling toward our buy entry level at 0.8111, a pullback support that aligns with the 78.6% Fibonacci retracement.
Our take profit is set at 0.8236, a pullback resistance.
The stop loss is placed at 0.8037, a swing low support.
High Risk Investment Warning
Trading Forex/CFDs on margin carries a high level of risk and may not be suitable for all investors. Leverage can work against you.
Stratos Markets Limited (tradu.com):
CFDs are complex instruments and come with a high risk of losing money rapidly due to leverage. 63% of retail investor accounts lose money when trading CFDs with this provider. You should consider whether you understand how CFDs work and whether you can afford to take the high risk of losing your money.
Stratos Europe Ltd (tradu.com):
CFDs are complex instruments and come with a high risk of losing money rapidly due to leverage. 63% of retail investor accounts lose money when trading CFDs with this provider. You should consider whether you understand how CFDs work and whether you can afford to take the high risk of losing your money.
Stratos Global LLC (tradu.com):
Losses can exceed deposits.
Please be advised that the information presented on TradingView is provided to Tradu (‘Company’, ‘we’) by a third-party provider (‘TFA Global Pte Ltd’). Please be reminded that you are solely responsible for the trading decisions on your account. There is a very high degree of risk involved in trading. Any information and/or content is intended entirely for research, educational and informational purposes only and does not constitute investment or consultation advice or investment strategy. The information is not tailored to the investment needs of any specific person and therefore does not involve a consideration of any of the investment objectives, financial situation or needs of any viewer that may receive it. Kindly also note that past performance is not a reliable indicator of future results. Actual results may differ materially from those anticipated in forward-looking or past performance statements. We assume no liability as to the accuracy or completeness of any of the information and/or content provided herein and the Company cannot be held responsible for any omission, mistake nor for any loss or damage including without limitation to any loss of profit which may arise from reliance on any information supplied by TFA Global Pte Ltd.
The speaker(s) is neither an employee, agent nor representative of Tradu and is therefore acting independently. The opinions given are their own, constitute general market commentary, and do not constitute the opinion or advice of Tradu or any form of personal or investment advice. Tradu neither endorses nor guarantees offerings of third-party speakers, nor is Tradu responsible for the content, veracity or opinions of third-party speakers, presenters or participants.

UsdChf Trade IdeaUC at the moment is currently sitting below a major support level which I would need to see get tapped into to determine our direction for the week. Once price broke below we never got the retest to confirm if shorts were coming into play. We only had price break below and then range so there's no clear direction here for me. Price can either retest 84000 and confirm shorts or push back above with bullish structures to support buying opportunities.