CHFUSD trade ideas

USD/CHF NEXT MOVESell after bearish candle stick pattern, buy after bullish candle stick pattern....
Best bullish pattern , engulfing candle or green hammer
Best bearish pattern , engulfing candle or red shooting star
NOTE: IF YOU CAN'T SEE ANY OF TOP PATTERN IN THE ZONE DO NOT ENTER
Stop lost before pattern
R/R %1/%3
Trade in 5 Min Timeframe, use signals for scalping

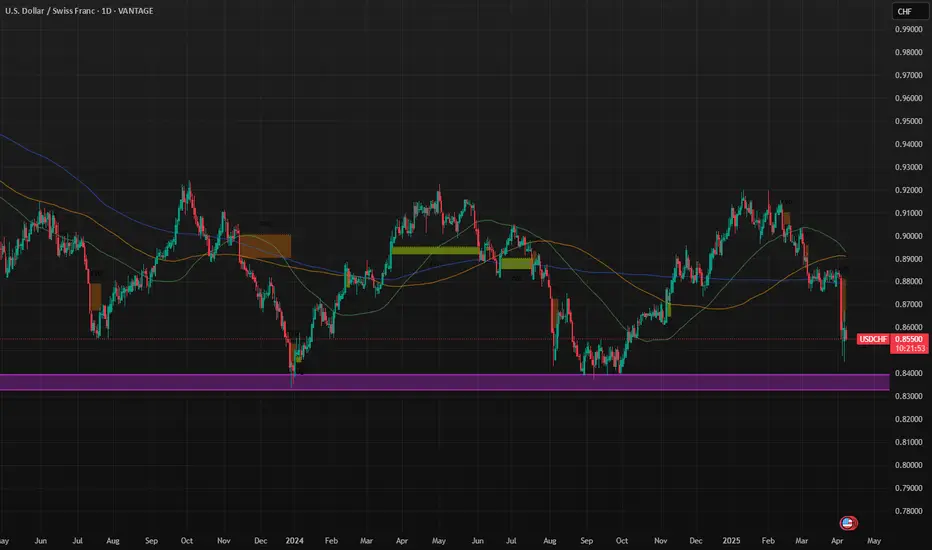
USDCHF PoV - Long POINT 0.82$!Currently, the USD/CHF pair is going through a bearish phase, influenced by several economic and geopolitical factors.
Influence of US Trade Tariffs: Recent trade tariffs imposed by the United States have strengthened the Swiss franc, creating pressure on Switzerland's export-oriented economy. This scenario could push the Swiss National Bank (SNB) to consider introducing negative interest rates to counter the appreciation of the currency and support the economy.
Monetary Policy of the SNB: In June 2024, the SNB reduced interest rates by 25 basis points, bringing them to 1.25%. Inflation forecasts were revised downward, indicating 1.3% for 2024 and 1.1% for 2025. These adjustments reflect economic challenges and the SNB's intent to avoid deflation.
Swiss Franc Forecast: Analysts from Bank of America have expressed doubts about the sustainability of the Swiss franc's weakness in 2025. Despite expectations of lower interest rates, the SNB may be reluctant to implement unconventional measures, given the limited effectiveness of such policies in the past.
Technical Analysis: The daily chart shows a range between a maximum of 0.82 and a minimum of 0.92, which has been respected for the past three years. Currently, the price is approaching the upper limit of the channel, suggesting a possible downward correction. However, a break above 0.92 could indicate an extension of the bullish movement.
Conclusion: The bearish trend of USD/CHF is influenced by both internal and external factors, including SNB policies, US trade tariffs, and market dynamics. Investors should closely monitor SNB decisions, international trade policies, and key economic indicators to assess potential developments in the USD/CHF exchange rate.
USDCHF LONG4H Main Structure is bearish, however, the price has failed to break and hold below the 0.85113 support. The 15M has switched bullish likely to facilitate the 4H pullback.

Usdchf Buyswell we can clearly see the liquidity sweep, and tht BOS is not yet clear , I'm awaiting a closure above then a minor retracement for the Buy to be confirmed

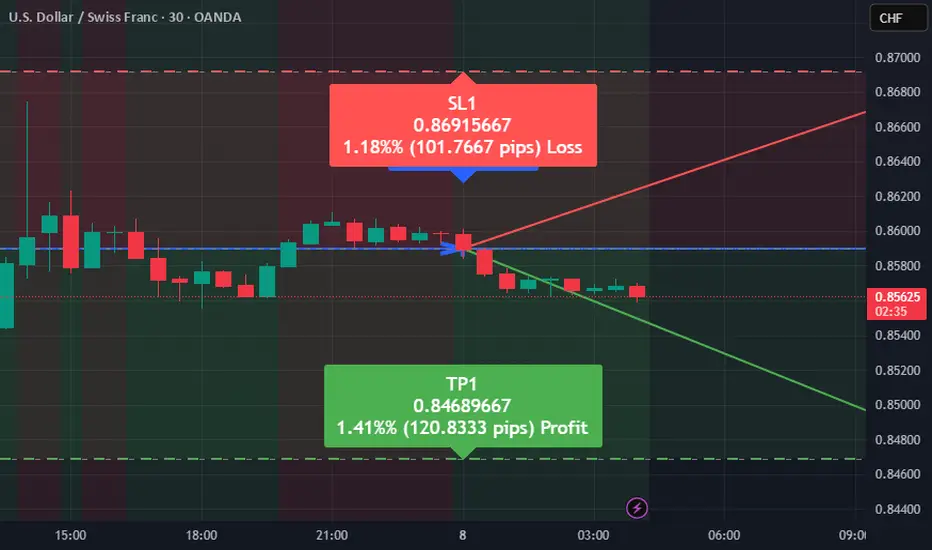
USDCHF Forecast: Bearish Outlook on Strong EASY Trading AI SignaUSDCHF has presented a clear selling opportunity according to the EASY Trading AI strategy. The pair currently trades around 0.85898, and our analysis indicates potential bearish momentum towards 0.84689667 levels. This projection relies on the AI-based model, capturing momentum shifts and technical sentiment patterns on USDCHF.Stop loss is recommended at 0.86915667 to maintain prudent risk management and safeguard against unexpected bullish reversals. The EASY Trading AI strategy evaluates market volatility, trend strength, and liquidity conditions, signaling robust confidence in the current bearish expectation.Stay disciplined and manage your trades wisely!
USD/CHF Trade Analysis: Potential Reversal & Bullish Setup🔻 Downtrend Phase: The price has been falling sharply, showing a strong bearish move before hitting support. 📉🔥
🟦 Support Zone (0.84458):
🔵 Key level where buyers may step in. If price holds, it could trigger a reversal. 🚀🔄
🟦 Resistance Zone (Mid-Level):
🟡 A minor barrier before price can continue higher. Expect some reaction here. ⚠️📊
🎯 Target Point (0.86190):
✅ Bullish target where price is expected to move if the support holds. 🎯💰📈
⚠️ Stop Loss (0.84458):
❌ If price breaks below this level, the trade setup is invalidated. 🚨🔻
📊 Trade Setup Summary:
✔️ Buy from support (if confirmed)
✔️ Stop Loss below 0.84458 ❌
✔️ Take Profit at 0.86190 🎯💵
🔥 Risk-Reward looks good! Watch for confirmation before entering! 🚀📊

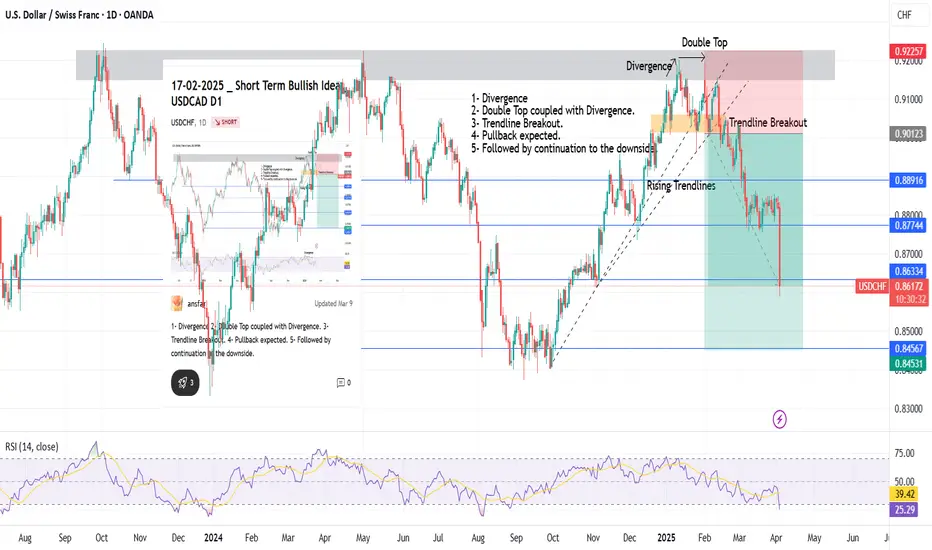
17-02-2025 _ Short Term Bullish Idea _ USDCHF D1- Updated 3-4-251- Divergence
2- Double Top coupled with Divergence.
3- Trendline Breakout.
4- Pullback expected.
5- Followed by continuation to the downside.
USDCHF: Bearish Forecast & Outlook
Our strategy, polished by years of trial and error has helped us identify what seems to be a great trading opportunity and we are here to share it with you as the time is ripe for us to sell USDCHF.
Disclosure: I am part of Trade Nation's Influencer program and receive a monthly fee for using their TradingView charts in my analysis.
❤️ Please, support our work with like & comment! ❤️

Buy the Dip or Wait to Flip? USDCHF Bulls Watching That GapWe look to buy around 0.8466, with eyes on a potential gap fill toward 0.8600 from April 4–6.
📉 Downside looks limited for now, so we’re positioning long early and letting price confirm.
As always, if price doesn’t hold this area, we’ll gladly stay out. But if it does—there’s clean upside potential.

USDCHF | 07.04.2025BUY 0.85200 | STOP 0.84500 | TAKE 0.86250 | We expect the price to consolidate near Friday's lows and go up above 0.86250 with further consolidation above it.

USD/CHF For Bullish as pull-back to target 3wait for pull-back near by entry point and then go long
current phase is pull-back
have fun :)

USDCHF INTRADAY bearish below 0.8650 resistance USD/CHF remains in a bearish trend, with recent price action confirming a break below the previous consolidation zone, reinforcing downside momentum.
Key Resistance Level: 0.8650 – former support now acting as resistance
Downside Targets:
0.8500 – near-term support
0.8435 and 0.8400 – medium to long-term bearish targets
An oversold bounce toward 0.8650 could offer a fresh opportunity for sellers if the price fails to reclaim that level. A bearish rejection there would support continuation to the listed support levels.
However, a confirmed breakout and daily close above 0.8650 would invalidate the bearish bias, shifting sentiment and opening the door for a move toward 0.8710, followed by 0.8760.
Conclusion
USD/CHF remains bearish below 0.8650. Watch for a rejection at this level to confirm further downside. A daily close above 0.8650 would turn the outlook bullish, targeting 0.8710 and higher.
This communication is for informational purposes only and should not be viewed as any form of recommendation as to a particular course of action or as investment advice. It is not intended as an offer or solicitation for the purchase or sale of any financial instrument or as an official confirmation of any transaction. Opinions, estimates and assumptions expressed herein are made as of the date of this communication and are subject to change without notice. This communication has been prepared based upon information, including market prices, data and other information, believed to be reliable; however, Trade Nation does not warrant its completeness or accuracy. All market prices and market data contained in or attached to this communication are indicative and subject to change without notice.

USD/CHF H1 | Rising into a swing-high resistanceUSD/CHF is rising towards a swing-high resistance and could potentially reverse off this level to drop lower.
Sell entry is at 0.8575 which is a swing-high resistance.
Stop loss is at 0.8640 which is a level that sits above the 127.2% Fibonacci extension level and a multi-swing-high resistance.
Take profit is at 0.8449 which is a swing-low support.
High Risk Investment Warning
Trading Forex/CFDs on margin carries a high level of risk and may not be suitable for all investors. Leverage can work against you.
Stratos Markets Limited (www.fxcm.com):
CFDs are complex instruments and come with a high risk of losing money rapidly due to leverage. 63% of retail investor accounts lose money when trading CFDs with this provider. You should consider whether you understand how CFDs work and whether you can afford to take the high risk of losing your money.
Stratos Europe Ltd (www.fxcm.com):
CFDs are complex instruments and come with a high risk of losing money rapidly due to leverage. 63% of retail investor accounts lose money when trading CFDs with this provider. You should consider whether you understand how CFDs work and whether you can afford to take the high risk of losing your money.
Stratos Trading Pty. Limited (www.fxcm.com):
Trading FX/CFDs carries significant risks. FXCM AU (AFSL 309763), please read the Financial Services Guide, Product Disclosure Statement, Target Market Determination and Terms of Business at www.fxcm.com
Stratos Global LLC (www.fxcm.com):
Losses can exceed deposits.
Please be advised that the information presented on TradingView is provided to FXCM (‘Company’, ‘we’) by a third-party provider (‘TFA Global Pte Ltd’). Please be reminded that you are solely responsible for the trading decisions on your account. There is a very high degree of risk involved in trading. Any information and/or content is intended entirely for research, educational and informational purposes only and does not constitute investment or consultation advice or investment strategy. The information is not tailored to the investment needs of any specific person and therefore does not involve a consideration of any of the investment objectives, financial situation or needs of any viewer that may receive it. Kindly also note that past performance is not a reliable indicator of future results. Actual results may differ materially from those anticipated in forward-looking or past performance statements. We assume no liability as to the accuracy or completeness of any of the information and/or content provided herein and the Company cannot be held responsible for any omission, mistake nor for any loss or damage including without limitation to any loss of profit which may arise from reliance on any information supplied by TFA Global Pte Ltd.
The speaker(s) is neither an employee, agent nor representative of FXCM and is therefore acting independently. The opinions given are their own, constitute general market commentary, and do not constitute the opinion or advice of FXCM or any form of personal or investment advice. FXCM neither endorses nor guarantees offerings of third-party speakers, nor is FXCM responsible for the content, veracity or opinions of third-party speakers, presenters or participants.

USD/CHF: Back at Support – Will Buyers Step In?Welcome back! Let me know your thoughts in the comments!
** USDCHF Analysis !
We recommend that you keep this pair on your watchlist and enter when the entry criteria of your strategy is met.
Please support this idea with a LIKE and COMMENT if you find it useful and Click "Follow" on our profile if you'd like these trade ideas delivered straight to your email in the future.
Thanks for your continued support! Welcome back! Let me know your thoughts in the comments!

USD/CHF Price Action Update – April 5, 2025📊 USD/CHF Price Action Update – April 5, 2025 🎯
🔹 Current Price: 0.85399
🔹 Timeframe: 30M
📌 Key Support Level (Demand Zone):
🟢 0.85110–0.85324 – First Support Zone (Liquidity Area / Demand Rejection Zone)
📌 Key Resistance Level (Target Area):
🔴 0.86177 – Major Resistance (Potential Upside Target)
📈 Bullish Scenario:
Price respected the demand zone between 0.85110–0.85324, showing signs of bullish rejection.
If momentum holds, the next upside target is 0.86177, as shown in the risk-reward setup.
📉 Bearish Scenario:
A break and close below 0.85110 would invalidate the demand zone.
Downside continuation could push price toward 0.84700 or lower.
⚡ Trading Tip:
✅ Enter long positions only after clear rejection or confirmation candle inside the demand zone.
✅ Monitor price closely as it approaches 0.86177 – partial profits can be taken there.
✅ Set stop loss below 0.85110 to maintain favorable risk-reward.
#USDCHF #ForexTrading #SmartMoneyConcepts #PriceAction #LiquidityZone #TechnicalAnalysis #DemandZone #RiskReward #SmartEntry #ForexSignals #BreakoutStrategy

USD/JPY Price Action Update – April 7, 2025📊 USD/JPY Price Action Update – April 7, 2025 🎯
🔹 Current Price: 147.276
🔹 Timeframe: 15M
📌 Key Support Levels (Demand Zones):
🟢 147.200–147.284 – First Support Zone (Liquidity Area)
📌 Key Resistance Levels (Fair Value Gaps - FVGs & Supply Zones):
🔴 147.647 – First Resistance (FVG)
🔴 149.133 – Major Resistance (Potential Target)
📈 Bullish Scenario:
If price respects the 147.200–147.284 demand zone, we could see a push toward 147.647.
A breakout above 147.647 could indicate further bullish momentum toward 149.133.
📉 Bearish Scenario:
If price fails to hold 147.200, a deeper retracement is likely.
Next downside target could be below 147.000, breaking market structure.
⚡ Trading Tip:
✅ Look for confirmations like bullish candlestick rejections before entering buys.
✅ Monitor reactions at FVG zones for potential reversal trades.
✅ Use proper risk management when trading breakout zones.
#USDJPY #ForexTrading #PriceAction #TechnicalAnalysis #SmartMoney #ForexSignals #JPY #ForexMarket #LiquidityZone #SmartMoneyConcepts #FVG #ScalpSetup #BreakoutStrategy #IntradayForex

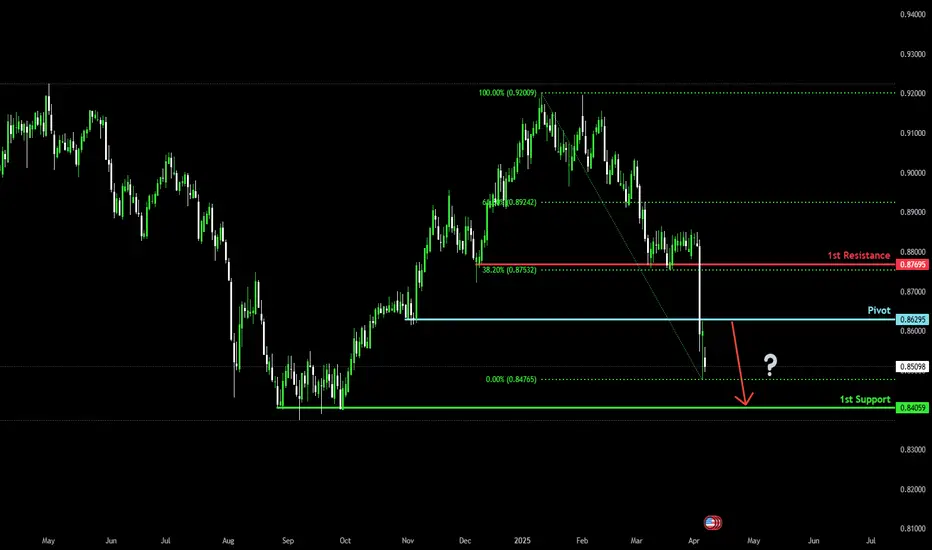
Bearish drop?The Swissie (USD/CHF) has reacted off the pivot which is a pullback resistance and could drop to the 1st support which has been identified as a pullback support.
Pivot: 0.8629
1st Support: 0.8405
1ast Resistance: 0.8769
Risk Warning:
Trading Forex and CFDs carries a high level of risk to your capital and you should only trade with money you can afford to lose. Trading Forex and CFDs may not be suitable for all investors, so please ensure that you fully understand the risks involved and seek independent advice if necessary.
Disclaimer:
The above opinions given constitute general market commentary, and do not constitute the opinion or advice of IC Markets or any form of personal or investment advice.
Any opinions, news, research, analyses, prices, other information, or links to third-party sites contained on this website are provided on an "as-is" basis, are intended only to be informative, is not an advice nor a recommendation, nor research, or a record of our trading prices, or an offer of, or solicitation for a transaction in any financial instrument and thus should not be treated as such. The information provided does not involve any specific investment objectives, financial situation and needs of any specific person who may receive it. Please be aware, that past performance is not a reliable indicator of future performance and/or results. Past Performance or Forward-looking scenarios based upon the reasonable beliefs of the third-party provider are not a guarantee of future performance. Actual results may differ materially from those anticipated in forward-looking or past performance statements. IC Markets makes no representation or warranty and assumes no liability as to the accuracy or completeness of the information provided, nor any loss arising from any investment based on a recommendation, forecast or any information supplied by any third-party.
USDCHF OUTLOOKHappy New Year!
Hope you had a good break during the holiday season. Let's go again this year!
The USD has been extremely bullish in the last few months of 2024 , with current economic climate and market seasonality, I will be expecting a bearish Dollar this year, I will update this idea with time.
Hence, this is my this current outlook on USDCHF.
"May fortune attend thee, and thy trade prosper." .......L2Earned

USDCHF - LongLooking for short term buys into an area of supply (Monthly iFVG) before joining the current daily trend - bearish

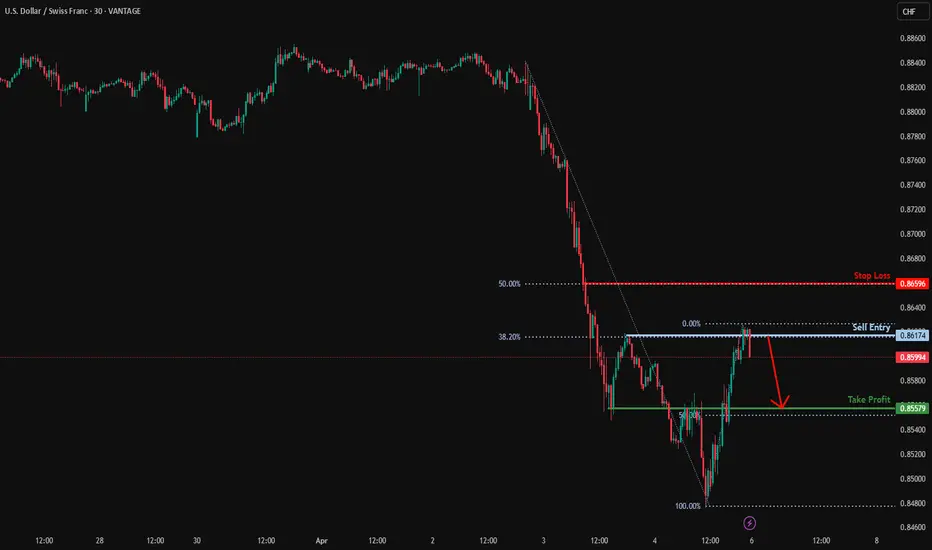
Bearish drop off pullback resistance?USD/CHF is reacting off the resistance level, which is a pullback resistance. A rejection from this level could indicate a double top pattern, potentially leading to a bearish drop.
Entry: 0.8617
Why we like it:
There is a pullback resistance level that line sup with the 38.2% Fibonacci retracement.
Stop loss: 0.8663
Why we like it:
There is a resistance level at the 50% Fibonacci retracement.
Take profit: 0.8557
Why we like it:
There is an overlap support level that line sup with the 50% Fibonacci retracement.
Enjoying your TradingView experience? Review us!
Please be advised that the information presented on TradingView is provided to Vantage (‘Vantage Global Limited’, ‘we’) by a third-party provider (‘Everest Fortune Group’). Please be reminded that you are solely responsible for the trading decisions on your account. There is a very high degree of risk involved in trading. Any information and/or content is intended entirely for research, educational and informational purposes only and does not constitute investment or consultation advice or investment strategy. The information is not tailored to the investment needs of any specific person and therefore does not involve a consideration of any of the investment objectives, financial situation or needs of any viewer that may receive it. Kindly also note that past performance is not a reliable indicator of future results. Actual results may differ materially from those anticipated in forward-looking or past performance statements. We assume no liability as to the accuracy or completeness of any of the information and/or content provided herein and the Company cannot be held responsible for any omission, mistake nor for any loss or damage including without limitation to any loss of profit which may arise from reliance on any information supplied by Everest Fortune Group.

USD/CHF Setup: Trendline Test with Major Upside Potential
USD/CHF is showing signs of bullish pressure as price approaches the key trendline resistance around 0.87000. Currently trading at 0.86075, a breakout above this resistance could open the doors for further upside.
🎯 Upside Targets:
TP1: 0.87700
TP2: 0.89200
🛡️ Key Support Levels:
0.85470
0.84100
A strong break and close above 0.87000 will confirm bullish continuation. Traders should watch closely for momentum and volume confirmation. The bulls are eyeing higher ground
