USDCHF: Consolidation ContinuesDuring our daily interaction class today, we observed that the 📉USDCHF pair is consolidating within a horizontal range on a 4-hour time frame.
After testing its resistance, there was a downward movement in the market which led to the breach of the neckline of a double top pattern, indicating a strong bearish signal for intraday trade.
As a result, I anticipate that the price could decline to the 0.8789 level in the near future.
CHFUSD trade ideas

USDCHF - MARKET STRUCTUREUSDCHF - MARKET STRUCTURE, learn to read price direction and how to make profit

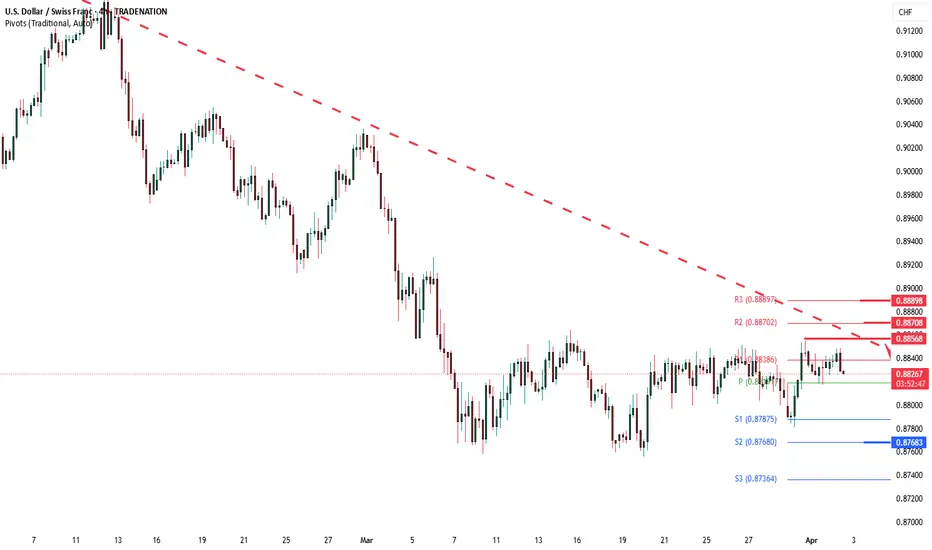
USDCHF falling resistance retest at 0.8856USDCHF maintains a bearish sentiment, aligned with the prevailing downtrend. The recent price action suggests an oversold bounce, which may be temporary before the downtrend resumes.
Key Level: 0.8856
This level represents the previous consolidation zone and serves as a crucial resistance point.
Bearish Scenario: If the price faces rejection at 0.8856, it could resume its decline, targeting 0.8790, followed by 0.8770 and 0.8736 over the longer term.
Bullish Scenario: A confirmed breakout above 0.8856 with a daily close beyond this level would invalidate the bearish outlook, opening the way for rallies toward 0.8870 and 0.8890.
Conclusion:
USDCHF remains bearish unless it breaks above 0.8856. Traders should monitor this key level for either rejection or confirmation to determine the next move.
This communication is for informational purposes only and should not be viewed as any form of recommendation as to a particular course of action or as investment advice. It is not intended as an offer or solicitation for the purchase or sale of any financial instrument or as an official confirmation of any transaction. Opinions, estimates and assumptions expressed herein are made as of the date of this communication and are subject to change without notice. This communication has been prepared based upon information, including market prices, data and other information, believed to be reliable; however, Trade Nation does not warrant its completeness or accuracy. All market prices and market data contained in or attached to this communication are indicative and subject to change without notice.
Trendline BreakThe price has broken a bearish trendline followed by a pullback and now looks to continue its bullish run
WE ONLY TRADE PULLBACKS

USDCHF 1H TimeFrame Sell ideaUSDCHF rejected from a high value zone , a sell position would be great with a proper stoploss

USDCHF OUTLOOKA SELL on USDCHF, this is more like a retracement from the overall trend following the ranging pattern on daily timeframe. We are looking for liquidity to be cleared out before we look into the upside.
USD/CHF taking bullish trade setup pre tariff plan announcementUSD/CHF bullish setup—dollar strengthening after a prolonged downtrend since trump's election. march consolidation broke, now targeting recovery. buying USD against CHF

USDCHF has formed a bottom patternOn the 4-hour chart, USDCHF has formed a bottom pattern. Currently, we can pay attention to the support around 0.8830. If it falls back and stabilizes, we can consider buying. Above, we can pay attention to the previous supply area of 0.8895-0.8925.

USDCHF 01/04/2025Weekly:
-Weekly lows.
-FVG acting as magnet.
Daily:
-Inverse H&S pattern.
4H:
-Breaker block.
-Bullish M pattern.
-IC.

Technicals on usdchfA trendline break
Metigated an orderflow, broke through a bearish trendline.
Bulls showing their strength

UC UpdateUSD/CHF is likely to trend slightly upward in the next few days, potentially testing the 0.9000 resistance level. However, the movement may be modest, and traders should remain cautious due to mixed signals across these analyses.

#005 USDCHF Moving Average 0308SGT 01042025Add : I pasted a screenshot of how price looks like on the 5 Minutes Time Frame at the current swing high.
Price is stabbing the Major Resistance area, so, I guess the market players are content with the current price, and also, volume is sloping downwards, which shows that actually the market is quiet so the price is ranging at the major resistance area.
Would price go in my favour or against me? There's no telling to be honest. All I could do is to manage my trades and what I tell myself in my head.
0318SGT 01042025
==
Shorting USDCHF as price retraces sharply back to the Major Resistance area as shown on the chart.
I am shorting because I think price is being manipulated right now, with the huge spike upwards to the resistance area, institutions are trying to sweep up the liquidity for USD, maybe to buy more stocks as the US stocks is down currently into its 6th week after Trumps win, I think.
I heard that TikTok US is going to be sold to a US firm. Not sure how true it is.
I held my breath for like 10 days or so in the last 10 days of March because I already made some profits in my Oanda mt4 account, and broke even on TradingView paper account.
I'll be taking this trade only for now as a set, and then I would be taking a break. I'll be going for stupid reservist next week. I feel so anxious but no choice.
---
I'll be pasting what I mentioned in Ideas section below.
---
I wanna sell here, but i wouldn't.
I would wait until 12 pm which is in 1 hour 7 minutes later.
I have other pairs on standby which has also touched the Major resistance and Major support already, but I am holding myself back because I promised myself that I would not trade in March anymore after getting +2.9R profit in March after 3 trades on Oanda mt4, and +0.004R profit on tradingview paper trade.
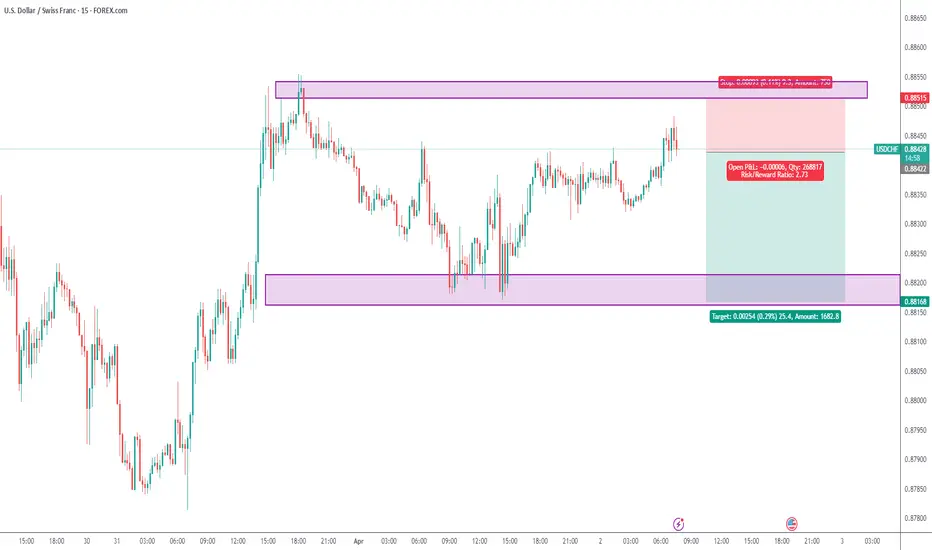
2255SGT 31032025
Just placed a Sell Limit at 0.88504, SL at 0.88737 going for 2R TP at 0.88039.
Some other pairs I am looking at has either gone without me or and in an unstable situation I am not comfortable with, so I am couldn't join them at my preferred price level, or am not going to join them.
CADCHF went without me at the support of the up channel.
EURAUD, USDSGD, GBPCAD, GBPAUD went without me, too bad.
0039SGT 01042025
Will be removing the Sell Limit if price continues without me.
Today is the first day of April so lets relax abit, even though I am actually raring to go.
I didn't get my dopamine from outside today(go do some delivery jobs) so my mental state isn't that stable, so, I better take some time and chill.
0040SGT 01042025
Will be updating the journal if I do enter the sell limit.
Also want to add, if you look at the 5 Minutes time frame, you would see price stabbing at the Major Resistance level, as the institutions are grabbing the liquidity for a push in either directions.
Power move has also been made as they create false demand for USD, coupled with today being Eid Mubarak or Hari Raya, so, the Muslims are not here with us to provide the additional liquidity. (Im from Singapore, and even though it's a chinese majority country, we celebrate Eid as a public holiday. So, there definitely is an impact there for USD, especially when the middle east is on holiday, too.)
0044SGT 01042025
---
Ok I'll be turning off my laptop after I post this in a minute.
0314SGT 01042025

Could the price bounce from here?USD/CHF is falling towards the support level, which is an overlap support that lines up with the 61.8% Fibonacci retracement and could bounce from this level to the upside.

USD/CHF Long Trade – Breakout from Descending TrendlineI have entered a long position on USD/CHF following a confirmed breakout and close above the descending trendline on the 4-hour timeframe. The breakout signals a potential shift in momentum, with price now reclaiming key levels.
*Entry:* 0.88290 (Breakout confirmation)
*Stop Loss:* 0.87812 (Below recent structure support)
*Risk Management Level:* 0.88075 (Adjusting SL if price moves favorably)
*Target Levels:*
TP1: 0.88576 - Moving SL to BE at this point to manage risk
TP2: 0.89082
TP3: 0.90329
TP4: 0.91448
*Trade Rationale:*
*The breakout above the descending trendline suggests a shift in market structure toward bullish momentum.*
*Risk is managed with a stop below recent lows, allowing room for volatility while protecting capital.*
*Targets are aligned with key resistance levels where price may react.*

USDCHF Breakup the channel support and rtesting it now BUYUSDCHF after logn time consolidation now has broken the Down trend channel resistance and is retesting it , you can eneter the long postion

USDCHF Long off key level First publication after a very long time.
Just seen this inverted head and shoulders pattern forming with a key level being heavily respected as a key level of support.
I have seen that the last candle form on the daily chart was a bullish engulfing candle which has shown massive bullish pressure again and I will use this as my signal candle
I have my stop loss at the signal candle low wick with my target at a 1:3 reward but I am open to riding this out depending on how this idea goes ahead.
Best of luck on the charts !!!

USDCHF The Target Is UP! BUY!
My dear friends,
Please, find my technical outlook for USDCHF below:
The price is coiling around a solid key level - 0.8806
Bias - Bullish
Technical Indicators: Pivot Points Low anticipates a potential price reversal.
Super trend shows a clear buy, giving a perfect indicators' convergence.
Goal - 0.8825
About Used Indicators:
The pivot point itself is simply the average of the high, low and closing prices from the previous trading day.
Disclosure: I am part of Trade Nation's Influencer program and receive a monthly fee for using their TradingView charts in my analysis.
———————————
WISH YOU ALL LUCK

USD_CHF SHORT SIGNAL|
✅USD_CHF is going up now
But a strong resistance level is ahead at 0.8860
Thus I am expecting a pullback
Which means we can enter a
Short trade with the TP of 0.8835
And the SL of 0.8866 but its is a
Risky setup so we recommend to use
A small lot size
SHORT🔥
✅Like and subscribe to never miss a new idea!✅
Disclosure: I am part of Trade Nation's Influencer program and receive a monthly fee for using their TradingView charts in my analysis.

USDCHF SHORT Market structure bearish DH
Entry at Weekly and Daily AOi
Weekly Rejection at AOi
Daily Rejection at AOi
Previous Structure point Daily
Around Psychological Level 0.88500
H4 EMA retest
H4 Candlestick rejection
Levels 3.74
Entry 90%
REMEMBER : Trading is a Game Of Probability
: Manage Your Risk
: Be Patient
: Every Moment Is Unique
: Rinse, Wash, Repeat!
: Christ is King.

USD/CHF For Bullishwait for pull-back near by entry point and the go long
general trend is down trend
current phase is pull-back
have fun :)

USDCHF BUY BIASWe have a buy bias on this pair we have seen liquidity taken and we expect further push the upside with more opportunities to scale up this pair.

USDCHF INTRADAY sideways consolidation continuesThe USD/CHF price action exhibits bearish sentiment, supported by the prevailing downtrend. The current intraday swing high at 0.8860 serves as a critical trading level, as the pair shows potential for an oversold rally before facing bearish rejection.
Key Levels to Watch:
Key Resistance: 0.8860 (current intraday swing high)
Immediate Support: 0.8760
Lower Support Levels: 0.8720, 0.8680
Upside Resistance Levels: 0.8913, 0.8970
Bearish Scenario:
An oversold rally toward the 0.8860 level, followed by a bearish rejection, could validate the downtrend and target the immediate support at 0.8760. Continued bearish momentum could extend the decline to 0.8720 and ultimately 0.8680 over the longer timeframe.
Bullish Scenario:
A confirmed breakout above the 0.8860 resistance level, accompanied by a daily close above this mark, would negate the bearish outlook. This scenario could trigger further rallies toward the next resistance levels at 0.8913 and 0.8970.
Conclusion:
The prevailing sentiment remains bearish amid the ongoing downtrend. Traders should closely monitor the 0.8860 level for potential bearish rejections or a bullish breakout. A sustained close above this resistance could signal a shift toward bullish momentum, while failure to break above would reinforce the bearish outlook.
This communication is for informational purposes only and should not be viewed as any form of recommendation as to a particular course of action or as investment advice. It is not intended as an offer or solicitation for the purchase or sale of any financial instrument or as an official confirmation of any transaction. Opinions, estimates and assumptions expressed herein are made as of the date of this communication and are subject to change without notice. This communication has been prepared based upon information, including market prices, data and other information, believed to be reliable; however, Trade Nation does not warrant its completeness or accuracy. All market prices and market data contained in or attached to this communication are indicative and subject to change without notice.

USDCHF : Order BlockIn the USDCHF order block, the US DOLLAR index may want to complete the inverse head and shoulders formation, from here a small decline may come.This is not investment advice.
