FX Wars Episode 6 - The return of the USDA simple idea, which I will gradually fill with life:
The USD returns and with it the claim to its FX throne.
Act 1:
📊🔮🇺🇲 US retail sales, which will be published today at 14:30, will be higher than consensus expectations.
🟡-> the US consumer is alive and well and will continue to keep the US economy afloat.
Further acts will follow ✅️
CHFUSD trade ideas
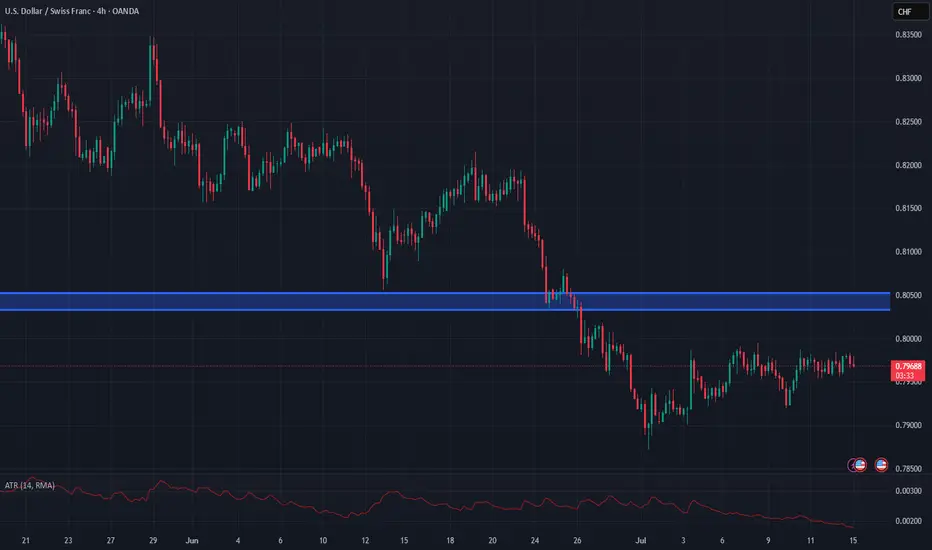
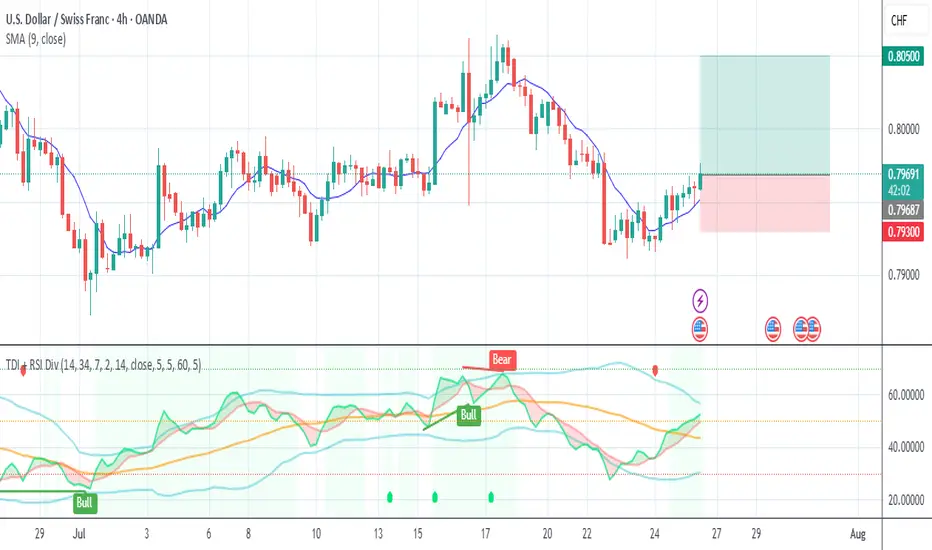
USDCHF downtrend capped by resistance at 0.8045The USD/CHF pair is currently trading with a bearish bias, aligned with the broader downward trend. Recent price action shows a retest of the falling resistance, suggesting a temporary relief rally within the downtrend.
Key resistance is located at 0.8045, a prior consolidation zone. This level will be critical in determining the next directional move.
A bearish rejection from 0.8045 could confirm the resumption of the downtrend, targeting the next support levels at 0.7900, followed by 0.7860 and 0.7810 over a longer timeframe.
Conversely, a decisive breakout and daily close above 0.8045 would invalidate the current bearish setup, shifting sentiment to bullish and potentially triggering a move towards 0.8080, then 0.8140.
Conclusion:
The short-term outlook remains bearish unless the pair breaks and holds above 0.8045. Traders should watch for price action signals around this key level to confirm direction. A rejection favours fresh downside continuation, while a breakout signals a potential trend reversal or deeper correction.
This communication is for informational purposes only and should not be viewed as any form of recommendation as to a particular course of action or as investment advice. It is not intended as an offer or solicitation for the purchase or sale of any financial instrument or as an official confirmation of any transaction. Opinions, estimates and assumptions expressed herein are made as of the date of this communication and are subject to change without notice. This communication has been prepared based upon information, including market prices, data and other information, believed to be reliable; however, Trade Nation does not warrant its completeness or accuracy. All market prices and market data contained in or attached to this communication are indicative and subject to change without notice.

USDCHF TRADE IDEA Just like on GBPCHF, we seem to be pulling back to our Fibonacci level for a continuation move to the downside on USDCHF.
Let's see what the market does and how it unfolds.
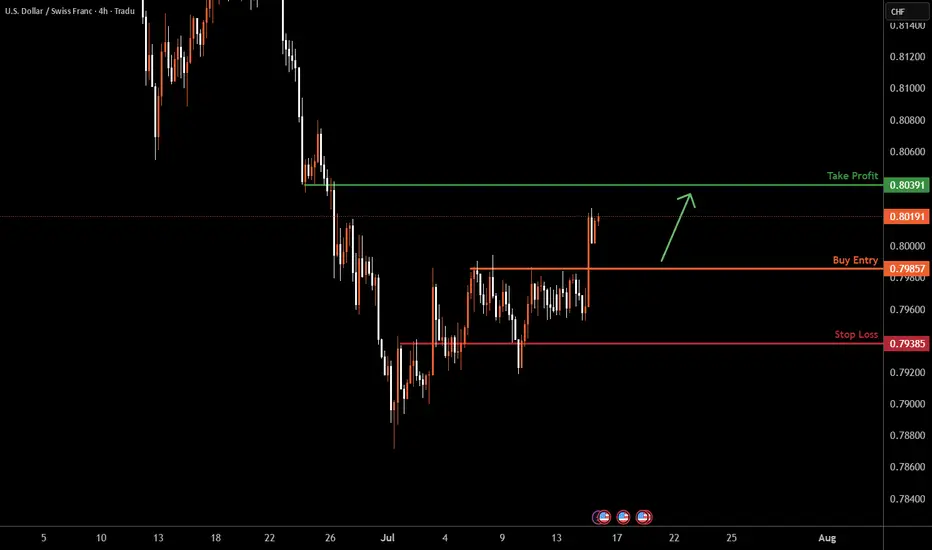
USDCHF H4 I Bullish Bounce Off Based on the H4 chart analysis, we can see that the price could fall toward our buy entry at 0.7985 which is a pullback support.
Our take profit will be at 0.8039, which is a pullback resistance level.
The stop loss will be placed at 0.7938, which is a pullback support level.
High Risk Investment Warning
Trading Forex/CFDs on margin carries a high level of risk and may not be suitable for all investors. Leverage can work against you.
Stratos Markets Limited (tradu.com ):
CFDs are complex instruments and come with a high risk of losing money rapidly due to leverage. 63% of retail investor accounts lose money when trading CFDs with this provider. You should consider whether you understand how CFDs work and whether you can afford to take the high risk of losing your money.
Stratos Europe Ltd (tradu.com ):
CFDs are complex instruments and come with a high risk of losing money rapidly due to leverage. 63% of retail investor accounts lose money when trading CFDs with this provider. You should consider whether you understand how CFDs work and whether you can afford to take the high risk of losing your money.
Stratos Global LLC (tradu.com ):
Losses can exceed deposits.
Please be advised that the information presented on TradingView is provided to Tradu (‘Company’, ‘we’) by a third-party provider (‘TFA Global Pte Ltd’). Please be reminded that you are solely responsible for the trading decisions on your account. There is a very high degree of risk involved in trading. Any information and/or content is intended entirely for research, educational and informational purposes only and does not constitute investment or consultation advice or investment strategy. The information is not tailored to the investment needs of any specific person and therefore does not involve a consideration of any of the investment objectives, financial situation or needs of any viewer that may receive it. Kindly also note that past performance is not a reliable indicator of future results. Actual results may differ materially from those anticipated in forward-looking or past performance statements. We assume no liability as to the accuracy or completeness of any of the information and/or content provided herein and the Company cannot be held responsible for any omission, mistake nor for any loss or damage including without limitation to any loss of profit which may arise from reliance on any information supplied by TFA Global Pte Ltd.
The speaker(s) is neither an employee, agent nor representative of Tradu and is therefore acting independently. The opinions given are their own, constitute general market commentary, and do not constitute the opinion or advice of Tradu or any form of personal or investment advice. Tradu neither endorses nor guarantees offerings of third-party speakers, nor is Tradu responsible for the content, veracity or opinions of third-party speakers, presenters or participants.
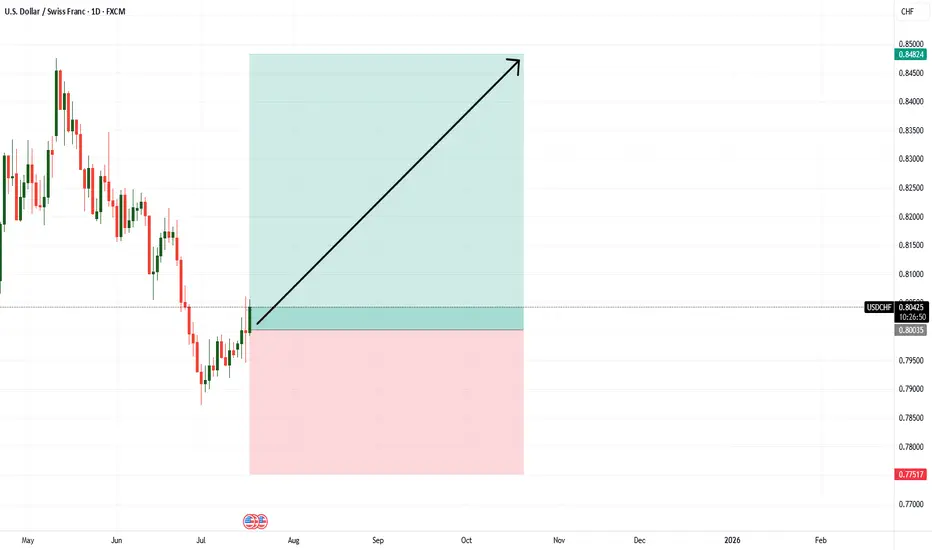
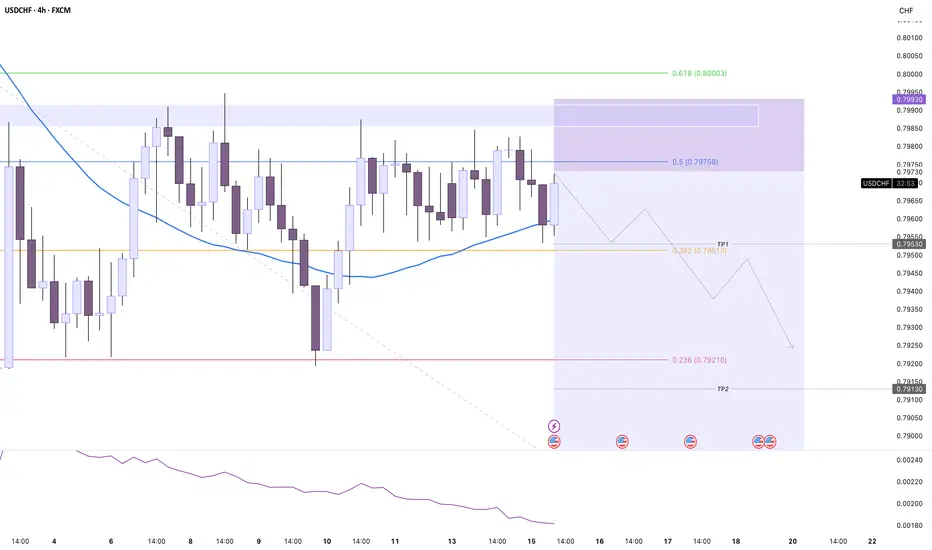
USDCHF is due for reboundThe USDCHF is showing some interesting signs that a rebound could be on the horizon. Looking at the weekly chart, it's clear that the pair has been under considerable selling pressure—it's not only dipped below the 20-period and 60-period EMAs, but it's also trading in territory that historically marks previous turning points. When USDCHF reaches these oversold levels, there's often a technical bounce as sellers run out of steam and bargain-hunters step in.
Another point worth highlighting is the Fibonacci retracement. The technicals suggest a key rebound target around the 0.8535 level, which aligns with the 50% retracement from the last major swing down. This area isn't just a mathematical target—it also coincides with previous congestion and resistance zones, making it a logical place for bulls to aim for. So, with prices oversold, historical patterns favoring a longer rebound, and a clear technical target overhead, the pieces are falling into place for a USDCHF recovery heading into the autumn months.

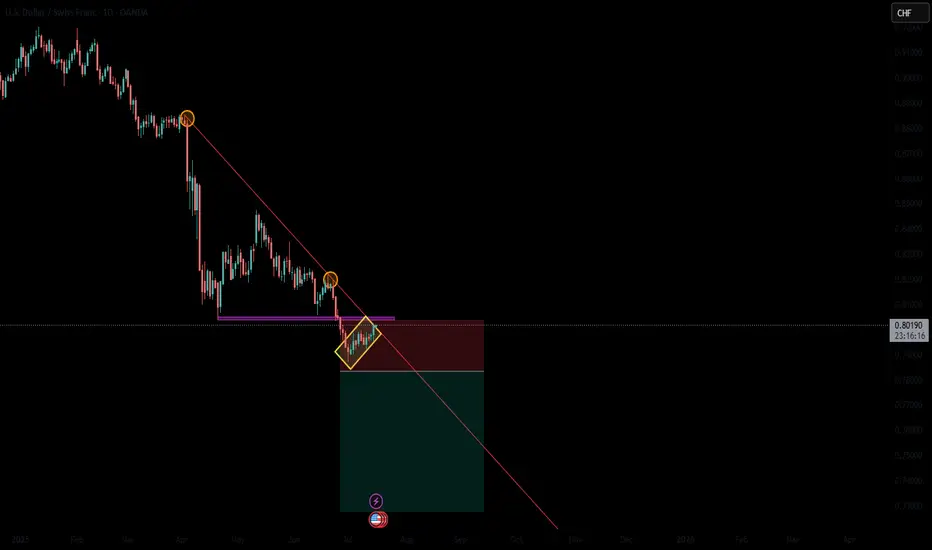
long-term bearish trendUSD/CHF is in a strong long-term bearish trend, and the recent move up is likely a temporary correction, not a reversal. Price is currently testing the 0.7980–0.8000 resistance zone, which aligns with the upper boundary of a descending channel and could attract sellers. Unless the pair breaks and holds above 0.8050–0.8100, the bearish trend remains intact. A rejection in this area or a break below 0.7870 would confirm continuation to lower targets like 0.7790 and 0.7710. In short, it's a good setup to consider a sell, but wait for clear bearish confirmation.
USDCHF Wave Analysis – 15 July 2025
- USDCHF reversed from support zone
- Likely to rise to resistance level 0.8055
USDCHF currency pair recently reversed from the support zone lying at the intersection of the support level 0.7900, lower daily Bollinger Band and the support trendline of the daily down channel from May.
The upward reversal from support zone started the active short-term ABC correction ii.
Given the strongly bullish US dollar sentiment seen today, USDCHF currency pair can be expected to rise to the next resistance level 0.8055 (former strong support from April and June).

USD CHF shortA possible scenario for USD/CHF with a good risk-to-reward ratio could be a viable setup.

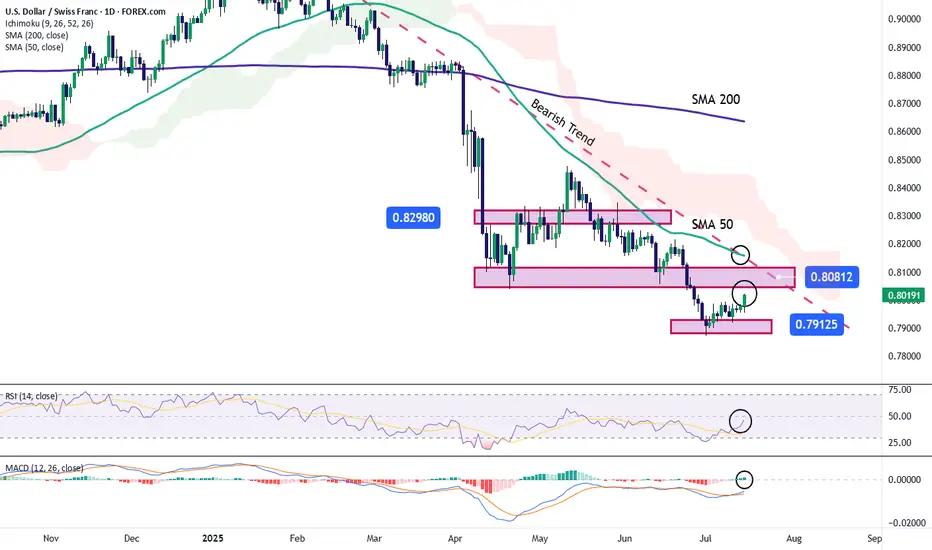
USD/CHF: The Swiss Franc Continues to WeakenOver the past four trading sessions, the USD/CHF pair has appreciated by nearly 0.5%, as a new bullish bias has begun to consolidate on the daily chart. For now, buying pressure remains steady, supported by the recovery of the U.S. dollar, which started gaining strength shortly after it was revealed that the year-over-year CPI in the U.S. came in at 2.7%, above the 2.6% expected. This outcome may lead the Federal Reserve to adopt a more hawkish tone, and if elevated interest rates persist, it’s likely that demand for the dollar will continue to strengthen in the short term.
Downtrend Still in Place
The recent bearish movements have kept the pair within a steady downward trend in the short term. However, a relevant bullish correction is now emerging, and if it continues, it could put the current bearish structure at risk. As price continues to test resistance levels, buying pressure may become increasingly relevant.
Technical Indicators:
RSI: The RSI line is showing clear bullish behavior, with a sustained upward slope in the short term. It is currently approaching the neutral 50 level, and a breakout above that could signal bullish momentum dominance, reinforcing the current upward pressure.
MACD: The MACD histogram shows consistent bullish momentum, remaining above the neutral zero line. This suggests that moving average strength remains in bullish territory, and if the histogram continues to move away from the neutral axis, it could confirm stronger buying pressure in the short term.
Key Levels to Watch:
0.80812 – Immediate Resistance: This level aligns with the main descending trendline on the chart. Sustained movement above this zone could invalidate the current bearish structure and open the door to a more dominant bullish bias.
0.82980 – Distant Resistance: A zone that coincides with previous highs. If price consistently reaches this level, it could trigger the formation of a new bullish structure in the coming weeks.
0.79125 – Key Support: This level marks the recent weekly lows. A break below this zone could revive bearish momentum and potentially initiate a broader downward trend in the short term.
Written by Julian Pineda, CFA – Market Analyst
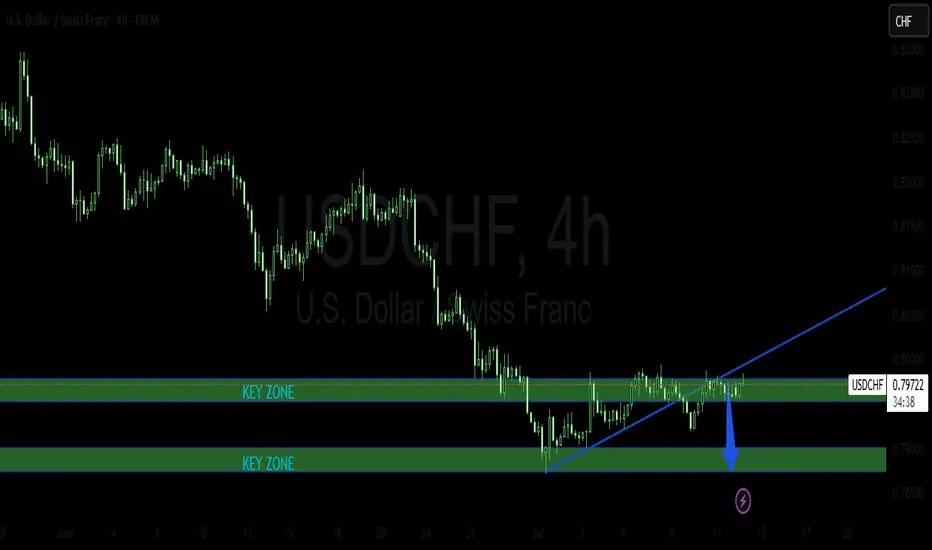
7.15 USD/CHF WATCH FOR A PULLBACKThis market has a VERY strong S/R zone, certainly worth keeping an eye on for the pullback and the other indicators to line up with it.........4 Hour chart is what I use for the setup then I go down to the 1 Hour chart for the entry. We will wait and see if this develops into something for us.

All I see, is sell The 4-hour candlestick has decisively broken below the 50 MA, confirming bearish momentum. Moves like this typically trigger strong selling pressure. Combined with the overall bearish market structure and a key Fibonacci resistance level sitting neatly within our stop-loss zone, this setup offers an excellent risk-to-reward trade opportunity.

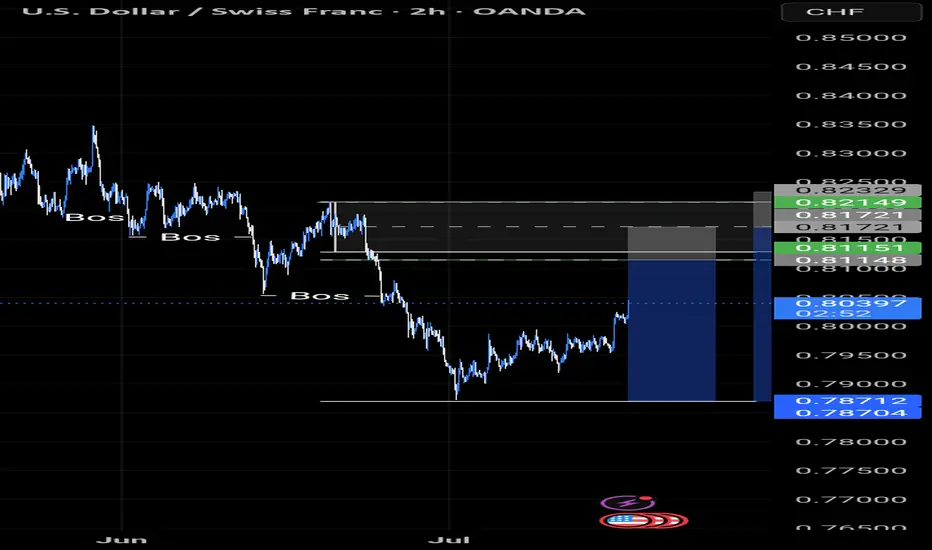
USD weakness has potential shorts on USDCHFUSD continues to show overall weakness ahead of CPI figures later today
Retests of the breakdown area on USDCHF at 0.8033-0.8048 can act as resistance on any retests
Stops should be above 0.8058
Targets can be back towards 0.7990
USDCHF H1 I Bullish Bounce Off the 50%Based on the H1 chart analysis, we can see that the price is falling toward our buy entry at 0.7951, which is a pullback support that aligns with the 50% Fib retracement.
Our take profit will be at 0.7986, which is a multi-swing high resistance level.
The stop loss will be placed at 0.7920, a swing low support.
High Risk Investment Warning
Trading Forex/CFDs on margin carries a high level of risk and may not be suitable for all investors. Leverage can work against you.
Stratos Markets Limited (tradu.com ):
CFDs are complex instruments and come with a high risk of losing money rapidly due to leverage. 63% of retail investor accounts lose money when trading CFDs with this provider. You should consider whether you understand how CFDs work and whether you can afford to take the high risk of losing your money.
Stratos Europe Ltd (tradu.com ):
CFDs are complex instruments and come with a high risk of losing money rapidly due to leverage. 63% of retail investor accounts lose money when trading CFDs with this provider. You should consider whether you understand how CFDs work and whether you can afford to take the high risk of losing your money.
Stratos Global LLC (tradu.com ):
Losses can exceed deposits.
Please be advised that the information presented on TradingView is provided to Tradu (‘Company’, ‘we’) by a third-party provider (‘TFA Global Pte Ltd’). Please be reminded that you are solely responsible for the trading decisions on your account. There is a very high degree of risk involved in trading. Any information and/or content is intended entirely for research, educational and informational purposes only and does not constitute investment or consultation advice or investment strategy. The information is not tailored to the investment needs of any specific person and therefore does not involve a consideration of any of the investment objectives, financial situation or needs of any viewer that may receive it. Kindly also note that past performance is not a reliable indicator of future results. Actual results may differ materially from those anticipated in forward-looking or past performance statements. We assume no liability as to the accuracy or completeness of any of the information and/or content provided herein and the Company cannot be held responsible for any omission, mistake nor for any loss or damage including without limitation to any loss of profit which may arise from reliance on any information supplied by TFA Global Pte Ltd.
The speaker(s) is neither an employee, agent nor representative of Tradu and is therefore acting independently. The opinions given are their own, constitute general market commentary, and do not constitute the opinion or advice of Tradu or any form of personal or investment advice. Tradu neither endorses nor guarantees offerings of third-party speakers, nor is Tradu responsible for the content, veracity or opinions of third-party speakers, presenters or participants.

Sell USDCHFShort scalp on USDCHF. Trading what I see now, and I see a head and shoulder pattern. Let's risk and see how it goes.

USDCHF SHORT TRADE PLANThe pair is trading in a bearish trend. It started a correction move after reaching a strong key zone and from this area the price may start the bearish rally again.
Please do your own analysis before placing any trades.
Cheers and Happy Trading !!!!
USDCHF | DOWNTREND CONTINUATIONUSDCHF seems to be in bearish continuation since it has not exhibited bullish divergence on RSI.

usd chf bullish ideapossible scenario for usd chf we did miss the entry but we can wait for it to pull back or left the trade overall its a good setup

usdchf buy tradeThe Relative Strength Index (RSI) is showing an upward trend, indicating increasing momentum. Additionally, the Moving Average Convergence Divergence (MACD) is showing a bullish crossover, further supporting the potential for an upward move
USDCHF - ReversalDouble Bottom Reversal Pattern with Bullish Divergence. Buyers look in strong position

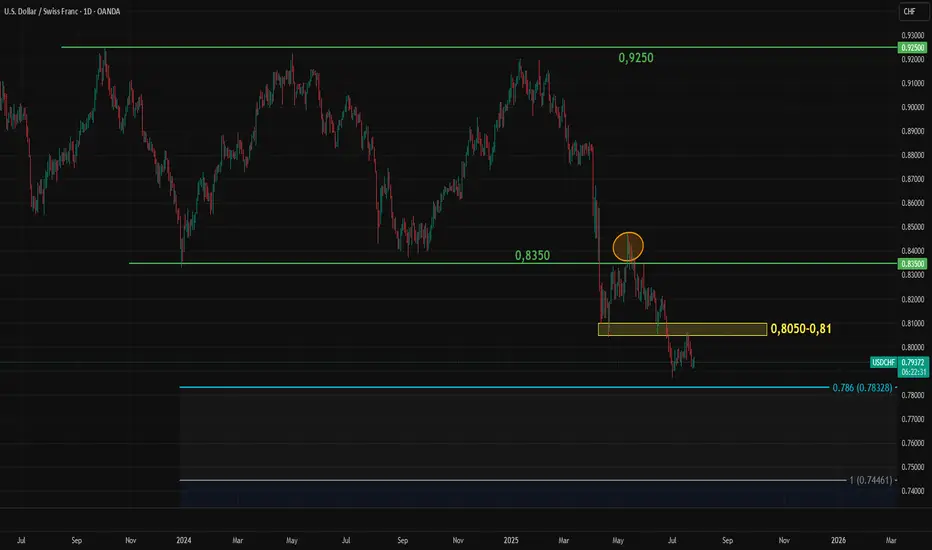
Key Levels to Watch for USDCHFAfter losing the key 0.8350 level, USDCHF attempted a re-entry but failed to hold above it. The pair is now under renewed pressure, with the price falling below 0.80.
The Swiss franc remains strong against most currencies due to solid fundamentals. USDCHF's next possible targets are 0.7830 and 0.7460, both based on Fibonacci expansion levels.
For CHF bears, the key zone to watch is between 0.8050 and 0.8100. A recovery into this zone could serve as an early signal of potential upward movement in USDCHF. However, the critical level remains at 0.8350.
Buy usdchfStrong buy expected from this level
Month still oversold pair
Almost ready to fly for bullish correction

USDCHFI do believe price will trade higher before trending lower,it doesnt hurt to be involved in this short term run.
