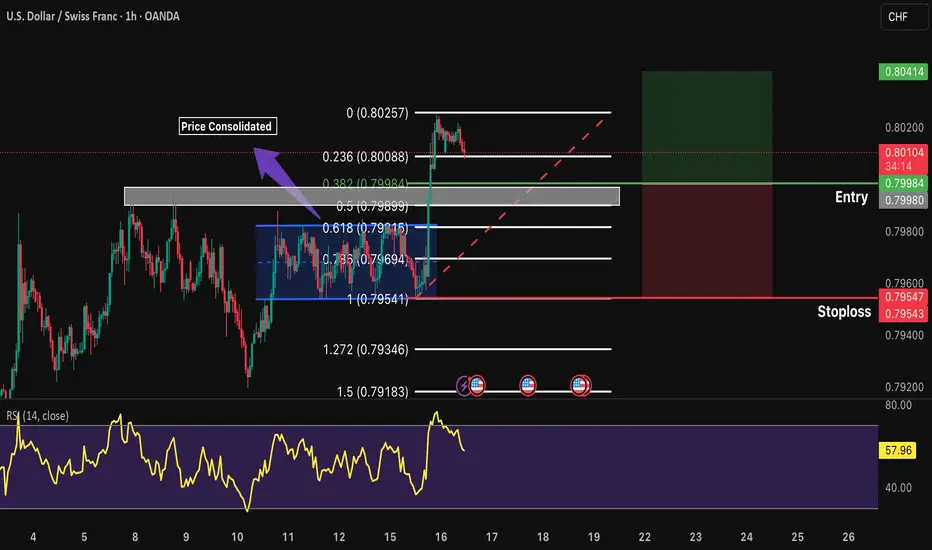
USDCHF 1H Long *Price Broke after consolidation.
*Waiting for price to retrace at point 0.382.
RR: 1:1
CHFUSD trade ideas
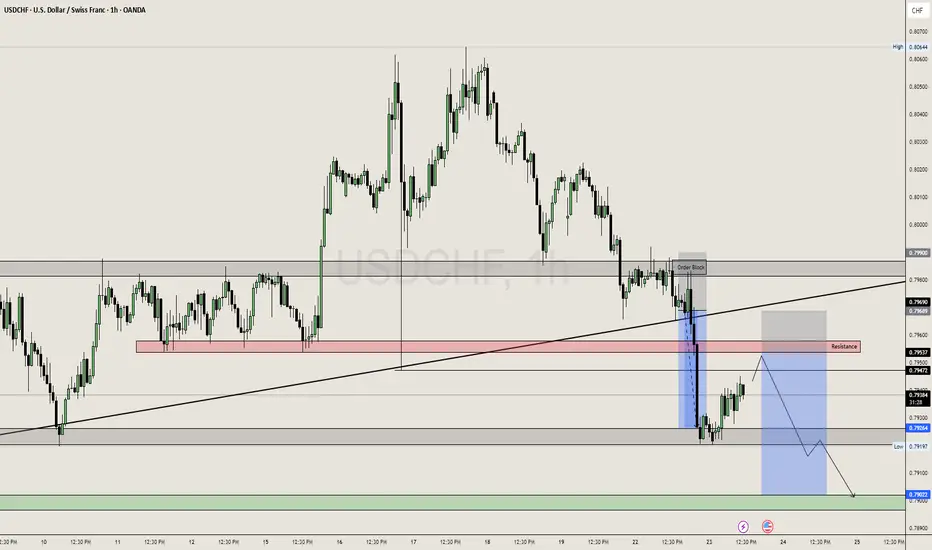
USDCHF, we can again expect a continue move downside.Yesterday USDCHF saw a waterfall movement after the DXY Losing Strength. We can also now expect a continue movement towards major support zone. We can plan our trade from the 1st Resistance Zone with 1:3 RRR.
Looking good are for sell side movement from 0.79550.
SL : 0.79700
TP : 0.79000
We can expect move in US Session. Sentiments are also towards downside as Majority if Retails are Long in this with Less Volume and More Positions.
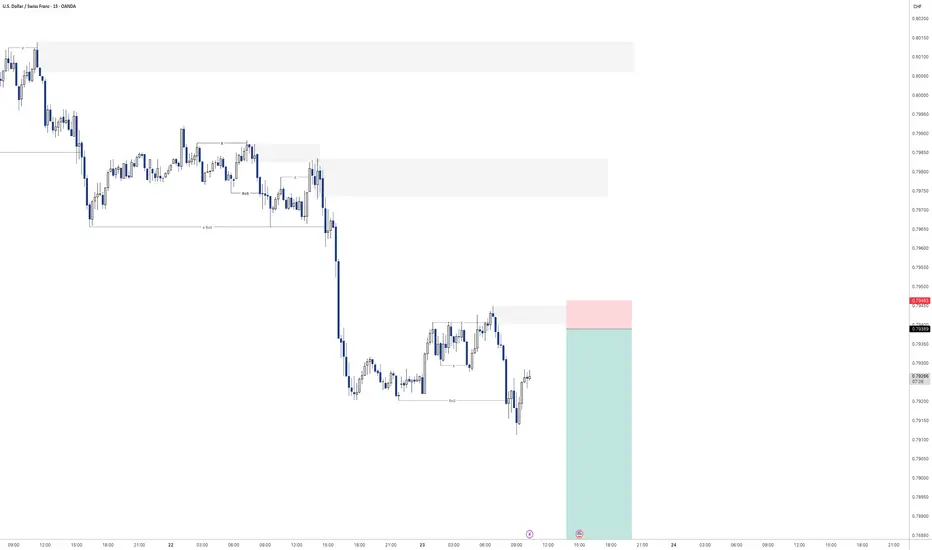
USDCHF - Sell off continuation?Looking for continuation of the selling pressure here on USDCHF
Will see how we play out for the rest of the day
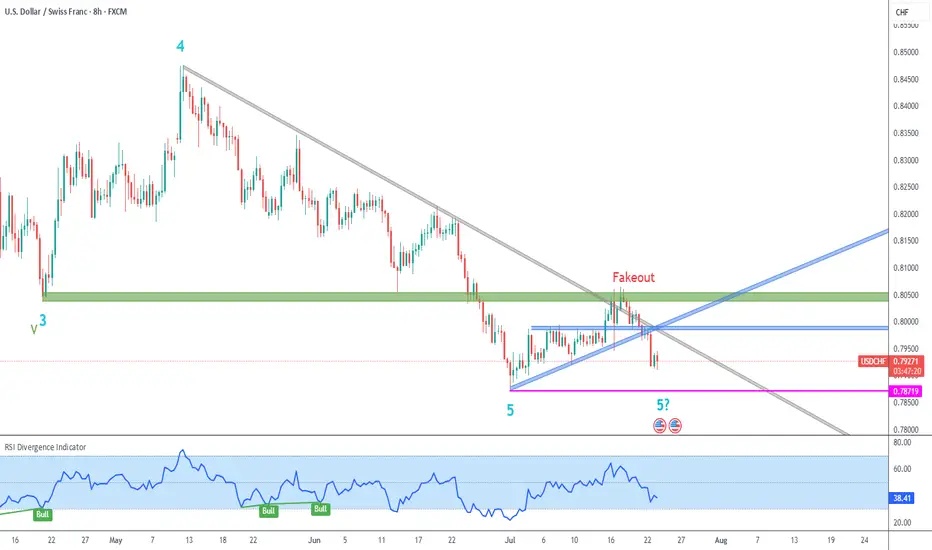
USDCHF 8H Chart Downtrend➡️ Price attempted a breakout from longer term gray descending trendline, but was held by strong green resistance, so it became a fakeout.
➡️ Price also broke down from minor blue resistance and ascending trendlines.
➡️ I had labeled the early July low as blue wave 5, but that is up for discussion, due to the lack of bullish follow-up and RSI divergence. We could still see another lower low (5?).
➡️ Current bias is definitely bearish, since there are no indications that the downtrend has finished.
Is USDCHF Ready to Drop? Short Setup Explained📉 USDCHF Trade Idea Breakdown
Taking a close look at USDCHF, we’re currently in a clear downtrend 🔻. Price is under pressure on the higher timeframes, but on the lower timeframes (15m & 30m), we’re seeing a pullback 🌀.
What I’m watching for now is a rejection at resistance 🔄 followed by a bearish break in market structure ⛔️. If that confirms, I’ll be looking to take a short entry with targets set at the two previous lows marked out in the video 🎯📉.
Stop loss placement would be just above the recent swing high for risk management 🛑.
As always — this is not financial advice ⚠️.

USD CHF longcan happen yet still its against the daily trend but as i said till you have good lines and risk to reward ration you don't have to worry ...
Please note: This is for educational purposes only and not a trading signal. These ideas are shared purely for back testing and to exchange views. The goal is to inspire ideas and encourage discussion. If you notice anything wrong, feel free to share your thoughts. In the end, to learn is to share !

USDCHF Is Bearish! Sell!
Take a look at our analysis for USDCHF.
Time Frame: 6h
Current Trend: Bearish
Sentiment: Overbought (based on 7-period RSI)
Forecast: Bearish
The market is approaching a key horizontal level 0.791.
Considering the today's price action, probabilities will be high to see a movement to 0.787.
P.S
Please, note that an oversold/overbought condition can last for a long time, and therefore being oversold/overbought doesn't mean a price rally will come soon, or at all.
Disclosure: I am part of Trade Nation's Influencer program and receive a monthly fee for using their TradingView charts in my analysis.
Like and subscribe and comment my ideas if you enjoy them!

USDCHF Inverse flag pattern breakdown watch idea📊USDCHF Forecast – 30M Timeframe
USDCHF forming a classic inverse flag pattern – signaling potential continuation to the downside
📍 Sell Zone Identified:
Price reacting from 0.79200, respecting pattern structure
Watching for continuation down toward the pole range target at 0.78100
🧠 Structure is clean — pattern confirmation aligning with bearish sentiment
Letting the market play out while managing risk carefully
What’s your take on USDCHF? Drop your ideas below
👍 Like | 🔔 Follow | 💭 Comment for more quality setups
#usdchf

USD/CHF PROBABLY !Waiting for confirmation on candles and Real Volume 5min or 15min (power of Real Volume)-without real volume I am like a blind man in a dense forest :)
Tools:
- real volume (proper interpretation)
- Fibonacci expansion ABC (an additional, new goal every day)
- Fibonacci retracement (combined with the real volume, it shows me the real probable movement for the next hours and days)
- volume support and resistance levels (confirmation of the price recovery level)
- oversold/overbought index (focusing on 1H and 4H something is already overvalued or undervalued)
- candlestick patterns (my entry point for 5 minutes or 15 minutes candlestick formations confirmed by particularly increasing volume).

Long term play USD/CHFLets see how this plays out. I'm no expert but where we're currently at are showing extreme signs of bullishness. On top of that we should see some economics changes this year that will strengthen the dollar.

USDCHF FORECAST It has been quite so long now we are back again with a new energy and momentum, and probably I have changed the way that I look the market. With this USDCHF I'm actually waiting to see price coming into those potential zones and see if I get any potential to enter the market. Let's see how the market is going to develop. Remember patience is Key.

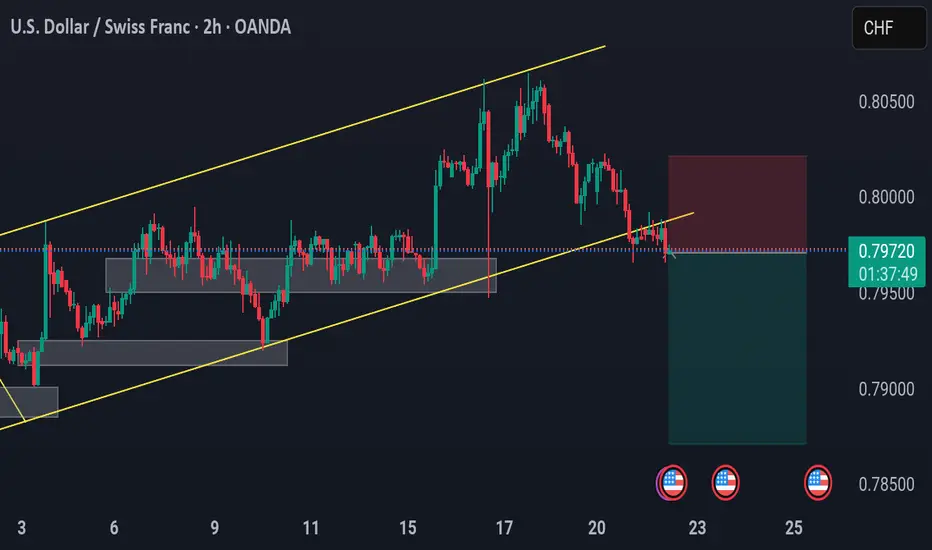
USD/CHF – Channel Breakdown & Bearish Rejection SetupUSD/CHF – Channel Breakdown & Bearish Rejection Setup
🔹 2H Chart by PULSETRADESFX
USD/CHF has broken below its ascending channel structure after multiple rejections at key resistance. Price is now retesting the underside of the broken trendline, presenting a clean break–retest–drop setup.
Sellers stepped in just below 0.80000, and momentum now leans bearish toward the next key demand around 0.79000.
📌 Trade Setup:
Entry: 0.79714
SL: 0.80050 (Above trendline)
TP: 0.78750 (Previous demand zone)
This setup is ideal for short-term continuation traders looking to ride the bearish momentum as structure breaks align with market reaction.
---
✅ Confluence Checklist:
Ascending channel break
Bearish retest confirmation
Supply zone reaction near 0.80000
Risk-to-reward > 2:1
Clean structure and price action
📅 July 22, 2025
📊 OANDA Feed | USD/CHF (2H)
#USDCHF #ForexTrading #BearishBreakdown #SupplyZone #PriceAction #TechnicalSetup #TradingView #PULSETRADESFX
USD CHF shortdont think that it can hit for today since the target is a bit far yet i think we can have better entery , but these days mondays tend to hold the trend when there is no major news lets see
Please note: This is for educational purposes only and not a trading signal. These ideas are shared purely for back testing and to exchange views. The goal is to inspire ideas and encourage discussion. If you notice anything wrong, feel free to share your thoughts. In the end, to learn is to share !

Selling USDCHFHello traders Hope you are having a wonderful week!!
Clear downtrend!!
We can say about 4 touch trendline but technically its 3.
You can see it!!

USDCHF Next moveUSDCHF is still in a downtrend , it even failed to break above 0.80700 zone which was the major resistance zone this are just a few potential signs that we might see it failing down

USD-CHF Bearish Wedge! Sell!
Hello,Traders!
USD-CHF is trading in a
Downtrend and has formed
A bearish wedge pattern
So IF we see a breakout
Then we a further bearish
Continuation will be expected
Sell!
Comment and subscribe to help us grow!
Check out other forecasts below too!
Disclosure: I am part of Trade Nation's Influencer program and receive a monthly fee for using their TradingView charts in my analysis.

Short USDCHFMain trend has been bearish and we currently testing the upper bound. If it holds a sell will be valid and we ride the wave

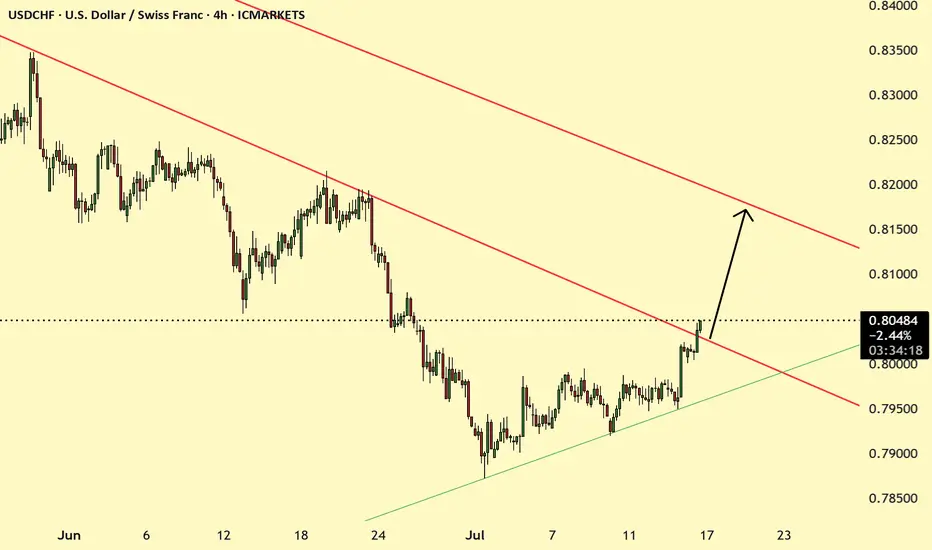
7.16 WATCH USD/CHF 4H CHARTThis one came onto the radar yesterday, we want to see a pullback into the strong S/R zone, then see ALL of the indicators line up...(engulfing candle, volume, momentum, 50 EMA) to tell us this market is ready to go up. Keep watching for now.

USDCHF break of Resistance USDCHF has recently brokend the resistance trendline is likely to go up. After the yesterday news the bullish movement of USD will continue
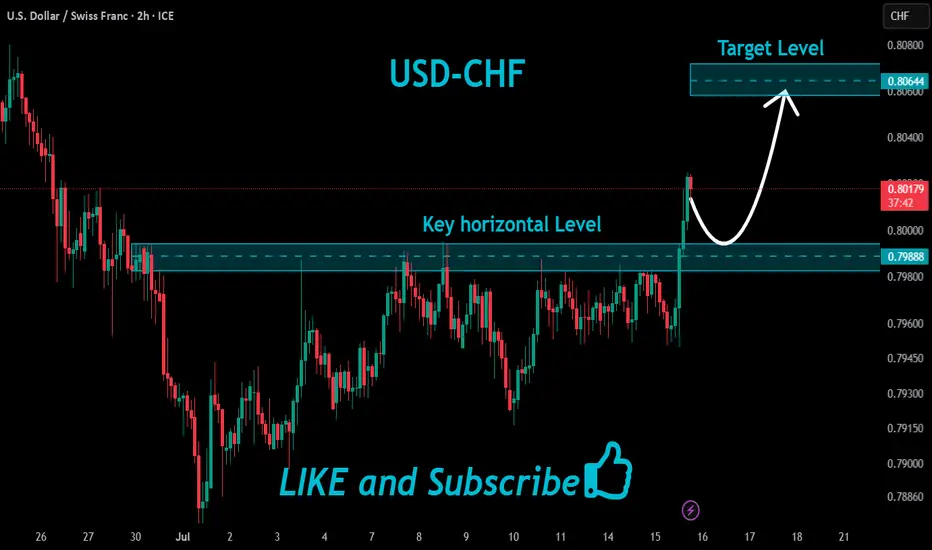
USDCHF Local Long!
HI,Traders !
#USDCHF made a bullish
Breakout of the key horizontal
Level of 0.79888 which is now a
Support and the pair is going down
To retest the level from where
We will be expecting a
Further bullish move up !
Comment and subscribe to help us grow !
USDCHF: Impulse Candle: Buy ideaOn USDCHF as you can see on the chart we would have a hight probability to have an uptrend because we have an impulse candle breakout with force the vwap and the resistance line.

USDCHFOne key factor in my trading style is adapting to market structure, primarily guided by the daily time frame. However, when I analyze lower time frames, I often spot potential shifts to the upside—that's the immediate trend I focus on. While I’m fully aware that overall momentum remains bearish, I understand that for the market to move downward, it first needs liquidity. That’s why I target zones where buyers get trapped.
The difference between me and most buyers is that I know exactly where to exit before the overall trend takes control. From now on, I’ve learned that I’m rarely wrong about the market’s direction—just wrong about my stop loss placement. It’s clear they hunt stop losses, so my strategy now is using minimal risk with wider stop losses.

posible scenario for usd chf we have jobless clame news coming out so we may not trade this but its a good looking setup
