$CHILLGUYUSDT – Second Chance Before the Breakout?Getting a second chance to enter $CHILLGUYUSDT.
Price is still basing out and holding key levels—looking constructive.
I’m adding here and will continue to do so as long as this structure holds.
The path remains tilted to the upside for now.
15 cents still firmly on the horizon.
CHILLGUYUSDT trade ideas

$CHILLGUY Bounce Ahead? +33% Potential$CHILLGUY just bounced off the support in its rising wedge on the 4H chart.
If the trend holds, we could see a 33% move toward the $0.08938 zone.
But if it breaks below, the setup’s off, so watch closely and manage risk.
DYOR, NFA

CHILLGUY Rebound Zone, Targets in Sight!#chillguy
Price is still holding above the key trendline and support zone. Buyers have stepped in again from this level, and the chart shows a potential bounce setup.
If this area holds, CHILLGUY could continue upward.
Entry Zone: Around $0.066–$0.068
Stop Loss: Below $0.062
Targets:
Target 1: $0.072
Target 2: $0.075
Target 3: $0.080
Target 4: $0.086
DYOR, NFA
#Altseason2025

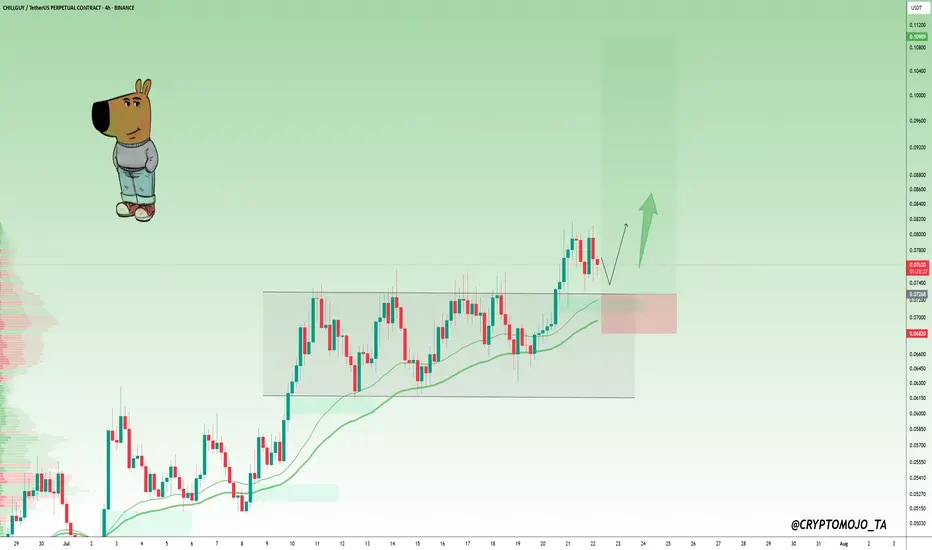
#CHILLGUY Retest in Motion, $0.11 Next?#CHILLGUY Breakout Retest in Progress
CHILLGUY has broken out of its recent sideways range and is now pulling back for a possible retest.
The previous resistance zone around $0.072–$0.073 is now acting as support.
As long as the price stays above this level, the setup remains bullish. A successful retest here could send the price toward the $0.11 zone.
For now, it’s a healthy retest with potential for the next leg up.
#CHILLGUY LONG!#CHILLGUY
Price is respecting a strong trendline support while also holding above the support zone. Buyers have stepped in near this level multiple times.
If the trendline holds, this could be the next bounce area for continuation.
Entry Zone: Around $0.072–$0.074
Stop Loss: Below $0.066
Targets:
Target 1: $0.078
Target 2: $0.084
Target 3: $0.092
Target 4: $0.099
DYOR NFA

CHILLGUY / USDT : Trend shift and Retest confirmedChillGuy/USDT - Trend Shift & Retest
ChillGuy/USDT has fully shifted its trend, and after a successful retest, we expect a strong pump towards $0.10 - $0.12 soon.
Bullish Scenario:
Successful retest confirms the trend shift, leading to a potential move towards $0.10 - $0.12.
Pro Tip:
Keep a close watch for any signs of weakness or reversal before entering.
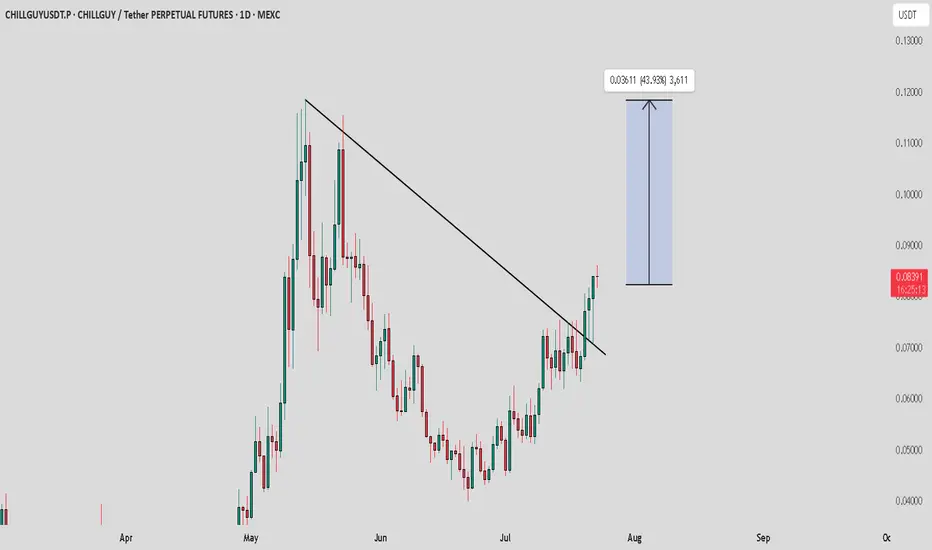
$CHILLGUY breakout done!$CHILLGUY has initiated a validated breakout from a multi-month symmetrical triangle consolidation on the 1D timeframe — accompanied by increasing volume, confirming structural expansion. 📈📊
📐 Target projections (Fibonacci & measured move-based):
• Short-term: $0.10
• Mid-term: $0.18215 (0.236), $0.28346 (0.382), $0.36534 (0.5)
• Long-term: $0.56380 (0.786), $0.71230 (1.0), potential extension to $1.00 ⚙️📏
This breakout suggests a potential +486% move from current structure — price is transitioning from compression to expansion. Risk:reward remains asymmetric.

CHILLGUY – Ideal Entry After Retrace - 2x incoming!Best time to enter on $CHILLGUY—been waiting for a retrace, and we finally got it.
Anything near $0.055 is a solid buy if you missed the green zone entries.
The 3D chart is already signaling strong demand, and both downtrend signals from the local top have expired.
Expecting this one to trend faster than $BERT.
Targeting the Yearly Open for now—about a 2x from current levels. Will reassess after that.

$CHILLGUY Breakout Confirmed, Retest in Progress!#CHILLGUY just broke out after weeks of accumulation.
The price was stuck in a tight range for nearly a month, forming a clear symmetrical triangle just under major resistance. After multiple tests, bulls finally pushed through both the trendline and horizontal resistance around $0.054–$0.056.
This breakout is backed by strong volume and structure. The breakout zone is now being retested, which could act as a new support before the next leg up.
Key Breakout Level: $0.056
Target Zone: $0.072 – $0.078
Invalidation: Close back inside the old range below $0.054
If the retest holds, we may be looking at a 40%+ upside move from here.
DYOR, NFA
#Chillguy

CHILLGUY trading Idea🟢 Bullish Signs
📝 Coin $CHILLGUY
✅ Entry Points: At the current price of 0.05742, consolidation is within the range of 0.04879 - 0.0396
🔴 Stop Loss is at 0.02665
💹 Potential Targets: The first target is 0.1188, and if the currency enters with an impulse wave, the target will be 0.17648, reaching 0.26494.
📊 The profit-to-loss ratio is 9:1
📝 This idea was built on Elliott Wave analysis, especially after the rebound from 0.01780 and the support range between 0.04879 and 0.03960. This is an indication that a wave 4 has been formed, especially if the price action remains above 0.02665, Wave 1 Peak
❤️ Good luck to everyone - don't enter any currency before studying your risk tolerance.

$Chillguy Cup and Handle (Bullish)Hi i hope everyone is profitting in this market, today i wanted to bring up the cup and handdle spotted on chillguy with major upside that could go as high as ATH's if not higher but before you dive into what a cup and handle is on chillguy give me a like and follow if you found this content of value so others can more easily see it as well hping they gain knwledge of this as well.
Reistance
$0.11 key level for massive breakout
$0.20
The cup and handle pattern is a bullish continuation pattern used in technical analysis to identify potential buying opportunities in trading. Below is a concise explanation of the pattern and how to trade it:
**What is the Cup and Handle Pattern?**
- **Shape**: The pattern resembles a "U" shape (the cup) followed by a smaller consolidation or pullback (the handle).
- **Cup**: Represents a period of price decline followed by a recovery to near the previous high, forming a rounded bottom.
- **Handle**: A short-term consolidation or slight pullback, often sloping downward, signaling a pause before a breakout.
- **Timeframe**: Can form over weeks to months on daily or weekly charts.
**Key Characteristics**
1. **Prior Uptrend**: The pattern typically forms after a significant price increase.
2. **Cup Depth**: The cup's lowest point is usually 20-50% below the prior high, though deeper cups can occur in volatile markets.
3. **Handle Formation**: The handle should slope downward and last shorter than the cup (e.g., 1-4 weeks). It often retraces 10-33% of the cup's height.
4. **Volume**: Volume typically decreases during the cup formation and handle, with a spike during the breakout.
**How to Trade the Cup and Handle**
1. **Identify the Pattern**:
- Confirm the cup's "U" shape with a rounded bottom (not a sharp "V").
- Ensure the handle forms a tight consolidation, ideally sloping downward.
- Check for a prior uptrend to confirm the bullish continuation context.
2. **Entry Point**:
- Enter a long position when the price breaks above the handle’s resistance (the high of the cup).
- Confirm the breakout with increased volume to reduce false signals.
3. **Stop-Loss**:
- Place a stop-loss below the handle’s low or the cup’s low, depending on risk tolerance (typically 5-10% below the entry).
4. **Price Target**:
- Measure the cup’s depth (from the high to the low) and add it to the breakout point.
- Example: If the cup’s high is $100, the low is $70, and the breakout is at $100, the target is $100 + ($100 - $70) = $130.
5. **Volume Confirmation**:
- Look for a volume surge during the breakout to validate the move.
- Weak volume may indicate a false breakout.
### **Risk Management**
- **Risk-Reward Ratio**: Aim for a minimum 2:1 ratio (e.g., risk $1 to gain $2).
- **Position Sizing**: Risk no more than 1-2% of your account per trade.
- **False Breakouts**: Be cautious of breakouts without volume or in choppy markets.
**Tips for Success**
- **Timeframes**: The pattern is more reliable on longer timeframes (daily or weekly charts).
- **Market Context**: Ensure the broader market trend supports the bullish pattern.
- **Combine Indicators**: Use tools like moving averages, RSI, or MACD to confirm momentum and avoid overbought conditions.
- **Practice**: Backtest the pattern on historical data or use a demo account to refine your strategy.
**Example**
- Stock XYZ rises from $50 to $100 (uptrend), forms a cup dropping to $70 and recovering to $100, then consolidates in a handle between $95-$100.
- Breakout occurs above $100 on high volume. Enter at $101, set a stop-loss at $94 (handle low), and target $130 (cup depth of $30 added to $100).

CHILLGUY Breaking Out — Rotating Gains Into Next Meme Runner🎯 Trading Plan:
Watch for a sweep into the red box and LTF reclaim for spot entry
Targets: $0.117 (yearly high), then $0.129–$0.158 if strong momentum
Manual invalidation: 1D close below red box
🚨 Risk Warning:
No spot entry unless sweep/reclaim at supply zone
Exit if 1D candle closes below supply zone

CHILLGUY/USDT 150%showing strong signs of reversal as volume begins to pick up. Recently broke above the previous swing high, signaling potential continuation. Now targeting the liquidity zone above, where further upside pressure may trigger a breakout rally.
Entry: On current breakout confirmation+ DCA green box
Target: Above key liquidity zone

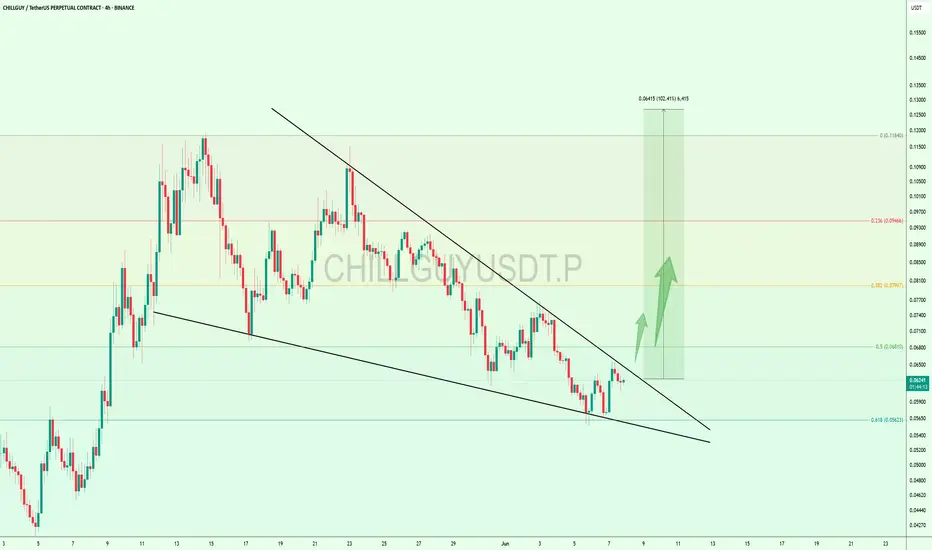
Big Move Loading? #CHILLGUY Testing Key Resistance#chillguy is moving inside this falling wedge pattern.
Right now, it’s testing the upper trendline.
If price breaks out of this wedge, we can expect a strong move up!
For now, just watch the breakout closely.
If it confirms, the next leg can be big. 👀
DYOR, NFA
CHILL GUY PERPETUAL TRADE , Sold From $0.06250CHILL GUY PERPETUAL TRADE
CHILL GUY SETUP
Currently $0.06250
Sold From $0.06250
(Trading plan If CHILL GUY go up to $0.067
will add more shorts)
Expecting target $0.06040 OR DOWN
In the event of an early exit,
this analysis will be updated.
Its not a Financial advice

CHILLGUY Tight Range Play – Patience Could PayCHILLGUY/USDT Analysis – 6H Chart
CHILLGUY is currently consolidating above a strong demand zone and key support line. Price is squeezing into a tight range, showing signs of buildup after the recent uptrend.
As long as the support holds, a bounce toward the mid S/R levels looks likely. A strong breakout from this zone could fuel the next leg higher.
But if price loses the demand zone, it may trigger a deeper correction.
Stay alert — a decisive move is nearing.

$CHILLGUY is holding strong!$CHILLGUY is holding strong!
Price is respecting the ascending trendline and gearing up for a breakout.
A move above that top resistance could open the gates to $0.13
Entry zone: $0.086–$0.088
Stop-loss: $0.080
Looks like a clean setup with a good risk-reward.
Just manage your risk properly and don’t chase.
DYOR, NFA
#chillguy #cryptocurrency

$CHILLGUYUSDT Trede Setup$CHILLGUY is respecting its ascending trendline on the 1H chart and showing signs of a bounce.
- Entry Zone: $0.086–$0.088
- Stop Loss: $0.081
Targets:
• TP1: $0.100
• TP2: $0.116
As long as the price holds above the trendline, continuation is likely.
DYOR. NFA.

$CHILL/USDT Trade SetupPrice is bouncing off a key demand zone + ascending trendline on the 1H chart, showing strong bullish structure. 📈
- Entry Zone: CMP
- Stop Loss: $0.09114
- Targets:
• TP1: $0.1070
• TP2: $0.1150
• TP3: $0.1187
As long as price holds above the trendline and demand zone, upside targets stay valid. Break below SL kills the setup.
DYOR, NFA

#ChillGuy Breakout Confirmed – Long Setup Active!#ChillGuy has broken out of a symmetrical triangle and is currently holding above horizontal support in the short term, which looks strong !
We can consider a long position at the current market price (CMP) with a stop-loss at $0.0857.
If the market plays out as expected, we could see a solid move from here.
DYOR, NFA

$CHILLGUY Cooling Off – Accumulation Zone Ahead?$CHILLGUY is pulling back after a strong run-up.
Price is currently sitting around the $0.0757 area, but in my opinion, there could be a drop towards the lower zone around $0.052–$0.060.
That area could be a solid spot for accumulation.
Keep an eye on this zone. 👀
Stay tuned I’ll keep you updated if anything changes.
#chillguy #Altseason2025

CHILLGUY/USDT — Bearish Reaction from Supply Zone Ahead?The price is currently reacting from a well-defined supply zone around 0.1150–0.1203 after forming multiple rejections near the highs. This area aligns with prior resistance, which could now serve as a pivot point for a short opportunity.
Key Technical Highlights:
Price made a strong move up but failed to break and hold above 0.1203.
A minor range has formed, signaling distribution characteristics.
The recent wick into supply followed by a bearish rejection indicates possible exhaustion.
Trade Setup:
Entry Zone: 0.115 (within supply)
Stoploss: Above 0.1205
Targets:
• TP1: 0.107
• TP2: 0.0995
• TP3: 0.0880
Watch for bearish confirmation before entering, as price is still testing the upper boundary of the range.

$CHILLGUY/USDT ready for a massive pump to $0.15BYBIT:CHILLGUYUSDT has been showing bullish signs, and is earing up for a big bullish push. Having broken and retested the $0.045 resistance zone, and also a break out rom the bullish flag formed. I believe we are about to see a huge rally up to $0.15 region, but then some resistance zones should not be overlooked as price usual bounce off from such support & resistance zones.
So prices is expected to push to;
TP1: $0.063
TP2: $0.09
TP3: $0.15
Expect minor retracements along the way.
