CHRUSDT trade ideas

chr usdt cup and handle pattern chr usdt expected very big move in the next few days so arrange yourself and put higher profit levels if you like our idea follow us and promote

CHRUSDTThe entry point is a range, it may be higher in some exchanges, please be aware
range of chr
2070
until 2074
and SL is 0.2052
Tp 0.2154

ORAI/USDTOrnusdt it can make 100%
it will test ma 200 i think will be break if happen it will rise 4X

Chromia longChromia broke trough the descending trendline. Asset broke trough the resistance area. Bullish movement to resistance level at 0.2288 is expected to happen.


CHR analysis
CHR is rejected from the resistance area of $0.227-$0.234. The local support is $0.196-$0.199 area and we will see a test of this zone. The major support is $0.15-$0.16 area. A break above the resistance is bullish and we see a move towards the $0.288-$0.296 area.

CHRUSDTHello Crypto Lovers,
Mars Signals team wishes you high profits.
This is a 4-hour-time frame analysis for CHRUSDT
According to our previous analysis on July 19, we predicted a falling trend and now you see this has truly happened. In this chart, we have R2 and R1 as our resistance areas and both express the disability of the price in order to rise. And S1 is the support line and it shows the support of the price at some points. Here we have the price fluctuating over R1 and by receiving some confirmation candles, we consider our long position and then we expect a rise for it to R2. In case the price moves below R1, then more fall would be waiting for it and it may be able to rise again.
Warning: This is just a suggestion and we do not guarantee profits. We advise you to analyze the chart before opening any positions.
Wish you luck

Chromia longChromia is bouncing off the Fibonacci 0.5 level and bouncing off the resistance area. Bullish trend is likely to continue and reach the resistance level at 0.219.

CHR/USDT 160% PUMP INCOMING! BEST BUY ZONE..??Hello everyone, if you like the idea, do not forget to support with a like and follow.
Welcome to this CHR/USDT trade setup.
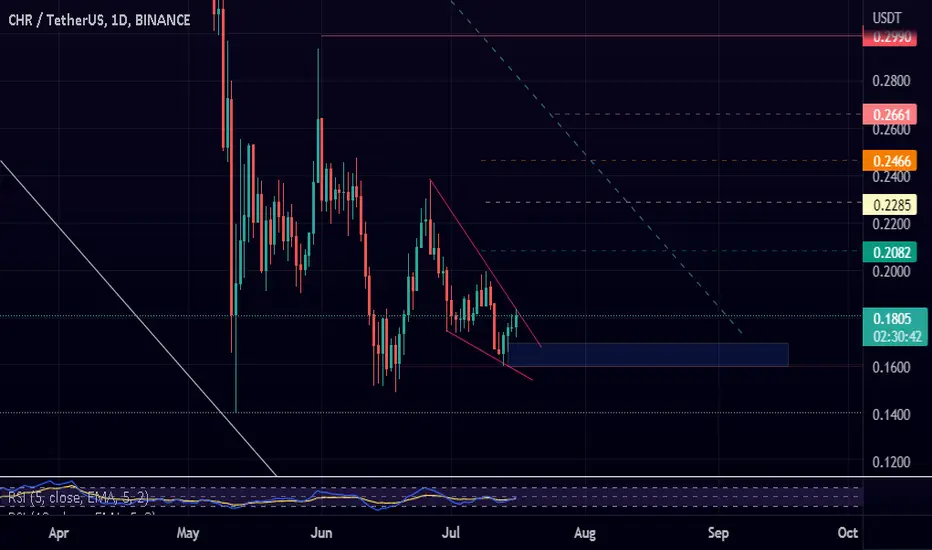
CHR looks good in the daily time frame. Breaks out from the falling wedge pattern. RSI also shows bullish divergence and a breakout. Buy at the retest level.
Entry range:- $0.165-$0.190
Target1:- $0.22
Target2:- $0.27
Target3:- $0.32
Target4:- $0.42
SL:- $0.15
Buy only on spot and hold it.
If you like this idea then do support it with like and follow.
Also, share your views in the comment section.
Thank You!

CHRUSDTHello Crypto Lovers,
Mars Signals team wishes you high profits.
This is a one-day-time frame analysis for CHRUSDT
In this chart, we have R1 as our resistance area shows the unsuccessful attempts of the price in order to rise. Then we have S1 which used to be a resistance line and S2 is a support line that expresses the support of the price at some points. Here we see the price fluctuating over S1 and we expect it will fall to this line and then our long position is considered and after that, it will rise to R1. It is not so probable for the price to fall below S1.
Warning: This is just a suggestion and we do not guarantee profits. We advise you to analyze the chart before opening any positions.
Wish you luck

CHR/Chromia price updateCHR/Chromia price update
some news are comming will take 20 to 50% and exit
not a financial adivce

CHR DAILY_T Analyze>>>>>>>>>>>>>Hello EveryOne
I Have Tried My Best to Bring the best Possible outcome in this Chart.
In the case of broken down trend line in Daily-T frame,
We can entry long trade setup>>>>>>>>>
Short term support & resistance's marked on the chart.
This is not financial advise.
PLZ DYOR
With hopping success>>>>>
CHRUSDT (1H) Long SetupThe information contained herein has been prepared for general information purposes only. The comments and recommendations contained herein are based on the personal opinions of commenters and recommenders. It should not be interpreted as a buy-sell recommendation or a promise of return on any investment instrument. These views may not be suitable for your financial situation and risk and return preferences. Therefore, making an investment decision based solely on the information contained herein may not yield results that meet your expectations.

chr long setupm15A bullish bar
A bar has a higher high and higher low
A bearish bar with a lower high and closes below the low of the second bar
Three-Bar Reversal


Chromia / CHRUSDT - VIP PASSSELL !!
The market is a never ending auction
Price : Advertiser
Time : Regulator
Volume : Validator
We analyze the reason (the volume ) and not the result (the price)
We rely on monitoring the entry and exit of systems that control a large amount of money.

CHRUSDT - SHORT📊 CHRUSDT Chromia
🔴Short Now 0.2068
🧯 Stop loss 0.2420
🏹 Target 1 0.1850
🏹 Target 2 0.1515
🏹 Target 3 0.1212
💸Capital : 1%

CHRUSDT POTENTIAL REVERSAL ?Hello Traders !
Please make sure to put a like and comment on my idea.
CHRUSDT is tring to break the long lasting downtrend , it is already respected this area and now its trying to push the price upward.
Now we are trying to retest the broken downtrend , and bullish Stochastic divergence suggesting we have good chance for the price to spike up towards level resistance 0.2500$
I would like to see the price bouncing from the level support 0.2050$ , i will be looking for a daily candle close about that level
AT the moment #BTC is trading in a uptrend since 18 June 2022 hoping to continue the uptrend , any major change in the momentum will affect the altcoins
Thank you,
Good luck traders

CHR/USDTCHR / USDT
As expected, we increased the range by 24 cents.
If it succeeds in defeating this area, it can increase up to 30 cents.
#CHRUSDT #CHR #BTCUSDT #BTC #ETHUSDT #LUNA #LUNC

#CHR 1h SHORT#CHR/USDT 🔴 SHORT ⚠️
Entry Zone : 0.1950 - 0.2000 - 0.2060 safe
SL : 0.2107 (4h CC) -5%
Take-Profit : 0.19 - 0.185 - 0.180 - 0.176 - 0.172 - 0.168 - 0.164 - 0.160 - 0.156 - 0.153 - 0.150

CHR 🥣Update🥣 Hello guys i hope u are all doing well
If price hold above this resistance we can see a positive movement
If u agree with me press like button

CHR/USDTCHR / USDT
An attractive chart!
Both low channel support, $ 1.2 support and upward divergence!
It can increase prices by up to 30 cents.
#CHRUSDT #CHR #BTCUSDT #BTC #ETHUSDT #LUNA #LUNC
