CHR/USDT CHR breaks out of the falling wedge and successfully retested the wedge we should see a spike up to the roof of the wedge
CHRUSDT trade ideas

CHR - LONG#CHR
#CHRUSDT
Current Price: 0.4601
Target 1 : 0.6436 Profit Percentage: 41%
Target 2 : 0.7777 Profit Percentage: 70%
Good Luck.


CHR/USDT SHORTER TF TRADE SETUP!Hi guys, This is CryptoMojo, One of the most active trading view authors and fastest-growing communities.
Do consider following me for the latest updates and Long /Short calls on almost every exchange.
I post short mid and long-term trade setups too.
Let’s get to the chart!
I have tried my best to bring the best possible outcome in this chart, Do not consider it as financial advice.
Welcome to this CHR /USDT TRADE setup. CHR looks good here.
CHR is breaking out from the falling wedge-like structure in 4hr time frame. A retest is also done. I'm expecting a 25-30% pump from here.
Entry range:- $0.419-$0.429
Target:- 25-30%
SL:- $0.396
Lev:- 5x-10x
This chart is likely to help you in making better trade decisions if it did consider upvoting this chart.
Would also love to know your charts and views in the comment section.
Thank you

CHR NEW ATH SOON???Chrr barely touched weekly demand zone and reacted pretty well from it.
Homever I think it will come in it again and have retest of it. There is very small chance that this zone will get broken and that chr will fall below it.
For long investments its good to buy whenevr it comes in this zone( you could go for middle entry or for top)
But for futures traders that want to get swing trade I wouldnt recommend using biiger leverage than 3 because risk to reward ratio is already pretty big even without the leverage.
THIS IS NOT FINANCIAL ADVICE ,JUST SHARING MY OPINION!!!

CHR/USDT SCALP LONG SETUP!Hello everyone, if you like the idea, do not forget to support with a like and follow.
Welcome to this CHR/USDT TRADE setup. CHR looks good here.
CHR is breaking out from the falling wedge-like structure in 4hr time frame. A retest is also done. I'm expecting a 25-30% pump from here.
Entry range:- $0.419-$0.429
Target:- 25-30%
SL:- $0.396
Lev:- 5x-10x
If you like this idea then do support it with like and follow.
Also, share your views in the comment section.
Thank You!


$CHR Looks Amazing Perfect EntryThis is the weekly chart so we should wait for the close but the daily chart looks good so I am confident.
It's one of the most exciting projects out there with a market cap of around 300m, which is quite cheap imo. So there is a lot of room for growth. The chart is obvious, so this seems to be a perfect entry level.
I am in from 0.42 and my target is 5.
Hope this helps someone.

Chromia - Imminent BreakoutWe see a triangle formation of Chromia at the 1-hour resolution. The volume looks good, hopefully it should go up from here if the market stays stable

CHR - Long - 4H TM CHR has completed Harmonic Pattern as shown in the chart, the price now in Potential Reversal Zone (PRZ)

🆓Chromia (CHR) Apr-11 #CHR $CHR
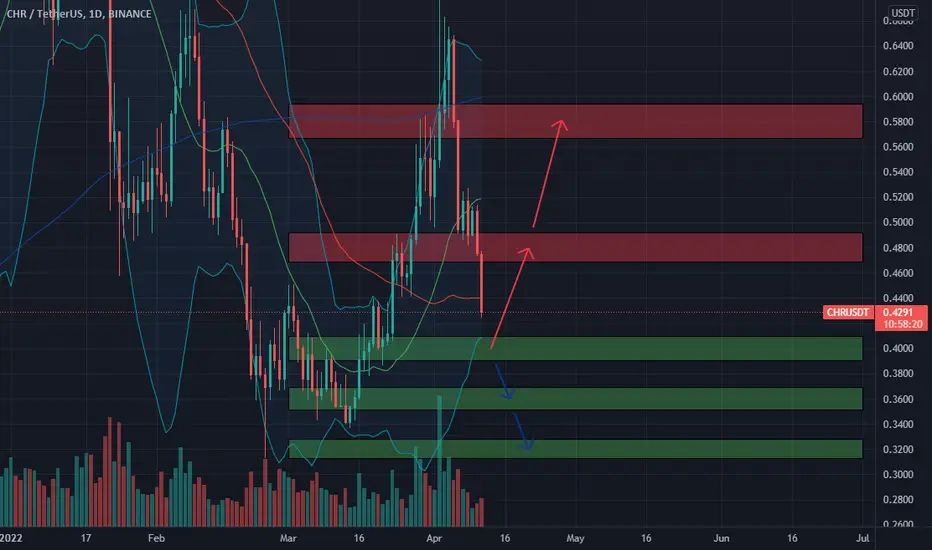
CHR is correcting to $0.4 zone and this is the support zone where we can start accumulating CHR for the upcoming recovery of CHR. It may take a long time for CHR to break through the $0.6 zone, but the $0.48 and $0.58 zones are still possible for the next recovery.
📈RED PLAN
♻️Condition : If 1-Day closes ABOVE 0.4$ zone
🔴Buy : 0.4
🔴Sell : 0.48 - 0.58
📉BLUE PLAN
♻️Condition : If 1-Day closes BELOW 0.4$ zone
🔵Sell : 0.4
🔵Buy : 0.36 - 0.32
❓Details
📈Red Arrow : Main Direction as RED PLAN
📉Blue Arrow : Back-Up Direction as BLUE PLAN
🟩Green zone : Support zone as BUY section
🟥Red zone : Resistance zone as SELL section
CHR ScenariosCHR formed a harmonious pattern head and shoulders and is now dealing with a dynamic support and if the support does not break,
it will see higher goals.

CHR about to lose ground?Hey Guys, I like CHR and I think it has a lot of gains in the future, but now it looks like it could dump a little bit.
What you thinking?
DYOR!
Happy Trading!

Chromia shortChromia broke trough the support level. Asset broke trough the ascending trendline. Bearish movement to support level at 0.38 is possible.

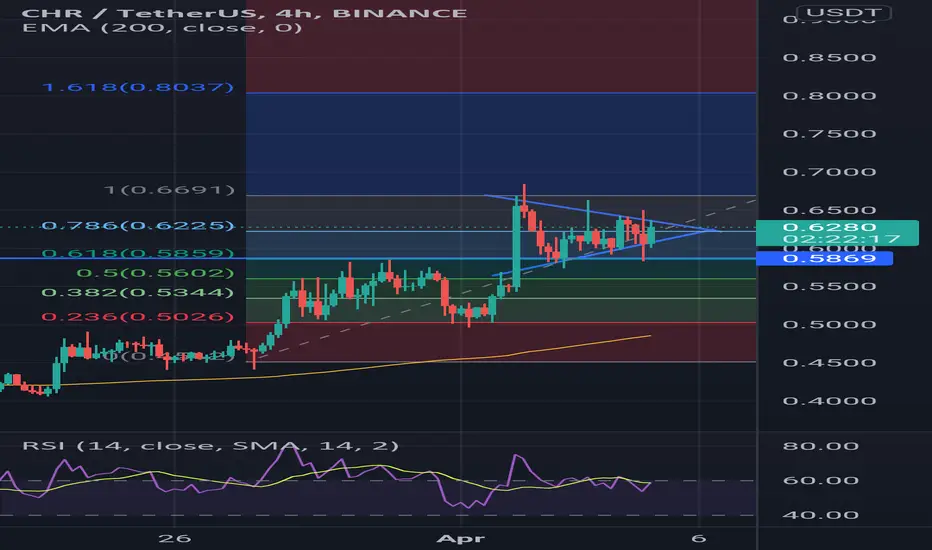
CHR Low Time frame resistance CHR on the 4H TF is close to the resistance of $0.68, the past couple of hours we have seen a few failed test to break the resistance . In case we test the resistance again and get rejected I would be expecting for CHR to find support around $0.58 .
In case after the rejection there is a trend reversal we could see the coin falling back to $0.47 .
On the other hand in case we break through the resistance the next level I would be looking out is $0.77, $0.88 and $0.95 - $1

Don't overlook Chromia! Here's a quick look at the CHR Daily chart . As we can see, the price has broken out from its bigger downtrend and a bigger reversal could be upon us. If you didnt catch the breakout from the previous setup , then the best entry now would be when the price breaks above 0.682$ with good amount of volume . Definitely one to keep an eye on!
-------------------------------------------
The idea is: Buy when the price breaks above 0.682$ and take profits at the levels shown in the chart.
Targets:
1. 0.75$
2. 0.86$
3. 0.97$
4. 1.24$
5. 1.5$
-------------------------------------------
If you like the content, then make sure to comment and like the post :D
Follow me for daily profitable trading setups
BTC dictates the market. If BTC falls, then Alts will fall as well. Trade safe!

Clear bulish U can see in the chat CHR is creating the triangle if it will brake then we can see pump in it so keep eye on 51 lavel it is the main resistance for it 💗💥

CHR - LongCHR
CHRUSDT
Potential Harmonic Pattern
Target 1 - 0.643 Profit 57%
Current Price : 0.408
Activation point: 0.454
Good Luck

Quick Look at CHRHere's a quick look at the CHR Daily chart . As we can see, the price has broken out from its bigger downtrend and a bigger reversal could be upon us. If you didnt catch the breakout from the previous setup , then the best entry now would be when the price breaks above 0.682$ with good amount of volume . Definitely one to keep an eye on!
-------------------------------------------
The idea is: Buy when the price breaks above 0.682$ and take profits at the levels shown in the chart.
Targets:
1. 0.75$
2. 0.86$
3. 0.97$
4. 1.24$
5. 1.5$
-------------------------------------------
What Is a Wedge in the context of trading?:
"A wedge is a price pattern marked by converging trend lines on a price chart. The two trend lines are drawn to connect the respective highs and lows of a price series over the course of 10 to 50 periods. The lines show that the highs and the lows are either rising or falling and differing rates, giving the appearance of a wedge as the lines approach a convergence. Wedge-shaped trend lines are considered useful indicators of a potential reversal in price action by technical analysts.
Key Takeaways for Falling wedges:
1. Wedge patterns are usually characterized by converging trend lines over 10 to 50 trading periods.
2. The patterns may be considered rising or falling wedges depending on their direction.
3. These patterns have an unusually good track record for forecasting price reversals."
-------------------------------------------
If you like the content, then make sure to comment and like the post :D
Follow me for daily profitable trading setups
BTC dictates the market. If BTC falls, then Alts will fall as well. Trade safe!

CHR/USDT Technical analysis CRYPTOCurrent technical analysis for CHR/USDT do not recommend buying if it does not reach the buy zones due to high potential risk, and when bought at the buy zones always keep a stop loss to your liking! If you have any questions or cryptos or stocks you would like for my to analyze feel free to drop a comment and if you have any criticism towards my chart or anything you would like to add to it let me know would be greatly appreciated!
White line = buy zone and previous strong support
Red line = current support
Orange line = current resistance
Yellow line = future resistance
Cyan line = future resistance
Green line = top resistance
White line = what i think will most likely occur
Yellow line = has strong possibility of occurring but less likely
Not financial advice invest at your own risk and only put in money you are ready to loose and please DO YOUR OWN RESEARCH!!!
BINANCE:CHRUSDT

CHRUSDT PROJECTION IN ELLIOT WAVE WITH SUPPORT RESISTANCEThat Projection show about CHRUSDT in the next future, before you looking the chart i want to say its "Disclaimer ON".
I Just Drawing with Eliot Wave Strategy mixed with Support Resistance to create the next scenario on one of altcoin CHR.
If you have any suggestion/comment on this chart dont to hesitate to comment on below. if you agree with my projection i just want say thanks you :)
Thanks,
KA

CHR high pump potentialAdditional annotation on the price action of CHR.
using the supertrend + EMA 200 strategy, the price action appears to be in a good place for a long position. my ideal price is between 0.45$ and 0.5$, and hodl unless the supertrend indicator states otherwise.
