#CHR/USDT#CHR
The price is moving within a 12 hour descending channel pattern, which is a strong retracement pattern
We have a bounce from a major support area in the color EUR at 0.2000
We have a tendency to stabilize above the Moving Average 100
We have a downtrend on the RSI indicator that supports the rise and gives greater momentum and the price is based on it
Entry price is 0.2365
The first target is 0.2690
The second target is 0.3180
The third goal is 0.3744
CHRUSDT trade ideas

#CHR investment planthis will be my investment plan in crypto i'll be publishing 10 of my watchlist with prediction to break march top
buying area in blue 🟦
targets in green 🟩

Trading opportunity for CHRUSDTBased on technical factors there is a Buy position in :
📊 CHRUSDT
🔵 Buy Now
🪫Stop loss 0.2150
🔋Target 1 0.3150
🔋Target 2 0.3700
🔋Target 3 0.4700
💸RISK : 1%
We hope it is profitable for you ❤️
Please support our activity with your likes👍 and comments📝

$CHR waiting for the breakoutCHR seems bullish on this timeframe, I am waiting for a clear breakout, strong order block to pass

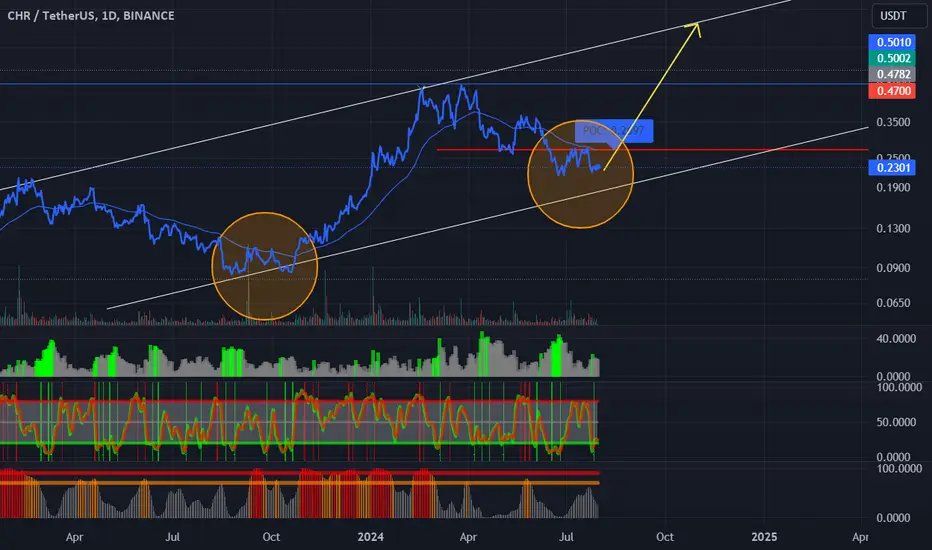
Alikze »» CHR | Movement in the ascending channel🔍 Technical analysis: Movement in the ascending channel
- It is moving in a long-term ascending channel in the weekly time frame.
- So far, it has had several reactions to the dynamic trigger of the channel floor.
- In the previous rally, as you can see, it had a sharp growth.
- The wave correction has extended to the bottom of the channel, while the correction was able to extend to 0.23 fibo of the previous wave.
- Therefore, I expect it to enter the next bullish rally after the pullback to the swing and the green box range.
- After confirming the range of the green box, the first target will be the range of 0.29 and the ceiling of the channel. If it continues, we should witness the continuation of the upward trend, which will be provided in the following updates if it is realized.
💎 Note: In addition, if the previous floor (Invalidation LVL) is touched, the upward analysis will be canceled from the validity level.
»»»«««»»»«««»»»«««
Please support this idea with a LIKE and COMMENT if you find it useful and Click "Follow" on our profile if you'd like these trade ideas delivered straight to your email in the future.
Thanks for your continued support.
Best Regards,❤️
Alikze.
»»»«««»»»«««»»»«««
BINANCE:CHRUSDT


Falling wedge for CHRUSDTHi. I happy to sharemy view of BINANCE:CHRUSDT and I believe will get higher, first resistance is 0.2.

CHRUSDTCHR ~ 4D
#CHR Continue moving in this descending pattern. Wait for this descending pattern to be successfully broken to start buying this coin.


when the market goes again to the same levelNot the last drop... It will rise to 0.2141, and then there will be another drop to the same level 0.1615..., and then the triangle pattern will be completed to take off and the currency will recover greatly
buy when the market goes again to the same level

CHRUSDTCHR ~ 5D ✅
#CHR Make purchases in stages from here. it's just a matter of time until the bulls come back and start pumping these Coins.

CHR - Breakout will push the price higher#CHR/USDT #Analysis
Description
---------------------------------------------------------------
+ Price is trading inside the channel and waiting to breakout from the channel
+ This breakout could change the downtrend started in early 2024
+ A rejection at the resistance could push the price further down.
---------------------------------------------------------------
VectorAlgo Trade Details
------------------------------
Entry Price: 0.21
Stop Loss: 0.1592
------------------------------
Target 1: 0.2759
Target 2: 0.3481
Target 3: 0.4485
Target 4: 0.7180
------------------------------
Timeframe: 1W
Capital Risk: 1-2% of trading amount
Leverage: 5-10x
---------------------------------------------------------------
Enhance, Trade, Grow
---------------------------------------------------------------
Feel free to share your thoughts and insights.
Don't forget to like and follow us for more trading ideas and discussions.
Best Regards,
VectorAlgo

[CHRUSDT] - macro chart!established an nice HL in weekly chart
the key level is 0.24$ once breakout we will see 300% bullish rally
best regards Ceciliones🎯

$Chrome to likely fall to $0.045BSE:CHROME to likely fall to $0.045
We took a sell at $0.2045 yesterday and we are now deep in profit.
My view for $Chromia is clear on the attached TA chart. watch out for the zones. I hope it gets to $0.1848 zone today.

#CHR/USDT SHORT TRADE IDEA#CHR/USDT SHORT TRADE IDEA👹
Leverage: 25x
Entries: $0.2471
Take profit 1: $0.2435
Take profit 2: $0.2324
Take profit 3: $0.2067
Stop Loss: $0.2607
NOTE: This is just my prediction. Be sure to use STOPLOSS and remember that I am not a financial adviser. your money, your risk!
BINANCE:CHRUSDT.P
Thanks
The sroced.

CHROMIA is completing B wave to the uptrendhello elliot familly !
i think chr is going above in order to complete minor c wave of bigger B .
IF SO , 200% GAIN IS POSSIBLE
#DYOR

CHRUSDT(Chromia) Updated till 24-08-24CHRUSDT(Chromia) Daily timeframe range. its having a decent retrace from its recent low. altho compare to other alt it didn't create a new low which is a good thing. not far from 0.2760 breaking it clean can lead it to 0.3674. recent support at 0.1480.

CHRUSDTHM Triangle BO v1.0 spotted. Looking good with previous wave down with increasing volume and momentum.
- BOS (Breaks of Structure) at @ 0.1699-0.1751 level
- Trending slow and steady if able to hold below the BOS level
It is at extremely good reward to risk level if able to break up the upward trendline.

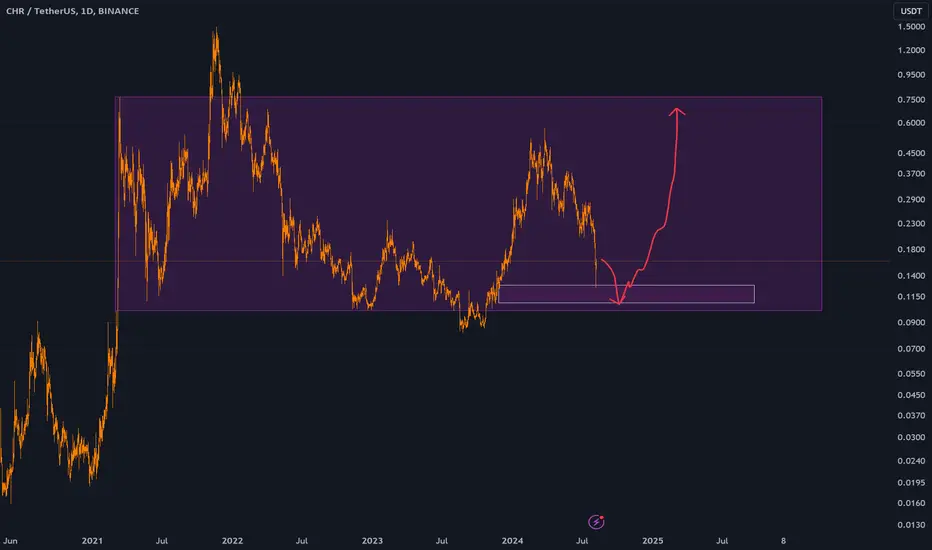
CHR's long term is bearishCHR seems to have completed a big triangle and can become bearish for the medium and long term.
From the supply range, we expect a downward price rejection.
The mid-term and long-term target is the lower green box.
Closing a daily candle above the invalidation level will violate the analysis.
For risk management, please don't forget stop loss and capital management
Comment if you have any questions
Thank You

CHR longGlobally, we are in a long-term trend and now there has been a good correction of the asset. The situation is similar with AVAX. We have a large lateral and this is its lower part, as I expect Bitcoin to continue falling, so accordingly there will also be a fall here - where is the best time to buy
CHR bullish ideaCHR possibly at the bottom gearing up to rise to the top of the channel and possibly breaking the channel
Incoming pump on chrudstA 5 wave correction forming a falling wedge will lead to a massive pump after the breakout in the coming days.

CHRUSDT.1DAs I delve into the technical analysis of the CHR/USDT daily chart, it becomes apparent that the market is navigating a critical juncture, reflected by several technical indicators and price actions.
Market Overview:
The current price of CHR/USDT is $0.2556, witnessing a decrease of 3.15% in the latest trading session. This negative movement needs careful examination against the backdrop of the broader market trends and key technical levels.
Trend Analysis:
The price has been following a descending trend, as indicated by the downward sloping line that connects the series of lower highs. This trend suggests persistent bearish pressure. Observing this, I note that any strategic decision will need to consider the potential continuation or reversal of this trend.
Support and Resistance Levels:
S1 at $0.2024: This level serves as the immediate support. The price's proximity to this level suggests it might soon play a crucial role in either halting the decline or, if breached, accelerating the bearish momentum.
R1 at $0.3332: This is the current resistance level. A breach above this could indicate a potential reversal or at least a pullback within the ongoing bearish trend.
Technical Indicators:
Relative Strength Index (RSI): The RSI stands at 49.97, hovering just below the neutral 50 threshold, indicating a balance between buying and selling pressures. This neutral stance may shift if external market forces or fundamental changes impact trader sentiment.
Moving Average Convergence Divergence (MACD): The MACD line is slightly above the signal line but very close, suggesting a marginal bullish momentum in the short term. However, the proximity of these lines also signals a potential change could be imminent.
Volume Analysis:
While not explicitly shown, the volume associated with price movements would provide deeper insights. Increasing volume on downtrends confirms bearish strength, while decreasing volume may indicate weakening bearish momentum.
Strategic Trading Advice:
In my current strategy, maintaining a cautious stance is prudent. I would monitor the S1 level closely for any signs of a breakdown. A decisive close below this support could open positions for a short, targeting further declines. Conversely, any bullish reversal signals, especially a sustained move above R1, would necessitate a reevaluation of the bearish bias, potentially shifting to a more bullish or neutral trading strategy.
Conclusion:
The CHR/USDT pair presents a complex trading environment where careful monitoring of key technical levels and indicators is essential. The proximity to critical support suggests that the next few trading sessions could be pivotal. As always, incorporating stop-losses and closely watching market developments will be key to navigating this volatile environment effectively.
