Chromia NikeWe can see the Nike formation.
It was the finishing movement of ABC pattern?
Rsi is close to 50% bounce?
We have seen other coins who have done exactly the same.
Bull run is coming
CHRUSDT trade ideas

Will Chr moon? My viewChr currently trading on a critical zone, the bull trying to hold and maintain 1usd price... Currently trading on a decending traigle, and a key overall trend line.... If break, we might see some down side, to 0.92, but if hold... Possibly another ATH for chr...
Pls note... This is not a financial advise, but just my own personal view.
DYOR

CHRUSDT 3H - Symmetrical TriangleCHRUSDT (3H) - Technical Analysis
Symetrical Triangle Pattern
Entry Point :
1.26 (After Breakout
Target 1 - 1.31
Target 2 - 1.34
Target 3 - 1.40
Target 4 - 1.44
Target 5 - 1.50
Target 6 - 1.56
Target 7 - 1.60
Target 8 - 1.70
Stop Loss : 1.07
Keep in mind leverage trading can be highly risky, trade with not more than 5% of your funds in leverage trades.
*Not financial advice.
If you want me to share these trades here, hit the like button and share your views in the comment section.


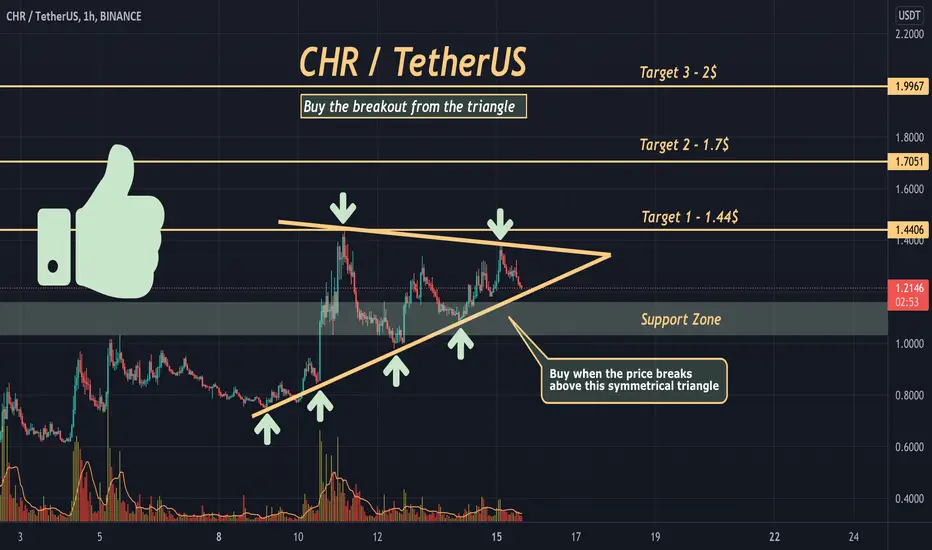
CHR is loading up for another big push to the upside! Here's a quick look at CHR 1 hr chart. As we can see, the price has printed a symmetrical triangle. The price will probably revisit previous ATH when it breaks out. Definitely one to keep an eye on.
The best entry would be, when the price breaks above the symmetrical triangle with good amount of volume , or you can buy when the price breaks above 1.44$.
-------------------------------------------
The idea is: Buy the breakout from the symmetrical triangle (or 1.44$) and take profits at the levels shown in the chart.
Targets:
- Profits can be taken in the resistance zone .
1. 1.44$
2. 1.7$
3. 2$
-------------------------------------------
What are triangles when it comes to trading?
Key points:
"1. In technical analysis , a triangle is a continuation pattern on a chart that forms a triangle-like shape.
2. Triangles are similar to wedges and pennants and can be either a continuation pattern, if validated, or a powerful reversal pattern, in the event of failure.
3. There are three potential triangle variations that can develop as price action carves out a holding pattern, namely ascending, descending, and symmetrical triangles."
-------------------------------------------
If you like the content, then make sure to comment and like the post :D
Follow me for daily profitable trading setups
BTC dictates the market. If BTC falls, then Alts will fall as well. Trade safe!
chrusdtcurrently CHR seems to be trading a ascending channel, a 4hr candle close below 1.26.. signify more downside
but a close above the zone... within the trend channel, means... more upside to come..
but generally, i feel the excitement and everyone is bullish with CHR, the sentiment is strong!
kindly dyor.. not a financial advice, just an opinion

CHRUSDT PULLBACK BEFORE GO HIGHERCHRUSDT (3H - Chart Analysis)
Hello guys, after successfully breaking the symmetrical triangle.
CHR was rejected from its strong resistance, this is a natural movement.
But, the next direction sill same, CHR will still go higher if we look at it from a large timeframe.
-
Happy profit from my last call
-
Buy on the green line or in the black box area and keep your stoploss put on 0.97
Keep in mind leverage trading can be highly risky, trade with not more than 5% of your funds in leverage trades.
*Not financial advice.
If you want me to share these trades here, hit the like button and share your views in the comment section.

CHRUSDT - 350% possible returnsI hear your comment. 350% returns?
Yeah, NFT madness. Did you see MANA ran up 400% in 2 days. then why cannot SAND or CHR or CHZ?
Technically, breakout.
So bought and will add on dips to $2.2
Please #DYOR and check my other ideas as well.


CHR AnalysisI think we are heading up, this is proven through the daily pattern it is in and broken out of, in a few days we will get that huge pump up! Follow my Tiktok ZKInvesting for all the updates on crypto gems and bitcoin of course!

H4 chill Trading of District 2D2 ninja candle.
Unchanged OR B/O?
LRCUSDTPERP - 1% VAR for exp.
Possible Chill Trading Setup for Crypto.

CHR is ready to fly 👌📈📈 Oct 22
Hello guys i hope u are good
for now i am still bullish 🙏🏼
If u are agree with me press like button
-------------------------


CHRUSDT - Symmetric triangle!CHRUSDT (4h Chart) Technical analysis
CHRUSDT (4h Chart) Currently trading at $1.24
Buy level :Above $1.26 (Buy after Breakout)
Stop loss: Below $1.07
TP1: $1.34
TP2: $1.44
TP3: $1.60
TP4: $1.80
Max Leverage 3x
Always keep Stop loss
Follow Our Tradingview Account for More Technical Analysis Updates, | Like, Share and Comment Your thoughts.

CHR / USDT in a falling wedge!CHR (Chromia), the parent of NFT game MyneighborAlice, has been recognized as one of the best startups in Sweden. It has pumped after great news recently.
As it is right now, CHR / USDT 1H is in a falling wedge.
If the price breaks the upper line of the falling wedge - I recommend that you wait for a solid confirmation - then enter a long position.
Take profit ideas:
TG1 - 1.30$
TG2 - 1.36$
TG3 - 1.43$
I keep it simple and clean!
Likes, comments, and follows are dearly appreciated.
Let me know what you think and which ones you would like for me to analyze next.
Trade safely!

CHRUSD 4h timeframes Bullish Pennant Chart PatternThere is a bullish pennant chart pattern on the CHRUSDT chart.

CHRUSDT is creating a descending channel CHRUSDT is creating a descending channel after a breakout from the weekly ascending triangle.
If the price is going to have a breakout from the descending channel, According to Plancton's strategy (check our Academy), we can set a nice order
–––––
Follow the Shrimp 🦐
Keep in mind.
🟣 Purple structure -> Monthly structure.
🔴 Red structure -> Weekly structure.
🔵 Blue structure -> Daily structure.
🟡 Yellow structure -> 4h structure.
⚫️ Black structure -> <4h structure.
Here is the Plancton0618 technical analysis, please comment below if you have any question.
The ENTRY in the market will be taken only if the condition of the Plancton0618 strategy will trigger.

CHR tradeThink this will run it back. BIG FA coming later in November with its upcoming mainnet. Could consolidate for a bit first, but also can bounce sharply imo. As long as BTC does not lose 60k I think this will do well. I am not running a hard stop.

CHR/USDTOn track and on sight for $3
From 1.40 to $1.03 a healthy pull back on the fib, once retail pumps the volume up once again smart money will start to unload backs along the way

CHRUSDT Long- CHRUSDT can be found on Binance and Kucoin
- Price has recently surged
- Healthy correction followed suit
- Intraday charts look promising
- We could see a further pullback to $0.94


bullish as hell$CHR looking good. Bulla div on H4 & sitting at low range. No need to say it but your eyes should be on BTC or BTC pairs

CHR/TetherUS testing supportTrading view does not letting me to publish the idea with lower time frame. But if u see it on the 5min TF it looks like BTC correction chart. it may go lower to the support line and then rebounce. I need more confirmation .
For now... staying neutral
