CHR Important levels - Gann GridHello Dear Traders,
- Important Levels
On the Chart "Horizontal Lines" Based on Gann Square of 9
Works as Support/Resistance. Watch for Price action around those levels
- Jinny Gann Grid
- Vertical lines works as time lines. Expect Reversal around them.
For Today
Support : 0.251 - 0.22
Resistance :0.251 - 0.283 - 0.3184
Wish you Good Luck Trading.
CHRUSDT trade ideas

CHRUSDT(Chromia) Daily tf Range Updated till 05-07-24CHRUSDT(Chromia) Daily timeframe range. market is on dumping mode so nothing out of ordinary here. breaking 0.2097 clean can lead it to 0.1545. of course that needs a valid daily close. a buyback or retrace more possible in lower mid level after market stables.

CHR buy/long setupAfter the heavy drop, it has now broken the trigger line and created a bullish iCH.
There is a support area close below the price, on which we will look for buy/long positions if the price reaches this range.
The targets are clear on the chart.
Closing a daily candle below the invalidation level will cause analysis.
Note that the financial market is risky, so:
Do not enter any position without confirmation and trigger.
Do not enter a position without setting a stop.
Do not enter a position without capital management.
When we reach the first TP, save some profit and try to move the stop continuously in the direction of your profit.
If you have any comments please post them, comments will help us improve our performance
Thanks

Chromia... Just Noticing... Bitcoin, The Altcoins & The RestThe correction might be over here, or might not be over; I don't know, this is not a trade idea for spotting an opportunity, I just want to make an observation.
Notice how Chromia's (CHRUSDT) correction after its peak in March (same as with the rest of the market), pushed prices to the same level as January 2024.
Many of the altcoins that produced a strong bullish wave, retraced to these same levels... When we look at Bitcoin, it has not retraced much, in fact, it is trading at the same price it was trading around March; the same month the bullish wave peak was hit.
This doesn't necessarily mean anything but it is indeed a market signal.
While a mega huge correction for Bitcoin can be doubtful by many, the Cryptocurrency market tends to be highly correlated and what one does, the rest tend to do exactly the same.
We can reach some conclusions based on what we are seeing... This data is just coming in; I will have much more as I go through hundreds of charts.
1) The altcoins are weaker and thus crash harder.
2) Bitcoin is yet to perform its full correction.
3) Bitcoin and the altcoins will detach.
4) etc.
These altcoins I am showing can still produce another low.
These altcoins can also go ahead and produce a mid-size wave before correcting to a higher low before a major bullish phase culminating in the 2025 massive new all-time high.
5) Bitcoin is so strong, that there is no way it is going to drop because the ETFs, the billionaires, etc., will protect retail and make them all rich.
This is another conclusion we can reach based on current data.
You know my perspective... Or you might not know, so I shall explain.
👉 Bitcoin is yet to complete its bearish wave.
The reason why it takes longer;
The reason why it will crash last; is because it is the biggest and has everybody's attention.
I mentioned many months back that the altcoins would bottom before Bitcoin.
When a prediction like this becomes true, it becomes a signal for us.
If such a statement made at random based on the charts becomes true, what other statements made at random based on massive amount of data coming from the charts will become true?
The truth is that the big projects need to go down for the smaller projects to go up, but why?
Because there is no money flowing in from new players, so the money already in needs to be used to push "the other side" of the market up.
Well, this is all just my speculative opinion; I can definitely be wrong... This is not financial advice.
I share only what I see and I appreciate you for taking the time to read.
Namaste.

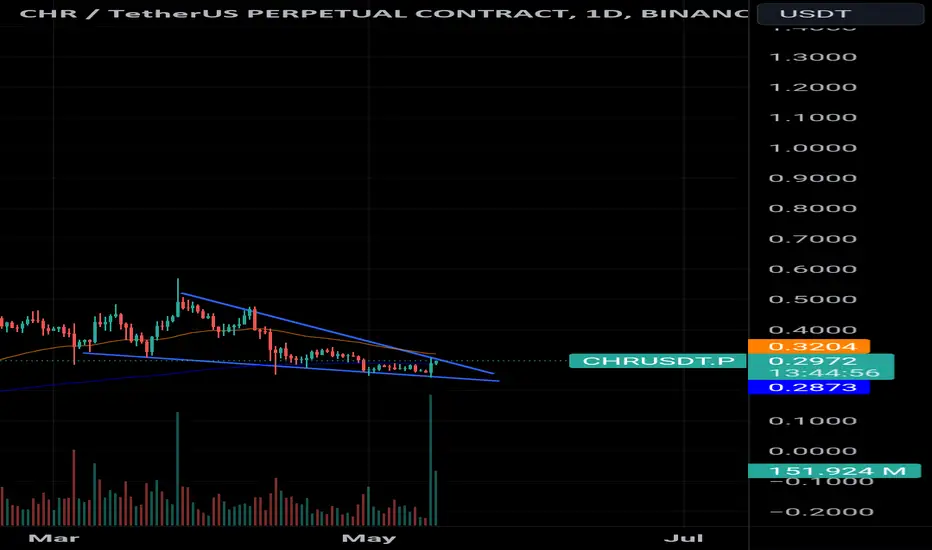
CHRUSDT 1D#CHR has bounced off the support zone and is currently moving within a falling wedge pattern on the daily chart. Keep an eye on it. In case of a breakout, the targets are:
🎯$0.3193
🎯$0.3669
🎯$0.4054
🎯$0.4440
🎯$0.4988

CHRUSDTWe can attempt to buy CHRUSDT from specified level if it break LH ,also trading falling wedge pattern (reversal pattern) , also bullish divergence occur indicate that it moves upward.
SL , TP mention in chart.

Can CHRUSDT Break Free from the Downtrend?Yello, Paradisers! Is #CHRUSDT on the verge of a significant breakout, or will it succumb to downward pressure again? Let's dive into the technicals to find out!
💎#CHR is showing signs of rebounding from a demand area, suggesting a potential reversal to the upside. The target? Testing the resistance area at the 0.297 mark, right at the resistance trendline of a falling wedge pattern.
💎Historically, we've seen consistent bounces when the price hits the support trendline. A successful breakout above this resistance could lead to bullish momentum, significantly increasing the probability of reaching our target strong resistance area.
💎However, if CHRUSDT fails to break through the resistance, it could face rejection and head back down to revisit the demand area.
💎The bullish scenario will be invalidated if CHRUSDT fails to sustain above the demand area. Should this occur, the price could dip further.
Stay focused, patient, and disciplined, Paradisers!
MyCryptoParadise
iFeel the success🌴

CHRUSDTCHRUSDT.
Will CHRUSDT get bids from buyers ?
As the price is at strong support level and bullish divergence indicating the buyers may attack this zone. If this happens and buyers start buying from here then the next target could be 0.305 followed by 0.350
What you guys think of this idea?

CHR/USDT SHOULD BOUNCE FROM HERE! ACCUMULATE NOW!!Hey everyone! If you enjoy this content, please consider giving it a thumbs up and following for more analysis.
CHR is sitting in the right position here. As you see in the chart, it is holding a good support here which is previously acting as a resistance. There is also a 200MA support here. Expecting a good bounce from here. Buy some now and add more in the dip.
Entry range:- $0.192-$0.212
Targets:- $0.34/$0.48/$0.58
What are your thoughts on CHR's current price action? Do you see a bullish pattern? Share your analysis in the comments below!

CHRUSDT Weekly Update.Hello everyone, I’m Cryptorphic.
For the past seven years, I’ve been sharing insightful charts and analysis.
Follow me for:
~ Unbiased analyses on trending altcoins.
~ Identifying altcoins with 10x-50x potential.
~ Futures trade setups.
~ Daily updates on Bitcoin and Ethereum.
~ High time frame (HTF) market bottom and top calls.
~ Short-term market movements.
~ Charts supported by critical fundamentals.
Now, let’s dive into this chart analysis:
CHR is in a downtrend entering the support range between $0.1341 and $0.1925. From the Resistance 1 level at $0.498, CHR has already rejected 63% and according to the current price action, it is likely to be rejected further.
Here are the key observation levels:
Support and Resistance Levels:
~ Support 1: $0.1341 to $0.1925.
~ Support 2: $0.0851.
~ Resistance 1: $0.498.
~ Resistance 2: $1.249.
~ Bullish Scenario: The price is expected to bounce from Support 1 around $0.1341. The projected path shows a potential rise towards Resistance 1 around $0.4980.
If the price breaks above Resistance 1, the next target would be Resistance 2 around $1.249, representing a significant gain of approximately 1388%.
~ Bearish Scenario: If the price fails to hold Support 1, the next strong support level is at Support 2 around $0.0851. A break below Support 2 could lead to further downside.
DYOR. NFA.
Please hit the like button to support my content and share your thoughts in the comment section. Feel free to request any chart analysis you’d like to see!
Thank you!
#PEACE

CHRUSDT | Bull Flag Analysis🚀 Exciting trade opportunity forming on CHRUSDT—you don’t want to miss this one!
Market Context
BTC is rising, and altcoin season is just around the corner!
Daily Chart
We saw an amazing breakout on the daily chart with a strong green candle. This signals robust bullish momentum.
2-Hour Timeframe
We're currently in a small retest phase. On the 2-hour chart, we've broken the previous high and are retesting it immediately. This is a classic sign of an upcoming move upwards.
Trade Setup
With a risk-reward ratio of nearly 8:1, this trade is too good to pass up! I'm targeting the next daily high, which aligns perfectly with our bull flag target.
This setup looks incredibly promising—let's see how it plays out!

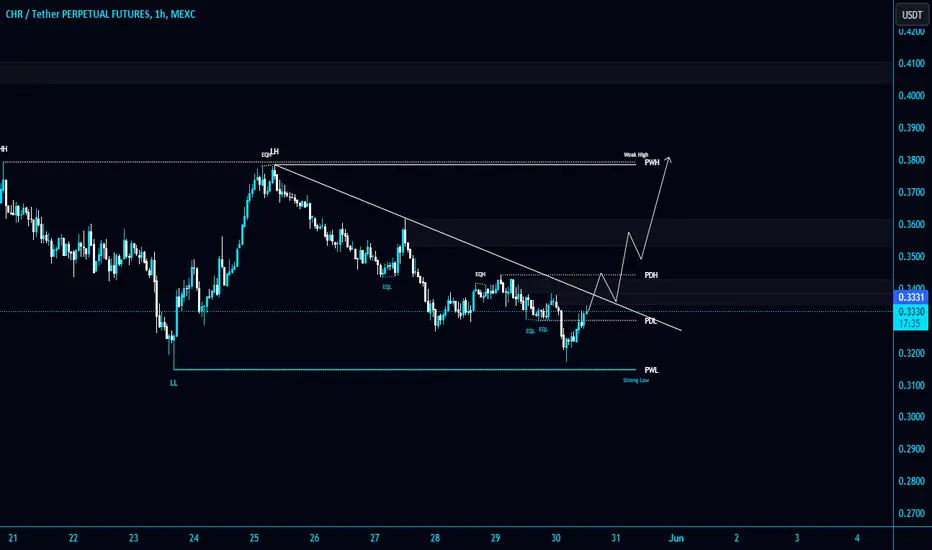
#CHR/USDT is heading towards a retest of the Diagonal Trendline #CHR/USDT is heading towards a retest of the Diagonal Trendline in 1-Hour TF!
Wait for BO and retest to open a long position. NASDAQ:CHR local resistance level is PWH $0.3788.
CHRUSDTWe can attempt to buy CHRUSDT from specified level as it break LH , trendline resistance , also bullish divergence occur indicate that it move upward.
SL , TP mention in chart.

CHR/USDT falling wedge bullish horizon? 👀🚀CHR analysis 💎Paradisers, observe as #CHRUSDT recently broke out from a falling wedge, indicating a strong potential for a bullish move, with the 100-day moving average currently posing as resistance.
💎 Following the breakout from the falling wedge, the price is now in a demand zone. If it maintains momentum here, there's a high probability it could break through the significant resistance above.
💎 However, given the market's volatility, if NASDAQ:CHR fails to keep up its momentum and drops below the demand level at $0.3018, this could suggest a weakening of the bullish position, potentially leading to a significant decline. In such a scenario, we might see a bullish rebound from a lower, strong support level $0.2503, but breaking below this could result in substantial downward movement.
MyCryptoParadise
iFeel the success🌴

CHRUSDT 4HBuy some #CHR here and on its support level of $0.2423
Falling wedge formation on 4H timeframe and it is about to break the resistance. In case of a clean breakout, the targets are:
$0.3193
$0.3669
$0.4054
$0.4440
$0.4988
$0.5686
Support is: $0.2423

#CHR/USDT ANALYSIS CHR is currently moving within a falling wed#CHR/USDT ANALYSIS
CHR is currently moving within a falling wedge pattern, nearing a breakout point where the 100-day moving average (MA) is also serving as resistance. A strong breakout from the falling wedge would confirm bullish momentum.
CHRUSDT is BullishCHRUSDT made a bullish RSI divergence on 4H time frame, and the bullish momentum was further confirmed by the formation of higher high, this means that bulls have taken control of the price action and a bullish rally is on the cards. Targets are mentioned on the chart.

CHRUSDTCHRUSDT was trading under the declining trendline. The price was reacting well the support and resistance of trendline
Currently the price has given the breakout from declining trendline with confluence to strong bullish divergence and now seems like the bulls are getting ready for some strong upside movement.
If the bulls sustain to upside the optimum target could be 0.3500
What you guys think of this idea?

Chromia longChromia bounced off the lower boundary of horizontal channel. Bullish movement to resistance level at 0.2817 is possible.

CHRUSDT.1DThe daily chart for Chromia (CHR/USDT) shows that the asset has been trading within an ascending channel, indicating a bullish trend. However, the recent price action has dipped towards the lower boundary of the channel, currently at $0.3283, which could be a crucial support level (S1) at $0.2409.
The resistance level (R1) has been established at around the previous high of $0.5029. The RSI is slightly bearish at 41.81, and the MACD is below the signal line, both indicating that there might be more bearish momentum in the short term.
Traders might look for buying opportunities near the lower boundary of the ascending channel with a stop loss below S1, aiming for R1 as a short-term target. If the price breaks below the channel, it could signal a potential reversal of the bullish trend. It would be wise to wait for a clear signal such as a breakout or a bounce from key levels with confirming volume before making a trade decision.

Chromia 1-2 SetupChromia appears to be undergoing Wave 2 of Wave C, with an anticipated further decline before the ascent of Wave 3 of Wave C begins. It's feasible that this additional low might not occur, and instead, the price could rally during Wave 3 of C. Traders are advised to gradually buy at support levels and sell at resistance. The projected price range for Wave C lies between $4 and $13. Although there are higher potential targets, their reliability seems questionable.

CHRUSDT Trading opportunityCHRUSDT is currently demonstrating strength as it holds the ascending trendline, indicating underlying bullish momentum. Additionally, there are signs of a potential rounding bottom formation, with the neckline serving as a crucial external supply level.
Our plan involves accumulating the coin within the immediate demand zone and patiently waiting for it to test the significant neckline resistance zone. It's essential to approach trading with the utmost care and diligence, given the market's volatility.
We value your insights and opinions on CHRUSDT
