Chromia CHR Coin Price Prediction🔥 Price on the 4H chart might come at these support area and we might get a potential bounce🔥
Potential bounce areas for Buying 0.2875 and 0.2464
👉 Follow me for More Real Time Opportunities.
Share your Thoughts if you have any?
CHRUSDT trade ideas

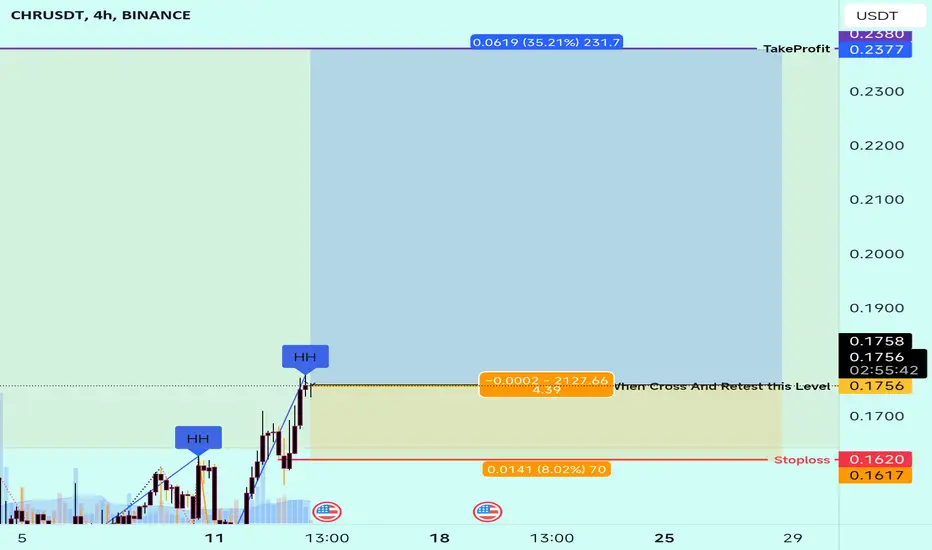
CHRUSDT IDEAUPDATE
Bullish Pennant Breakout Has Already Confirmed Expecting Another 35-40% Bullish Wave In Coming Days✍️
COIN DETAILS
The live price of Chromia is $ 0.287227 per (CHR / USD) with a current market cap of $ 226.17M USD. 24-hour trading volume is $ 10.47M USD. CHR to USD price is updated in real-time. Chromia is +5.48% in the last 24 hours with a circulating supply of 787.43M.

chr still looking strongtrend is up and strong and seems like getting ready for another higher high
bullish pennant breakout has already confirmed with strong bullish candle corrective consolidation is already over expecting another 45 to 50% bullish rally in next days

CHRUSDTHello friends
An excellent situation has reached an important ceiling and from this point we can be rejected and make corrections. Check with yourself.
Good luck

CHR "Riding the Litecoin Wave: A Strong Buy Signal Emerges!"## CHR Coin: Short Fundamental Analysis and Recent News (without AI disclaimer)
**Disclaimer:** I am not able to provide financial advice. This information should not be considered as investment advice. Please consult with a qualified financial advisor before making any investment decisions.
**Short Fundamental Analysis:**
* CHR Coin (CHR) is a native token of the CryptoHero platform, which provides educational and analytical tools for cryptocurrency investors.
* The total supply of CHR is capped at 1 billion tokens.
* CHR can be used to pay for premium subscriptions on the CryptoHero platform, as well as to participate in governance votes.
* CHR has been listed on several cryptocurrency exchanges, including Binance, Huobi, and OKEx.
**Recent News:**
* On January 25, 2024, CryptoHero announced a partnership with Bybit, a leading cryptocurrency exchange.
* On January 31, 2024, CHR was listed on the MEXC Global exchange.
* On February 2, 2024, CHR reached a new all-time high of $0.47.
**Additional Notes:**
* It is important to do your own research before investing in any cryptocurrency.
* CHR is a relatively new cryptocurrency and its price is volatile.
* The cryptocurrency market is highly speculative and there is no guarantee that CHR will increase in value.
**Please note that this information is not financial advice and should not be considered as such.**

$CHR is Bullish on Weekly Timeframe CHR/USDT
NASDAQ:CHR Released a Breakout of the Descending Broadening wedge Pattern on weekly T.F. ⚡📈
A healthy retest may occur, however we're totally Bullish on pattern. 📈
Send it to 40% to 50% pump. 🚀🎯

CHR ANALYSISA range has been formed and the price is approaching the upper range of this range.
Usually, when we have a range, the price tries to move from the bottom to the ceiling, and then from the ceiling to the bottom.
Considering the fresh and unused supply that we have, we are expected to have a reject POI range.
I specified the targets on the chart. I also specified the invalidation level. Closing a 4-hour candle above this level will violate the analysis
For risk management, please don't forget stop loss and capital management
When we reach the first target, save some profit and then change the stop to entry
Comment if you have any questions
Thank You

CHRUSDT.PCHRUSDT.P
1H:
wait for OB
going up from first OB is more probable.
if not, wait for second OB
both OB needs confirmation

CHR/USDT bullish horizon from demand? 🚀CHR Today Analysis💎 Paradisers, it's time to focus on #CHRUSDT, which is currently exhibiting an intriguing shift. The recent conversion of supply into demand zones hints at a strong possibility of an upward move.
💎 #Chromia has recently breached the supply level of $0.1763. If it can maintain its momentum above this newly formed demand level, there’s a high likelihood of a bullish surge targeting the upper supply zone at $0.2179.
💎 However, as we all know, the crypto market is full of surprises and demands flexibility in strategy. Should #CHR face challenges in leveraging its position at the demand level of $0.175, it might be time to reassess our approach.
💎 In such a scenario, we should be prepared for a potential bullish rebound from a lower support level, possibly around $0.1468. A word of caution: breaking below this level could be a signal of a shift towards a bearish trend in the market. 🌴💰

CHRUSDT.PCHRUSDT.P is in bullish trend.
Bearish divergence also shown in RSI.
strong sign of reversal here.
we wait and watch for the breakout of last HL.

CHR SHORT WAIT FOR ENTRY LEVEL hello Traders, here is the full analysis for this pair, let me know in the comment section below if you have any questions, the entry will be taken only if all rules of the strategies will be satisfied. I suggest you keep this pair on your watchlist and see if the rules of your strategy are satisfied. Please also refer to the Important Risk Notice linked below.

Chromia Technical Analysis - 1000%+ Gain Potential What Is Chromia (CHR)?
Chromia is a relational blockchain platform that aims to make it easy for people to build decentralized applications (DApps). It was founded by ChromaWay, a company that has been working on blockchain solutions since 2014 for various sectors such as finance, real estate, gaming and public services. ChromaWay is also known for creating colored coins, which are user-defined assets on a blockchain that can represent anything from currencies to stocks to collectibles.
Chromia’s vision is to enable a new generation of DApps that can scale beyond what is currently possible and address real-world problems in various domains such as gaming, social media, finance, healthcare, education, governance, and more.
Some examples of DApps on Chromia include: My Neighbor Alice (ALICE), a multiplayer blockchain game; LAC PropertyChain, a land registry system; Green Assets Wallet, a platform for green bond verification; Hedget (HGET), a decentralized options protocol; Corite (CO), a music streaming service; Chain of Alliance (COA), a strategy game; Vault12, a digital asset custody solution; Domenation, a blockchain gaming project.
Price Levels to watch
Support Level: $.2091
Break out Zone: $.3195
Target 1: $.5903
Target 2: $.8893
Target 3 (Major Resistance): $1.06
Extended Target 1: $1.86
Extended Target 2: $2.403
Extended Target 3: $3.7785

✴️ Chromia, How Far Up Can It Go? (137% More; 681% Total Growth)I am asking myself one question and I hope this is the answer you are seeking for!
How far up can Chromia (CHRUSDT) go?
The main resistance level for this bullish wave is still the same level at which Crypto traded back in March/April 2022, this was true for Solana, for Bitcoin and is also true for the rest.
👉 This would put CHRUSDT at 0.6364 or 137% profits potential from current price.
Total growth from the August 2023 bottom would amount to 681% to this level.
By the way, this is not written in stone, things can change.
I hope this answers your question.
Thank you for reading.
Namaste.

CHR/USDT Challenges in breaking through the key level area💎 CHR has been a center of focus in the market but has faced challenges in breaking through the supply area. Historically, every time CHR has approached this resistance, it has been met with significant rejections. A successful breach of this resistance, probability could signal a considerable upward movement, moving towards our set target.
💎 However, if CHR remains in consolidation at the supply area without breaking out, there's a risk of facing another rejection, potentially leading back to the support level. If CHR loses this support, a move towards the demand area could be the next course.
💎 In the demand zone, it's crucial for CHR to exhibit a strong recovery and attempt to reclaim the support while aiming to break through the resistance. If CHR fails to respond positively in this area, there's a possibility it might also break down from the demand zone. This could result in a shift back to a bearish trend, with CHR possibly descending towards a stronger support area.


CHR/USDT Potential for a Bull Rally? 👀🚀 CHR Analysis💎 Paradisers, take a closer look at #CHRUSDT as it currently presents a notable setup. Located at a pivotal support level, CHR is indicating the possibility of a bullish trend.
💎 Analyzing #Chromia's recent trajectory, it has skillfully maneuvered through a descending channel, breaking into a positive trend. Presently, CHR is reassessing its support zone around $0.123. A sustained hold above this level would increase the probability of an upward movement, with a target to test the significant supply zone at $0.24.
💎 However, if #CHR encounters difficulty in maintaining its ground above this support level, a strategic shift may be required. This could entail aiming for a bullish recovery from a lower support level at $0.085, signifying a potential change in trading approach.
💎 If #CHR falls below the $0.085 support, it could indicate a change towards bearish market sentiment, possibly leading to a more pronounced downward movement.
💎 Stay vigilant and flexible, Paradisers. Your ParadiseTeam is committed to navigating you through these market shifts, ensuring you have the insights and strategies needed for effective and informed trading decisions.

CHR Bullish CHR here looks good to be longed here.
Successful retest here can send it 50% more up.
Looking good RR (1:14) from here.
Entry 1550-1580
Stoploss 1500-1520
Note: Not a Financial Advice.

CHR Price Surge Alert! The Path to Financial Freedom Starts Here**Short Fundamental Analysis of CHR**
CHR (Chromia) is a Layer-1 blockchain focused on enhancing the performance and scalability of decentralized applications (DApps). It utilizes a unique sharded architecture to divide the network into smaller components, enabling parallel processing and significantly reducing transaction fees.
**Recent News**
* **CHR Integrates with Chainlink Price Feeds:** CHR has integrated Chainlink's decentralized oracle network to provide accurate and tamper-proof price data for its DeFi applications. This integration enhances the security and reliability of CHR-based DeFi protocols.
* **CHR Participates in the Polkadot Parachain Auction:** CHR is competing in the Polkadot parachain auction, aiming to secure a parachain slot and benefit from the Polkadot ecosystem. Gaining a parachain slot would provide CHR with enhanced interoperability and access to Polkadot's broader user base.
* **CHR Announces Partnership with NFT Platform:** CHR has partnered with a major NFT platform to integrate its blockchain and support the creation and trading of NFTs on CHR. This partnership expands CHR's reach into the NFT space and potentially attracts new users.
**Disclaimer**
Please note that cryptocurrency investments are inherently risky and volatile. The past performance of CHR is not necessarily indicative of future results. It is essential to conduct thorough research and carefully assess your risk tolerance before investing in any cryptocurrency.
CHR/USDT - Chromia: Trend Reversal◳◱ On the $CHR/ CRYPTOCAP:USDT chart, the Trend Reversal pattern suggests momentum building up for a significant move. Traders might observe resistance around 0.1458 | 0.162 | 0.1935 and support near 0.1143 | 0.099 | 0.0675. Entering trades at 0.1355 could be strategic, aiming for the next resistance level.
◰◲ General info :
▣ Name: Chromia
▣ Rank: 307
▣ Exchanges: Binance, Kucoin, Bybit, Huobipro, Gateio, Hitbtc
▣ Category/Sector: Infrastructure - Application Development
▣ Overview: Chromia (previously Chromapolis) is a Layer-1 blockchain that is also an Ethereum Virtual Machine (EVM) compatible Layer-2 solution for Ethereum and the Binance Smart Chain. Chromia is designed to achieve three goals: allow dApps to scale to millions of users, improve the user experience of dApps to match those of centralized applications, and create familiar paradigms that allow developers to build secure applications.
◰◲ Technical Metrics :
▣ Mrkt Price: 0.1355 ₮
▣ 24HVol: 2,751,739.737 ₮
▣ 24H Chng: 4.714%
▣ 7-Days Chng: 4.59%
▣ 1-Month Chng: 14.79%
▣ 3-Months Chng: 53.35%
◲◰ Pivot Points - Levels :
◥ Resistance: 0.1458 | 0.162 | 0.1935
◢ Support: 0.1143 | 0.099 | 0.0675
◱◳ Indicators recommendation :
▣ Oscillators: BUY
▣ Moving Averages: STRONG_BUY
◰◲ Technical Indicators Summary : STRONG_BUY
◲◰ Sharpe Ratios :
▣ Last 30D: 1.56
▣ Last 90D: 1.89
▣ Last 1-Y: 0.26
▣ Last 3-Y: 1.00
◲◰ Volatility :
▣ Last 30D: 0.98
▣ Last 90D: 0.83
▣ Last 1-Y: 0.81
▣ Last 3-Y: 1.54
◳◰ Market Sentiment Index :
▣ News sentiment score is N/A
▣ Twitter sentiment score is 0.49 - Bearish
▣ Reddit sentiment score is 0.42 - Bearish
▣ In-depth CHRUSDT technical analysis on Tradingview TA page
▣ What do you think of this analysis? Share your insights and let's discuss in the comments below. Your like, follow and support would be greatly appreciated!
◲ Disclaimer
Please note that the information and publications provided are for informational purposes only and should not be construed as financial, investment, trading, or any other type of advice or recommendation. We encourage you to conduct your own research and consult with a qualified professional before making any financial decisions. The use of the information provided is solely at your own risk.
▣ Welcome to the home of charting big: TradingView
Benefit from a ton of financial analysis features, instruments and data. Have a look around, and if you do choose to go with an upgraded plan, you'll get up to $30.
Discover it here - affiliate link -

CHR Chromia Price PredictionIf you haven`t sold CHR here:
Then you need to know that Binance, along with its CEO 'CZ,' has confessed to federal charges and committed to settling fines amounting to $4.3 billion.
The crypto exchange “admits it engaged in anti-money laundering, unlicensed money transmitting and sanctions violations"!
The question arises: from where will these substantial funds be derived?
One possible source is Binance's Proof-Of-Reserves, which reportedly exceeds 100%.
Among the tokens impacted is CHR.
I've set a short-term price target for CHR at $0.10.
Looking forward to read your opinion about it!

CHR : parallel channel continuesCHR couldn't break out from the channel yet. Buy from the bottom of the channel.

#CHR 1H Full Analysis#CHR 1H Full Analysis..
In My past analysis we made decent profit in short position. now it failed to hold lower box of my past analysis. It'll may go down more. all numbers on chart this is the path numbers.

CHR/USDT Bullish Horizon? 👀 🚀Chromia Today Analysis💎 Paradisers, prepare for a promising opportunity with CHRUSDT. Following its recent rejection at resistance, the asset is gearing up for another breakout attempt, indicating a high probability of a bullish move.
💎 In the past, Cromia has demonstrated a pattern of adhering to a descending trendline, breaking above it to initiate an upward trend. Currently, it is trading within a demand zone and is poised to make another attempt at breaking through the resistance at $.1473. This setup presents a significant chance for a bullish movement. If CHR maintains its upward momentum, it is set to target the supply level of $.1473, with potential to rise further to a higher supply level at $.2407.
💎 For the astute Paradisers, capitalizing on this situation requires precise timing. Identifying the most favorable entry points during this expected rise is crucial, as well as being cautious about entering at the market's peak. Additionally, be prepared for the possibility of a bullish rebound from the support level of $.0997. However, a drop below this support level could signal challenges in maintaining the bullish trend.
💎 In this fluid and ever-changing market environment, strategic foresight and skillful decision-making are paramount. Crafting a comprehensive trading strategy, which encompasses effective money management and a deep understanding of support and resistance levels, is essential for achieving successful trading outcomes. 🌴💰
