CHZ/BTC about to score a goal?Welcome back dearest reader,
If you have been following me you're quite aware i'm very bullish on this project. Fundamentals aside the charts look amazing. And CHZ/BTC is no exception to this!
Deeper dive:
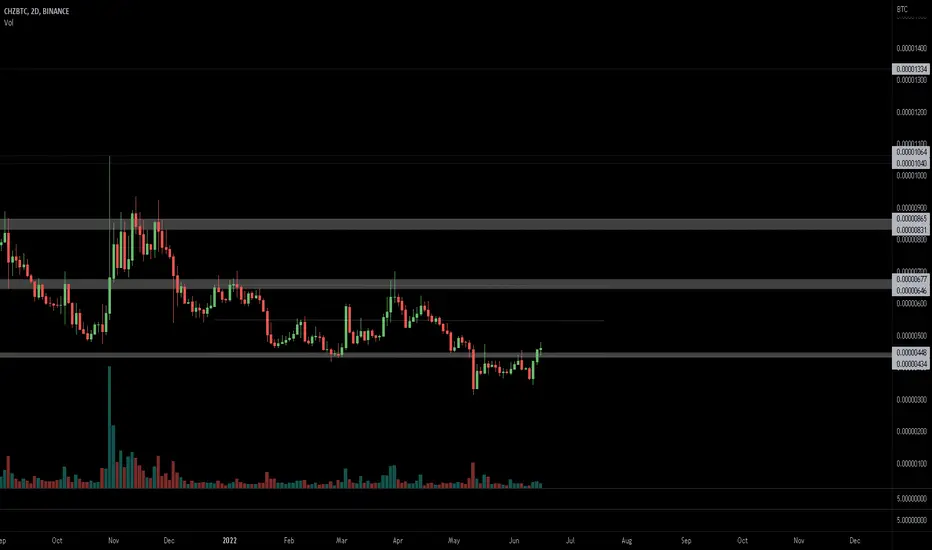
~Trendlines --> As you can see at trendline ''1'' chz has found support going way back to 2021, you can see what happened next. The bars pattern from 2021 has been copied and shows a strong impulsive move going into june. Trendline ''2'' just shows the downtrend we've been in in relation to BTC, i don't expect this to fall below legacy support ''1''.
~MFI --> The Money Flow Index (MFI) is a technical indicator used in financial analysis to measure the strength and momentum of money flowing in and out of a security, typically on a scale from 0 to 100. It combines price and volume data to help traders identify overbought or oversold conditions, often signaling potential reversals in the market. As we can see it's massively oversold and yearning for a reversal ''3''.
~Stochastic RSI --> The Stochastic RSI (Stoch RSI) is a momentum oscillator that combines the Stochastic indicator and the Relative Strength Index (RSI) to measure the RSI's position relative to its recent high-low range. It ranges from 0 to 1 (or 0 to 100 when scaled), helping traders spot overbought or oversold conditions and potential trend shifts with greater sensitivity than the RSI alone. For CHZ also in a massive oversold condition ''4''.
Summary:
~Trend has bottomed and could provide a strong move for CHZ
~MFI and stoch RSI are massively oversold.
Note: This is the CHZ versus BTC chart, this means that even if BTC trades sideways or bottoms CHZ could do well. This would coincide with BTC.D dropping.
Any questions? Ask.
~Rustle
CHZBTC trade ideas

Chiliz Long-Term: Are You With Me?If you've been with me, for the past few weeks or months, or better yet, for the last 2 or 3 years... Some people have been reading since 2017... Are you with me?
If you've been with me, you already know what this means.
Chiliz grew by 3,942% in early 2021. The conditions are developing now in exactly the same way.
Here is what I mean, a bull-market happens every four years, late 2020 would be the equivalent to late 2024, so it is likely that we will see massive growth in early 2025 for the Altcoins BTC pairs. The Tether (USDT) pairs will go for longer as they move with Bitcoin. The BTC pairs will move first.
CHZBTC grew almost 4,000% in 2021 and we have a long-term higher low. After years of bearish action the sellers are exhausted and the market is getting ready to turn. Now, it won't be fast up in a single week or month, we can see weeks of bullish consolidation and some sideways, like many of the pairs we shared last month.
At one point, when the climax is getting close, we get the bull-run; massive growth.
Growth potential is huge.
Thank you for all you do.
Namaste.

✳️ Chiliz Rounded Bottom + Classic Signals (329% Potential)Chiliz is now coming out of a classic rounded bottom pattern, which only happens once support is found. Once support is found by a pair it signals that either a reversal is coming or a challenge of resistance before lower. Both scenarios lead to a higher prices, one long-term the other short-term.
➖ As the rounded bottom reversal pattern is completed, CHZBTC is moving weekly above EMA10 and EMA21 with a strong RSI.
These additional signals also support an upward move... And up we go.
We can expect a bullish wave coming from this pair based on the chart.
Namaste.

CHZ/BTC W"Now is a good opportunity to increase your number of bitcoins."
stoploss close weekly candle below support line

✳️ Chiliz | Simple Signals & Genius Level Explained (525% Pot)These are simple signals.
➖ Chiliz moved above EMA100 in June 2022 and this leads to a bullish wave.
Supported by a rising RSI.
➖ Chiliz is again moving above EMA100 today and this can definitely lead to a new bullish wave.
This move is supported by a very strong RSI and rising volume.
The big difference between December 2023 and June 2022 is the major low.
As CHZBTC is coming out of a major low, growth potential is so much higher, stronger.
The bigger the correction or the stronger the bearish phase is, the proceeding bullish phase potential also becomes higher. This is because all the weak hands have been removed. This is because all doubters are gone. This is because there are no sellers left. Whoever is left standing is here for the long-term. With such a strong base, the next bullish phase can be really strong in order to balance the down wave.
So we have a major lower low. I also showed you some pairs where we have a higher low.
These pairs are normally referred to as being stronger, the ones with the higher lows and this is true in some sense, but when it comes to growth potential, those that hit bottom or hit new lows can grow faster due to the reasons mentioned above.
I like the look on this chart.
Coming out of a major low... Once we hit bottom, the only place left to go is up!
If you are having a trying moment in your life, know that the best is yet to come.
Study hard, work hard, be persistent, keep on trying, over and over, never give up and try again... Invest in yourself, invest in your tools, eat natural clean foods, exercise and life will take care of the rest.
Just build a positive mindset and focus on what you need to do now, take care of what can be done today.
Those things that cannot change, that you cannot affect forget them... Take care of the simple stuff and as you grow new experiences will show up.
We have to earn $1 dollar first before getting to $1 million bucks.
We have to learn the basics, before we get to trade like pros.
Namaste.

#chiliz #chz is approaching the "Great Buy" area#chz 's #btc pair is coming to an end of its correction. This area i marked " blue " is a good buy area if market will not have a crash similar to #ftx or #luna.
NOT FINANCIAL ADVICE.

#CHZ To The MOON A good support at 182 and 185/186 before going to the moon with the target of 250 to 300


#CHZ/BTC - Long - Potential 6.15%Direction: Long
Market: Spot
Risk: 0.25% - 1%
#BTC_CHZ
Exchange: BINANCE
Timeframe: 360
TP1: 0.00000483
Entry: 0.00000456
STOP: 0.00000429
Entry Conditions:
| Broke fast MA
| Consolidation breakout

✳️ Chiliz 150%+ Potential | Trade SignalAs usual, there are just too many opportunities but that is good...
We've been anticipating this bullish wave and it is now taking place... All that remains is to sit back, relax and maximize profits in preparation for what will happen next.
======
ENTRY: 0.00000410 - 0.00000480
TP1: 0.00000544
TP2: 0.00000630
TP3: 0.00000771
TP4: 0.00000888
TP5: 0.00001000
TP6: 0.00001140
STOP: Close daily below 0.00000400
======
This is not financial advice.
Just sharing my thoughts, views, opinion and experiences.
You do the clicking, the buying and selling, you are an adult, we are responsible for our own actions.
I am not responsible for your actions or decisions...
With that said... I am wishing you tons of happiness, love, abundance, health, success and wealth.
Namaste.

$CHZ/#BTC [#Chiliz]: SuperTrend Resistance_Breakout_ConfirmationWe have identified both a Super Trend pattern and a Resistance Breakout on the $CHZ / $BTC chart. Both indicators are signaling a bullish trend, with the Super Trend showing a bullish trend and the Resistance Breakout confirming this trend by showing the price breaking above a key resistance level. Given the alignment of these signals, it may be a good idea to consider entering a long position and targeting higher levels. Our analysis indicates that the key resistance levels are at 0.00000645 | 0.00000681 | 0.00000759 and the major support zones are at 0.00000567 | 0.00000525 | 0.00000447. However, it is important to also consider other factors such as overall market conditions and other technical indicators before making a trade decision.
Technical Metrics :
Current price: 0.0000066
24H Volume: 217.2714 Ƀ
24H Price change: 8.02%
- Pivot Points - Levels :
Resistance: 0.00000645 | 0.00000681 | 0.00000759
Support: 0.00000567 | 0.00000525 | 0.00000447
Indicators recommandation :
Oscillators: SELL
Moving Averages: STRONG_BUY
Technical Indicators Summary : BUY
- In-depth CHZBTC technical analysis on > Tradingview TA page


✳️ Chiliz vs Bitcoin | Very Interesting (66 to 114% Potential)Chiliz has a unique chart compared to other altcoins within the cryptocurrency market... And the price action is pretty crazy.
The strongest bull-market for Chiliz (CHZBTC) happened in 2022.
From May to November we saw a massive bull-run with 425% growth.
The strongest correction ever followed from late November to late December with only two days green... The chart is 100% RED with a 64.10% correction.
30-Dec. a low was hit and this coincide with many altcoins.
So, while the chart is different for most of 2022, the low came in at the same time.
This low happened at the 0.786 Fib. retracement level of the last bullish wave; perfect, this tell us that a bounce/relief rally has high possibilities of taking place.
Today we have a full green candle with the highest volume in several months...
This candle pushed Chiliz above EMA10 while challenging EMA21.
This is a good setup... Low risk, with high potential for rewards.
The targets are mapped on the chart.
66% short-term and more possible depending on how things develop.
We have to track the charts and adapt if things change.
Prepare for the worst, hope for the best.
--
Trade signal... Do your own research.
BUY: 0.00000610 - 0.00000675
TARGET:
1) 0.00000840
2) 0.00000000
3) 0.00001120
4) 0.00001245
5) 0.00001425
STOP: Close weekly below 0.00000590
--
Namaste.

#CHZBTC - Long -Potential 84.21%#CHZBTC
Strategy: Long
Exchange: Multi-Exchange
Account: Spot
Entry mode: Market order in range
Invest: 5%
Exit:
Target 5 : 1222 84.04%
Target 4 : 1003 51.05%
Target 3 : 797 20.03%
Target 2 : 728 9.64%
Target 1 : 695 4.67%
Entry: 0.00000652 ⌁ 0.00000664
Current market price: 662
Stop: 543 (-18.22%)
Technical indicators:
24h Volume: 162.76320431
Satoshis: 662
Fan tokens outperforming so far today. CHZ has shown a massive volume spike breaking out of consolidation into a short term uptrend.
Trade: CHZBTC 05/01/2023 12:52
Account: SPOT
Volume last 24h: 162.76 BTC
Volume in buy range: 2.01 BTC

its world cupWe are almost back!
@Chiliz
@ChilizX
best time to buy $ARG check
@Socios
#CHZ #chzusdt $CHZ #btc

CHZ SHORT CONFLUENCEI would like to give for confluence an extra picture about CHZ/BTC to my last posted CHZ/USD pair
The BTC pair reached a top of the 4H CHANNEL, and backtested the Golden Pocket, so I would like to see some down move.


$CHZdamn this looks to be going to price discovery soon
stoch just about to cross on the weekly
no resistance left so time to make some new levels
looking to enter on a wee pull back

CHZ/BTC TRADE SETUP! A NEW ATH INCOMING!!Hello everyone, if you like the idea, do not forget to support with a like and follow.
Welcome to this CHZ/BTC trade setup.
CHZ looks very bullish in the daily time frame. It is breaking out from the bull flag like structure in the daily time frame. Expecting a 150% pump from here. Buy some here and add more in the dip.
Entry range:- 1000-1100 sats
Target:- 100-150%
SL:- 900 sats
CHZ is a Fan token and world cup is coming in the month on Nov. so we might see some good rally in many fan tokens. Buying a decent bag of CHZ here and will add more in the dip.
If you like this idea then do support it with like and follow.
Also, share your views in the comment section.
Thank You!

4H Bullflag on CHZBTCWell, it seems that VAH of the big range is holding and in 4h time frame, CHZBTC is forming a Bull flag. if this play out the next level of resistance would be the 0.78 retracement fib level which is in the confluence of the April 2021 High. from there one could look for an SFP of the high and trade this pair back towards the VAH of the Range. if it gets accepted back in the VA range one could look for POC of the range for the next level of Support. I am personally not trading this pair but I look at it for getting ideas on the USDT pair.

#CHZ Flashing a 2D UCTS Buy (usually strong)#CHZ
Flashing a 2D UCTS Buy (usually strong)
Waiting for candle close as confirmation
$CHZ/BTC 3D (#BinanceSpot) Falling wedge breakout and retestChiliz is showing some bullish strength after regaining 200MA, a bounce back to 50MA would make sense.
Current Price= 0.00000479
Buy Entry= 0.00000480 - 0.00000436
Take Profit= 0.00000595 | 0.00000742 | 0.00000870
Stop Loss= 0.00000360
Risk/Reward= 1:1.4 | 1:2.9 | 1:4.2
Expected Profit= +29.92% | +62.02% | +89.97%
Possible Loss= -21.40%
Fib. Retracement= 0.382 | 0.618 | 0.786
Margin Leverage= 1x
Estimated Gain-time= 6 months
Tags: #CHZ #CHZBTC #Socios #FanToken #Sport #eSport #CEx #BC #NFT #Payment
Websites: chiliz.com chiliz.net socios.com
Contracts:
#ChilizChain CHZ-ED
#ERC20 0x3506424f91fd33084466f402d5d97f05f8e3b4af
#BEP2 CHZ-ECD

CHZ to BTC breaking downsloping trendline dating back to Nov 1stCHZ to BTC breaking downsloping trendline dating back to november first, reclaiming major emas, set to outperform bitcoin when bitcoin is looking strong. Comparing to btc rather than just the usd provides advantages not seen by most traders, but valuable nonetheless as market makers program their bots around btc pairs as well. Oscillators showing strength here, wyckoffian term "jump across the creek" about to play out here. Remember, you want to enter on the right of downsloping trendlines , as these are areas where downward pressure has been relieved and price action can generate fast and profitable returns.
