#CHZ #CHZUSDT
is breaking out of a falling wedge pattern on the 1-day timeframe.
This is a bullish sign, and if the breakout is successful, we could see a rally of up to 100%.
CHZUST trade ideas

second testmy second idea. just follow me and earn. I try to find big buys according to cluster analysis

CHZ quick retestSo, today 06.11.2023 probably there will be an inverse hammer at the top of the trend.
The RSI showns bearish signals because both lines are above the 80%.
The resistance is around the top of the ichimoku cloud. if it goes below, certainly will go to the lower line of ichimoku.
Probably within 2 weeks the price of chz will decrease or remain stable and then a huge bullish trend expected, but first of all wait for the rsi and the cloud.
Share your idea, and please note that these analysis are only for myself to check my thinking at that period.

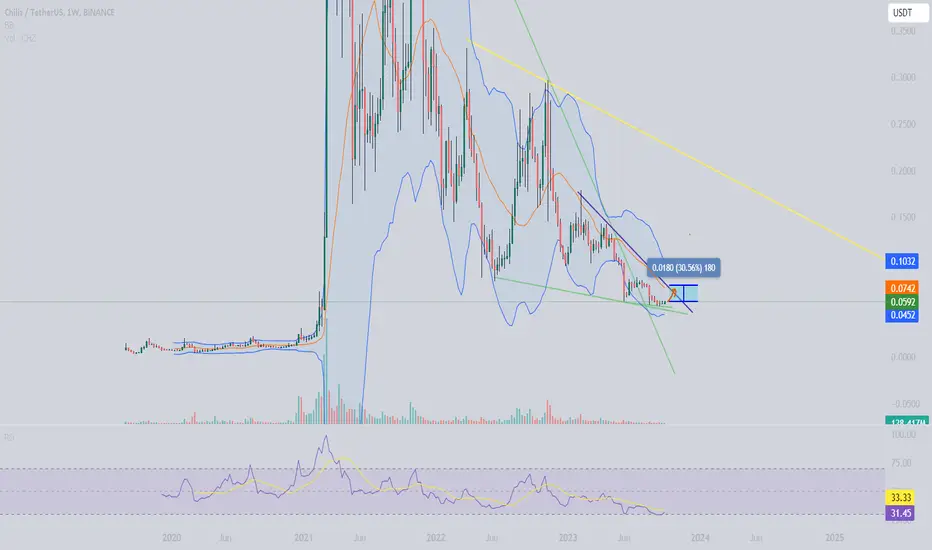
CHZ: Fibo 0.5 and Trend Line Confirmation !
Title: "CHZ: Fibonacci Retest and Trend Line Confirmation Point to Bullish Trajectory!"
🚀 Hey Crypto Enthusiasts,
Exciting developments in the CHZ (Chiliz) chart as it navigates a crucial point on the global Fibonacci grid, signaling potential bullish momentum. Recent events include a vital retest of the 0.5 Fibonacci level and a confirming retest of the secret upper trend line. With these factors in play, the first target is set at $0.3. Let's dive into the details. 📈🔄
CHZ's Fibonacci Retest and Trend Line Confirmation:
Global Fibonacci Perspective: When stretching the Fibonacci grid from the beginning to the highest point, CHZ has recently retested the key 0.5 level, a pivotal point in understanding potential bullish movements.
Secret Upper Trend Line Retest: Adding to the bullish narrative, CHZ has also conducted a retest of the secret upper trend line, further validating the potential for an upward trajectory.
Key Price Levels:
0.5 Fibonacci Retest Confirmation: Observing the confirmation of the recent retest at the 0.5 Fibonacci level, highlighting its significance in the broader market structure.
First Target: $0.3: With the confirmation of both the Fibonacci retest and trend line, the first target is set at $0.3, representing the initial milestone in a potential bullish cycle.
Trading Strategy:
Confirmation and Entry: Await confirmation of both the Fibonacci retest and trend line retest, ensuring they align with supportive price action and volume.
Strategic Entry Points: Plan entry points strategically based on confirmed patterns, considering your risk tolerance and trading strategy.
Risk Management: Implement sound risk management practices, including the use of stop-loss orders, to navigate market uncertainties.
Conclusion:
CHZ's recent actions on the global Fibonacci scale and the confirming trend line retest paint a bullish picture for the asset. With the first target set at $0.3, traders have an exciting opportunity to capitalize on potential upward momentum.
Wishing you prosperous trades as CHZ charts its course!
❗️Get my 3 crypto trading indicators for FREE❗️
Link below🔑

#CHZ - still good price to buy#CHZ
It has a lot of interesting and strong resistance levels, that after breaking them can stand as a good support level.
I have been writing about this coin since November 10. And in this TA I decided to write more detailed analysis.
I expect that the coin will pump near days and will reach the target at 0.12$ (n.1) that you can see on the chart.
After that important to see to the coin’s strength, if the price is pushed hard, then probably it will continue its uptrend to another target at 0.1521 - 0.1614$, where we will definitely see bear reaction (n.2)
If the uptrend is weak, then we may see the correction already at 0.12$ where the retest of 0.10145$ level is OK for the Bull continuation. (N.3)
If the coin comes to the targets I was mentioning about above, or 0.1521 - 0.1614$ and it starts to consolidate there, then high probably that the coin will continue its bullish trend to other higher targets at 0.2116 - 0.24$ (n.4)
This bullish trend invalidates, if we see that the coin is loosing its support at 0.1521$ in this case it may come to the lower targets. (N.5)
All other important levels you can see on the chart

CHZ Chiliz Price TargetBinance, along with its CEO 'CZ,' has confessed to federal charges and committed to settling fines amounting to $4.3 billion.
The crypto exchange “admits it engaged in anti-money laundering, unlicensed money transmitting and sanctions violations"!
The question arises: from where will these substantial funds be derived?
One possible source is Binance's Proof-Of-Reserves, which reportedly exceeds 100%.
Among the tokens impacted is CHZ.
I've set a short-term price target for CHZ Chiliz at $0.055.
Looking forward to read your opinion about it!

💡Trade Idea #CHZ/USD:Despite the current downtrend, #Chiliz exhibits a bullish market structure. Anticipating a breakout above the daily resistance level for a potential upward movement.

CHZ/USDT bullish ride? 👀 🚀 CHZ Today analysis💎 Paradisers, prepare for a promising opportunity with CHZUSDT, as it has recently transformed resistance into support, indicating a strong likelihood of a bullish trajectory.
💎CHZ has consistently followed a descending channel, breaking above it to initiate an upward trend. After surpassing the resistance level at .6515, it successfully captured buying interest, further breaking through the second resistance level at .7497. Currently, this second resistance level has evolved into a support zone, enhancing the probability of a continued bullish movement.
💎 Should the price fail to honor the current support level at .7497, we anticipate a bullish strategy from the demand level. A breach below this point could lead to a significant drop towards the next support level. This scenario underscores the importance of staying alert and responsive to market dynamics.
💎 A key milestone to watch for is the breach of the third resistance level at .8464. Such a development would likely signal the commencement of the next bullish phase, presenting a strategic opportunity for market participants. As always, vigilance and timely action are crucial in navigating these market shifts.

CHZ - holding strong about TP1 but facing resistance soonCHZ - Ichimoku 3D is near, but if TP1 is holding strong and offers bounce, we might see next target in play.

✴️ Chiliz Grew 24,700% Just Two Years Ago...Considering the fact that Chiliz (CHZUSDT) grew by an astonishing 24,700% in 2021, just two years ago, it is more than possible to see a bullish wave extending beyond 1,800% and hitting even 3,000% or many times more.
The last bull market lasted 364 days after the double bottom (higher low).
This time around we have a lower low instead.
364 Days would put us at early October 2024.
This is just one method we use to calculate potential tops for the next cycle but we don't know how accurate it will be. As we continue to go through hundreds of charts we will come up with more and varied methods that will give us a better picture.
When we have a set of say 3-5 different methods, plot them all together and get an average date we can calculate the next market cycle top with a high level of accuracy.
This isn't really important though, what really matters is to buy low to later sell high and develop a plan to maximize profits when selling the target, the rest is just a waiting game.
I hope you can join me in the coming months and years... Cryptocurrency has lots to offer.
Namaste.

Weekly chart. Mid term $chz prediction.Possible 30% gainChz getting beat down for some time. But soccer fans might emerge to save this one shortly. Expecting 30% gains. If it is able to break out of the triangle and retest then more gains will follow!
CHZ - Correction coming soonThe impulsive wave that began in mid-October is losing steam.
My count considers that the current grind to the upside is an ending diagonal for blue wave 5, in green waves I to V.
RSI divergence is also showing up.
The low 0.06´s are good targets for the pullback, but let´s wait for further price action.

chzThere is a resistance zone in this green and red box that I am waiting for an upward breakout. The numbers that can be seen are determined by zooming out.

CHZ Next Support & ResistanceCHZ Next Support & Resistance
0.04898
0.06565
0.086763412
0.117089022
0.139327525

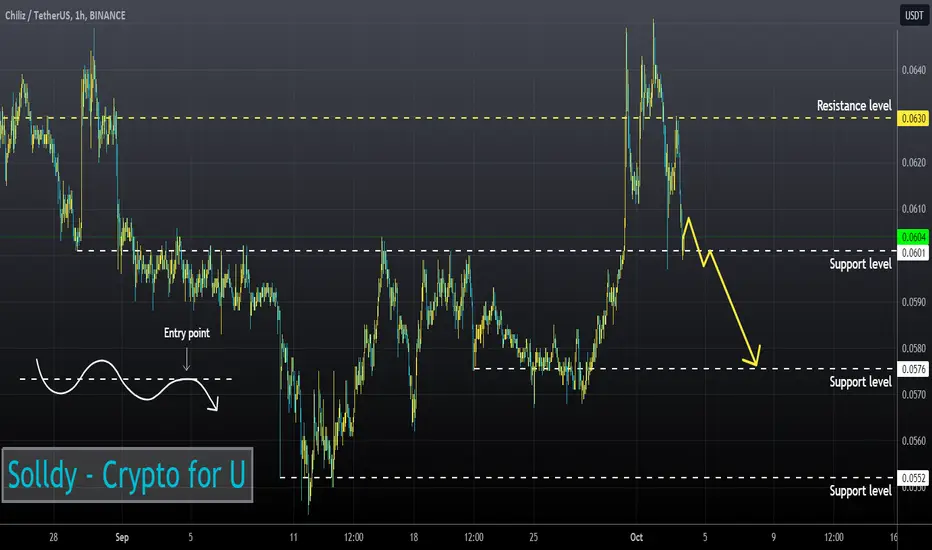
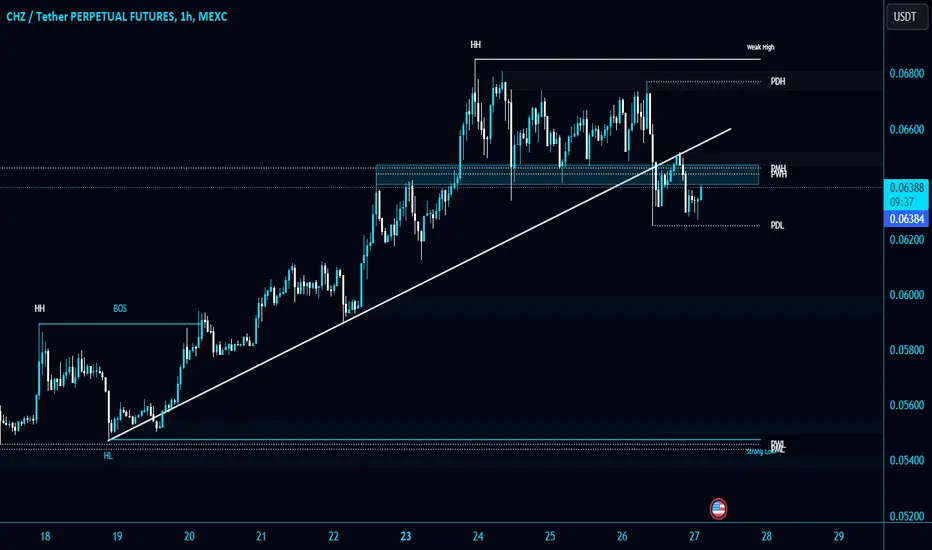
#CHZ/USDT breaks the Trendline and strong support zones #CHZ/USDT breaks the Trendline and strong support zones and looking heavy in 1-Hour TF!
FWB:CHZ needs to reclaim these levels to gain the bullish momentum. So far, looking good for short position.
The local support level is PDL $0.0625.
Chiliz longChiliz broke trough the descending trendline. Asset broke trough the resistance level. Bullish movement to resistance level at 0.0644 is expected to happen.

CHZ/USDTinteresting chart on the LOG, we have a bullish reversal pattern happening try buy support or set alert to trade the breakout

ChzusdtLooks like its broken out of long term downtrend
Double bottom on obv weekly
~100% target if this macro fib holds..

CHZ NEW VOLUMEThank you for reading our update. Please remember that this is not advice for trading.
CHZ Looks to have a new uptrend volume
This coin can have on this point a historical bottom point.

📈📊 #ChartPattern Alert! 📈📊 📈 Falling Wedge 📈📈 What is a Falling Wedge? The Falling Wedge is a bullish chart pattern characterized by two converging trendlines, with the lower trendline sloping upward more than the upper trendline. It typically signals a potential bullish reversal, with the price likely to break upward after the wedge pattern.
📈 How to Identify:
Draw a trendline connecting at least two higher highs (upper trendline).
Draw another trendline connecting at least two higher lows (lower trendline).
📈 What it Signals: The Falling Wedge suggests a potential bullish reversal, with buyers gaining strength as the price reaches higher lows within the wedge. It often forms during downtrends and can precede a significant price move to the upside.
📈 Trade Strategy:
Consider buying when the price breaks above the upper trendline of the Falling Wedge.
Set profit targets based on the pattern's height added to the breakout point.
Implement a stop-loss to manage risk in case of a false breakout.
Remember to validate your analysis with other technical indicators and conduct thorough research before making any trading decisions. Happy charting and trading! 📈💹


CHZ/USDT Easy AnalyseI think Chiliz will break this resistence and price maybe go far to 0.17$ if break 0.07

CHZUSD ❕ descending structure50EMA broke down through 200EMA (30m TF)
The price chart has formed a local descending structure.
I expect the decline to continue.