XJO - ASX200 a drop bears dream.XJO - ASX200 a drop bears dream.
Crikey!
A long term take on the Index down under.
Undeniably having been in a multi decade bull market, technically, future times appear tougher.
Divergence in the overbought area of the wave oscillator, coupled with an ominous Doom spike back at the GFC March lows of 2009.
The father of finance, Fibonacci, projects a downside golden ratio target of 2016.
Conclusion - If you're long on Aussie stocks, ya stuffed mate! OI.
AUSTRALIA200CFD trade ideas


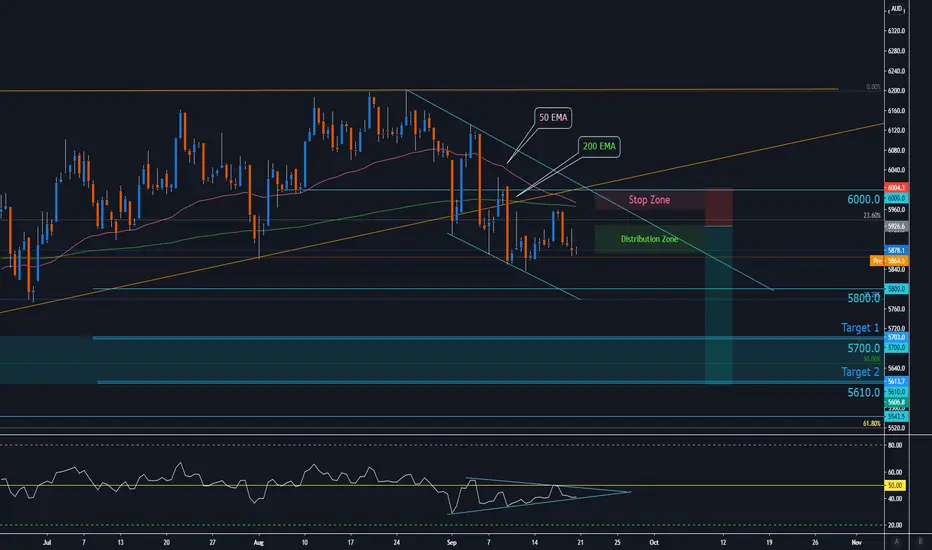
ASX200 Sighting June Lows – 5800Hello Fellow Trader!
The US500 and Nasdaq continued their falls and finishing in the red on Friday. The ASX200 also had two consecutive lower low days breaking slicing below 6000 to finish the week also in the red.
We could see slight recovery back into the 6000 which is key for the advance, or rejection indicating falls the ASX200 has not seen since June.
Key Points:
- Price holding below the 200 EMA
- Price holding below the 50 EMA
- Fibonacci 50% support cluster with target 1 (April Low – June High)
- Price holding above the 50 EMA
- RSI could break trend and range simultaneously for momentum
Key Levels:
Support – 5800, 5700, 5610
Resistance – 200 EMA, 50 EMA, 6000
Entry Zone:
Optimal entry provides the greatest reward to risk ratio while supporting entry is a zone for reversal signals.
Optimal Entry – 5925
Supporting Entry – 5890
Candle Reversals for entry
- Bearish Shooting Star
- Bearish Engulfing
- Bearish Dark Cloud Cover
The Risk:
As traders, it is your job to mitigate the risk and only trade structures that provide high probability and great reward to risk ratios.
If you are not comfortable with defined exit levels, experiment with Moving Averages to help set solid exit rules to protect your capital.
IF: Price breaks above level 6000 and violates 200 EMA– this would suggest the structure is not in our favour and would be wise to reduce exposure or close the trade until a solid signal gives us reasons to re-enter.
Reward / Reward Targets:
Optimal Entry 5925 – Target 1 5700 = 3x Reward to Risk
Optimal Entry 5925 – Target 2 5610 = 4x Reward to Risk
Supporting Entry 5890– Target 1 5700 = 1.5x Reward to Risk
Supporting Entry 5890 – Target 2 5610 = 2.2x Reward to Risk
NOT OVER YET, ONE MORE DAY TO GO & PROTECT 5836 $XJO On 26 August 2020,
$XJO was at 6161 and I said we will pull back to the moving averages and a big breakout will come...
The 2 day chart have shown us we have broke down to the down side.
This week, I said we need to close above 5836 on the weekly to stay bullish.
We did that.
However, it is not over yet.
The 2 day candlesticks DID NOT CLOSE this week , it will close next Monday and start a new candlestick on Tuesday 22/09/2020.
Furthermore, we have closed below all three moving averages 20,50,200 and from the past more downside will come in the coming days/weeks.
Therefore,
Monday will be a very important trading day,
Long - Close above 5919
Short - Close below 5836
If close below 5836, the 0.50 Fibonacci Retracement level is my next support....

Set up for my first short position using indictors Using this script indictors in this oder to establish my first short position. Let me know your thoughts.
UHLMA100 gives a larger bear market indication
TDF MA sows first sign on short term trend change below its zero line.
ASO 10 0 shows the sentiment reading
UHLMA26 shows the shorter term trend crossing over into negative territory (white crosses below yellow line)
Buysellsignal 20 works similar to a TD sequential to help with enter exits
All public library scripts show be visible to see


Long Term TrendA country sleepwalking into desolation. ----Those who would give up essential Liberty, to purchase a little temporary Safety, deserve neither Liberty nor Safety.-----

The ASX200 may be setting to head down the slippery slope lowerThe ASX200 is hovering at a key level at 5850, that if broken, will trigger some bears into action. Recent pressure from sellers has picked up off the 6200 area and the uptrend from march has been broken. Many feel that a selloff and reset is on the cards and warranted so it may soon come true.
-------------------------------------------------------------
WE TRADE WHAT WE TEACH
Check out our recent Live Streams from our profile page!!
-------------------------------------------------------------
** If you enjoy our free content, please support and follow our profile, by hitting the Follow button to get further high quality ideas. **
** If you are following our ideas any comments and likes are most welcome and will be greatly appreciated **
** With quality alerts and correct Risk Management, you can learn consistency and grow your account **
** With quality portfolio management and defined risk levels to help your account grow and achieve steady profit targets while increasing your trading edge. **

XJO Re-tested long term trend We've seen price action since the March drop push us back into the channel, it would be nice to see a bounce from the 1M trendline thats provided TL support since '09.
Maybe a bounce from here will get us through the 6200 resistance thats been on our plate since June.
Let's see what happens.

#XJO $XJO Chart - analysis where from Here#XJO $XJO Chart - analysis where from Here
XJO as abbreviation means "S&P/ASX 200 (Australian Securities Exchange )". Q: A: What is shorthand of S&P/ASX 200 (Australian Securities Exchange )? The most common shorthand of "S&P/ASX 200 (Australian Securities Exchange )" is XJO.

ASX200 Time to pay attention to the weekly close 5836. $XJOIf ASX200 close below last week's low of 5836 tomorrow (Friday 18/09/2020), It is time to reduce position size and risk because It is likely that we will see more selling in the coming week.


XJO or SP200 about to decide where to go🚨🥵🚨AS i mentioned last time that XJO was fighting the 200MA that was aligned with the 0.618 golden fib, apparently it lost the battle and decided to consolidate below it.
But does t look like it is going to make one major decision which will be written down in history? lets dig deep and analyze.
XJO after failing to conquer the 200MA has been shy and it even failed its 50MA and now it is fighting to stay close to the 6k level.
However, considering the massive selloffs on Wall Street, I think it is about to make one major move. Looking at that chart it is almost writing a curve as if it want to fall below towards the 5700 which is a strong support.
I think we may see the price testing that level in coming days and if that level fail, my friends, I see XJO going deep down.
However, not all hope is lost, at the moment it looks like it is in massive consolidation zone which, if it holds , can be considered as a huge bull flag.
Most short term indicators like PSAR, LSMA, QLSMA look bearish so far.
As I said last time, this may not be the best time to buy, better wait for the market direction then enter the market. But for those who ride the waves, they may find it interesting to but the support and sell the resistance.
I will keep you posted of any change in this market. Stay safe. Dont forget to smack the likes.
XTF


Price breakout important intraday levelThis market has produced some incredibly erratic Price Action in recent sessions with huge swings higher and lower
Price now breakout the intraday resistance and retest this level. if new support can reject Price we could see price quickly move into the resistance around 6078.78
From there the trend could look to continue and it could begin once again forming bullish trading opportunities.
Thanks for your like and support...


The few sectors preventing the ASX from slumping throughout Aug(SEE prior "Idea" for Sector Indices vs ASX All Ordinaries Index showing earlier deterioration of the market throughout August ) Here are the few sectors preventing the ASX from slumping throughout August 2020: which are the midcaps of the ASX Midcap 50 Index, and including Technology XTX, Consumer Discretionary XDJ, Real Estate XRE and Industrials XNJ.

The ASX200 is standing on the edge and looking over the cliffThe ASX200 is having a rough day as sellers beat up the bulls. Price has broken the uptrend but is holding above key support for now. A break down below 5850 and we may have a small problem but it will bring some volatility and good shorting opportunities.
-------------------------------------------------------------
WE TRADE WHAT WE TEACH
Check out our recent Live Streams from our profile page!!
-------------------------------------------------------------
** If you enjoy our free content, please support and follow our profile, by hitting the Follow button to get further high quality ideas. **
** If you are following our ideas any comments and likes are most welcome and will be greatly appreciated **
** With quality alerts and correct Risk Management, you can learn consistency and grow your account **
** With quality portfolio management and defined risk levels to help your account grow and achieve steady profit targets while increasing your trading edge. **
