AUSTRALIA200CFD trade ideas

#BearishBat #Australia 200 #Index #ShortWe have a bearish bat pattern near-completion on the 60 minute Australian 200 index.
Entry @pprox 6038.5
S.L. @pprox 6069.2
T.P. 1 @pprox 5984.4
T.P. 2 @pprox 5929.2


XJO aka ASX200 closing with a bearish signal 🚨👹👿🚨ASX200 closes the week below the uptrend line. Is this going to be the end of the bull market as we know it and be the the start of a long waited bear market? Lets dig deep and analyze.
XJO aka ASX200 has been struggling for the last few days to maintain the upward momentum. However, the chart shows a weak and tired bullish actions. But what are the indicators saying? Lets compare bulls and bears case.
Bulls:
Daily and weekly Momentum positives
Price above 50MA
Bears:
Price below 200MA
Price below historic resistance at 5960
Price below the uptrend line
QLSMA pointing down
Price below Golden fib
To me bears are back in action. In order to keep the bullish sentiment, bulls need to take back the lost uptrend line and push quickly towards the 0.618 fib. This will make the recent days price actions like a pennant and the upward move can lead to higher price towards the 7k.
I will keep an eye on this index for you so that you do not miss any single price action.
Stay safe and have a great weekend. Dont miss my stock of the week episode in Sunday. And keep smashing the likes.

AUS200 Accumulation At Key levelHello Trader! AUS200 index is in accumulation at 0.618% Fibonacci Level which is a Key level in Fibonacci retracement. If it breaks this pattern upside it will hit 0.786% Fibonacci Level and if it break it downside it will hit the next support area.
Don't Forget to Hit the like button if you find it helpful and informative and follow to catch every wave correctly and remember to share ideas.

XJO - Weekly closeI am hoping for a weekly close that the W formation neckline. Hopefully a drop tomorrow around -0.60%. Before the next couple of weeks we can see a push higher to previous highs. Will update as the environment changes, DYOR, all IMO.

ASX 200 Index support and resistance price chart analysisThe Index spends the end of last week and early this week attempting to break out at the major resistance level at 6065.00 but failed. In yesterday's session, we saw the Index fell to the critical support level at 5919.70 but managed to hold and closed the trading session above this significant point.
Today's opening trades, we saw the Index bounced off at 5919.70 and headed towards 5976.20 at the time of writing. The Index could continue to retest the major resistance at 6065.00 if it holds 5976.20
Major critical price points to watch are estimated at 6065.00 resistance and 5919.70 support.

AUSTRALIA 200 SELLStock market crash.
Everything is in the price chart, sooner economic media claim that the reason of the crash is 2nd wave of coronavirus but it's not, it has technical reason.
You can predict what news will be released by predicting the direction of market trend.
If you found this analysis useful, please like it and share it with others so they can benefit from it too.


Trade is still on !!!Reversal can still happen from this resistance !!!
Place your Stop Loss just slightly above this resitance....


NenStar Pattern FormationNenStar Pattern Formed in AUS200
TP 1 -- 5900.13
TP 2 -- 5918.03
SL -- 6199.72

AUS200 ShortPotential Short for AUS200 based on trendline and support and resistance.
Wait for a strong impulse to the downside to enter using a 4HR entry.
Use proper risk and be reactive to the market not proactive.

AU200Welcome to this analysis on AU200.
Australian stocks have been in a bullish trend since March.
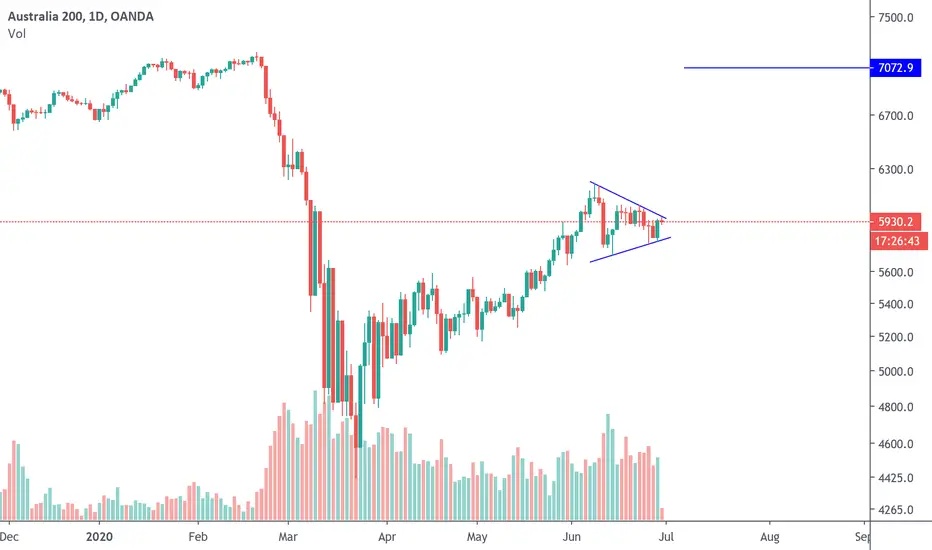
Looking at the 12HR chart, It looks like it just broke out of a month-long symmetrical triangle consolidation which should act as a continuation pattern in this case.
The target of the pattern is around 6380$ as long as the price holds above the support of the pattern.
There is a long term horizontal resistance and an Order Block around the target zone in the 6300$ to 6400$ which has confluence with the patterns target. The price can get to those levels as long as it stays above 5900$.
This trade idea has 4.5 Rewards to the Risk ratio.
Good luck trading.

XJO - Retrace, impulseI am unsure if we will see a nice retrace to the 0.618 FIB before we see one final push to a double bottom, creating a M formation on the weekly before we can hopefully see a great start to the 2020 FY. I will be watching the environment around the 0.618 FIB to see if it will continue up or impulse down for a new leg. A market scare will be needed to see a strong impulse down.

ASX trading in a Dual channel patternWatch out for movement outside the lower channel to hit the top channel or if breakdown from the lower trendline!
Disclaimer: Not an advice to buy or Sell

XJO - ASX 200 at the bottom of trend channel - decision timeOverall XJO pullback to trend channel and 50% Fib complete, looking for upside bounce soon. indicators turning up from right on the 34EMA.
Let''s look to see where the US markets head and take us and hopefully we can hold this zone.

XJOWe have been following America's markets, started to break down, but have caught the last FIB, bounced straight off it. I am hoping for a close above this, and hope we can maintain above for the next couple of days. If we can I see us bullish in the new year. DYOR, IMO

#Australia 200 #Long #Bullish #Shark #PatternBullish shark pattern near completion on the Australia 200 index.
T.P.1) R/R = 1.35%
T.P.2) R/R = 2.4%

AUSTRALIA200's next BIG SHORT is on the wayThis indicies has a high potential to make a down move/Wave/ on more time,from the technical side. On the fundamental side Covid-19 pandemic 2nd wave is about to start around the world.
Anyway I'd like to suggest you a short position on this instrument, of course you need a risk to reward ratio and risk percentage. Good Luck

Stock of the week: ASX:XJO aka ASX200Today`s stock of the week episode will explore index ASX:XJO. I chose not to analyse one single stock cause my last post about XJO, I had informed you that I will keep you posted if anything price-action wise changes. Things have quickly escalated that is why I am going to analyse this index for you. Lets analyze.
The ASX200 has been on the uptrend since the early March 2020. The bulls have been on fire chasing bears all the way from the abyss to the 0.618fib(6128$). But the bears were back in the game since the 0.618fib did not break and they want to play it hard and kick the bulls` butts. Below is the technical analysis and what we can deduce from it.
- Recent retries by the bulls got stopped out by the 5969 resistance line. you can see 3 indecision candles that started a warning sign showing that bulls dint have enough juice.
- The LSMA looks downward which is not a good sign for bulls
- The daily velocity turned negative
- The bulls are still in good shape cause the uptrend line is not broken yet.
Below is what I think would happen if the critical point( confluence uptrend line and 0.5fib) on the chart is broken:
- my first target will be the 50 SMA (around 5600$) where a bounce back can be anticipated
- if first target broken second target is range 5460 to 5500 where ascending triangle broke to the upside and where the 0.382 fib is located.
At the moment, I am not bearish yet but if the uptrend line breaks and bulls dont reclaim it quickly. I may start closing most of my long positions held since late March and wait for clear opportunities before entering the market again.
I will keep you updated if anything changes all along next week.
keep smashing the likes and have profitable trades next week.
XTF

$AUS200 let the game begin As we recall the first breakout lower from stock market tops just started from Australia. AUS200 now alongside DJIA is the first one to nearly break rising wedge resistance and lead orchestrated reversal lower.
