GER40 Trade LogTrade Setup (30/10/2024) - GER40 Short on 1H FVG
1. Market context: Anticipating a downward move in GER40 driven by poor earnings reports, which could increase bearish momentum.
2. Setup: Short position within the 1-hour Fair Value Gap (FVG) acting as a supply zone.
3. Entry strategy:
- Target: 1:2 RRR.
- Risk: 1% of account.
- Entry confirmation: Wait for price to retrace into the 1H FVG and show signs of rejection (e.g., bearish engulfing candle or other reversal pattern) before entering short.
4. Stop-loss and take-profit:
- Place stop-loss above the FVG to protect against a reversal.
- Set take-profit at twice the distance of the stop-loss for a 1:2 RRR.
5. Additional considerations:
- Be mindful of further earnings announcements that could influence volatility.
- Monitor European market sentiment, as additional poor earnings could support the short bias.
This setup leverages the 1H FVG as an entry zone, with bad earnings acting as a catalyst for the anticipated move downward.
GERMANY40CFD trade ideas

GER40 Trade LogTrade Setup (29/10/2024) - GER40 Buy in 30-Minute FVG
1. Setup: Despite recent volatility, the 30-minute FVG presents a buy opportunity within a defined support zone.
2. Entry Strategy:
- Target: 1:2 RRR.
- Risk: 1% of account.
- Stop-Loss: Below the 30-minute FVG, respecting recent price lows to limit downside risk.
- Entry Confirmation: Look for signs of stabilization or a bullish reversal within the FVG zone before entering.
3. Trade Management:
- Consider potential re-entries within the FVG if initial entry is triggered and price action aligns with the broader trend.
- Be cautious of any new high-impact data affecting European indices, as GER40 remains sensitive to market sentiment shifts.
4. Note: With recent losses, maintaining discipline on risk management here is key. Avoid over-leveraging, and wait for clear bullish signs in the FVG before committing further.

DAX H4 | Potential bullish bounce off 61.8% Fibonacci supportDAX (GER30) is falling towards a pullback support and could potentially bounce off this level to climb higher.
Buy entry is at 19,412.53 which is a pullback support that aligns close to the 61.8% Fibonacci retracement level.
Stop loss is at 19,300.00 which is a level that lies underneath an overlap support and the 50.0% Fibonacci retracement level.
Take profit is at 19,624.78 which is a swing-high resistance.
High Risk Investment Warning
Trading Forex/CFDs on margin carries a high level of risk and may not be suitable for all investors. Leverage can work against you.
Stratos Markets Limited (www.fxcm.com):
CFDs are complex instruments and come with a high risk of losing money rapidly due to leverage. 64% of retail investor accounts lose money when trading CFDs with this provider. You should consider whether you understand how CFDs work and whether you can afford to take the high risk of losing your money.
Stratos Europe Ltd (www.fxcm.com):
CFDs are complex instruments and come with a high risk of losing money rapidly due to leverage. 66% of retail investor accounts lose money when trading CFDs with this provider. You should consider whether you understand how CFDs work and whether you can afford to take the high risk of losing your money.
Stratos Trading Pty. Limited (www.fxcm.com):
Trading FX/CFDs carries significant risks. FXCM AU (AFSL 309763), please read the Financial Services Guide, Product Disclosure Statement, Target Market Determination and Terms of Business at www.fxcm.com
Stratos Global LLC (www.fxcm.com):
Losses can exceed deposits.
Please be advised that the information presented on TradingView is provided to FXCM (‘Company’, ‘we’) by a third-party provider (‘TFA Global Pte Ltd’). Please be reminded that you are solely responsible for the trading decisions on your account. There is a very high degree of risk involved in trading. Any information and/or content is intended entirely for research, educational and informational purposes only and does not constitute investment or consultation advice or investment strategy. The information is not tailored to the investment needs of any specific person and therefore does not involve a consideration of any of the investment objectives, financial situation or needs of any viewer that may receive it. Kindly also note that past performance is not a reliable indicator of future results. Actual results may differ materially from those anticipated in forward-looking or past performance statements. We assume no liability as to the accuracy or completeness of any of the information and/or content provided herein and the Company cannot be held responsible for any omission, mistake nor for any loss or damage including without limitation to any loss of profit which may arise from reliance on any information supplied by TFA Global Pte Ltd.
The speaker(s) is neither an employee, agent nor representative of FXCM and is therefore acting independently. The opinions given are their own, constitute general market commentary, and do not constitute the opinion or advice of FXCM or any form of personal or investment advice. FXCM neither endorses nor guarantees offerings of third-party speakers, nor is FXCM responsible for the content, veracity or opinions of third-party speakers, presenters or participants.

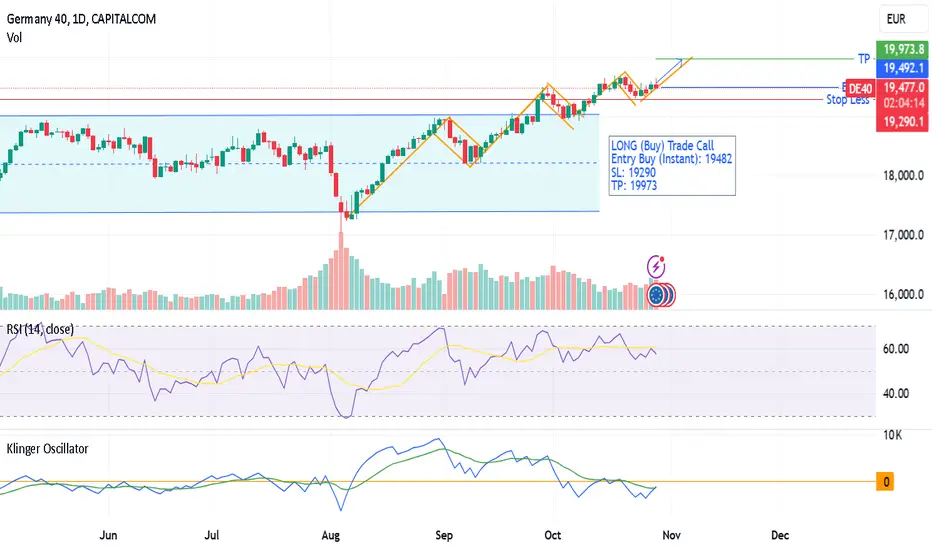
DE40 - Germany 40 Index - LONG (Buy) Trade CallOn daily TF, price is consecutively making HH and HL in a bull run. However, in Flag & Pole Pattern, every next pole is getting shorter. Therefore, down the line trend reversal is on the card in 2 weeks' time. Nevertheless, for the time being trend is bullish as RSI indicator is above 50. Klinger Volume Oscillator is just below Zero but its oscillator (blue line) is about to cross trigger line (green line), which indicates a likely bull run continuation.
My Trading values are depicting below:-
LONG (Buy) Trade Call
Entry Buy (Instant): 19482
SL: 19290
TP: 19973
GER40 Trade Log### Trade Setup (29/10/2024) - GER40 Long Re-Entry in 30-Minute FVG
1. Initial Long Entry in 30-Minute FVG:
- Target: 1:2 RRR.
- Risk: 1% of account per entry.
- Stop-Loss: Below the 30-minute FVG.
- Entry Signal: Wait for a retracement into the 30-minute FVG with a bullish confirmation before entering.
2. Re-Entry Strategy:
- If the price respects the 30-minute FVG and shows continued bullish momentum, re-enter with additional positions.
- Each re-entry maintains a 1:2 RRR with independent stop-loss placement.
- Total cumulative risk for all entries should not exceed 5% of the account to manage exposure.
### Strategy
- Multi-timeframe alignment using the 30-minute FVG as a demand zone for re-entries.
- Watch for high-impact news related to the DAX or European markets, as these can impact GER40 volatility.
- Manage risk per re-entry, ensuring that cumulative exposure remains within acceptable limits.

GER40 Trade Log ### Trade Setup (29/10/2024):
1. Short in 4H FVG:
- Target: 1:2 RRR.
- Risk: 1% of account.
- Stop-Loss: Above the 4H FVG.
- Challenge: An open pump could threaten the short.
- Mitigation: Consider waiting for a bearish confirmation within the FVG before entry.
2. Long in 30-Minute FVG:
- Target: 1:2 RRR.
- Risk: 1% of account.
- Stop-Loss: Below the 30-minute FVG.
- Catalyst: Potential for an open pump, filling the FVG and moving upwards.
Strategy:
- Multi-timeframe approach with opposing trades.
- Monitor for intraday confirmation signals on each setup.
- Manage risk independently; if one trade reaches take-profit, reassess the other.


How to Setup Alerts : PineConnectorThis is a short video to share with my friends, who would like to learn how to easily set up alerts using TradingView's Alert function. We will be using the AIMS Algo script which has all the necessary code already done for you.


Weekly Technical AnalysisStart your week by identifying the key price levels and trends.
The SpreadEx Research team has analysed the most popular markets, including stocks, indices, commodities & forex.
-------------------------------------------------------------------------------------------------------
Analysis
Germany 40
Germany 40 remains bullish in an impulsive phase above the VWAP despite the pullback over the past week. The current price is 19,500, positioned above the VWAP (20) of 19,361. Support is now at 19,004, while resistance stands at 19,718. The RSI is 57, indicating ongoing bullish momentum with slight moderation.
UK 100
The UK 100 remains neutral in a consolidation phase after a failed breakout through the top of the range. The current price is 8,246, just below the VWAP (20) of 8,287. Support is identified at 8,185, while resistance is at 8,389. The RSI is 45, reflecting balanced momentum with no directional bias either way.
Wall Street
Wall Street is bullish but in a corrective phase. The price is currently 42,290, the furthest it's been below the VWAP (20) of 42,651 since early September. Support is at 41,792, with resistance at 43,510. The RSI is 47, flipping to bearish after a 2-month spell over the 50 level.
Brent Crude
Brent Crude remains neutral in a consolidation phase with no clear directional bias. The short term price trend is negative with the price of 7235, below the VWAP (20) of 7543. Support is located at 7067, with resistance at 8019. The RSI is 42, indicating a lack of clear momentum.
Gold
Gold remains very bullish still in an impulsive phase as the price tracks sideways in a narrow range under record highs. The current price is 2,733, above the VWAP (20) of 2,683. Support is found at 2,592, and resistance is at 2,775. The RSI is 65, reflecting strong bullish momentum without being overbought.
EUR/USD
EUR/USD is bearish in an impulsive phase, continuing to show strong downward momentum. The current price is 1.0787, below the VWAP (20) of 1.0877. Support is at 1.0740, with resistance at 1.1014. The RSI is 30, indicating strong bearish momentum and an oversold market.
GBP/USD
GBP/USD remains neutral but with a bearish bias. The current price is 1.2950, slightly below the VWAP (20) of 1.3029. Support is at 1.2914, while resistance stands at 1.3144. The RSI is 37, indicating weaker momentum with a potential for further downside.
USD/JPY
USD/JPY continues in a bullish impulsive phase. The current price is 153.54, even above the upper standard deviation of the VWAP (20) of 150.07. Support is at 146.77, and resistance stands at 153.50. The RSI is 71, signalling strong bullish momentum with overbought conditions.

GER30 (DAX) Possible SELL Based on Daily TF, the market seems to be forming a possible reversal chart pattern.
We could see Sellers coming in strong should the current level hold.
Disclaimer:
Please be advised that the information presented on TradingView is solely intended for educational and informational purposes only.The analysis provided is based on my own view of the market. Please be reminded that you are solely responsible for the trading decisions on your account.
High-Risk Warning
Trading in foreign exchange on margin entails high risk and is not suitable for all investors. Past performance does not guarantee future results. In this case, the high degree of leverage can act both against you and in your favor.


28.10.24This week will be the final full week in markets ahead of the Nov. 5 U.S. presidential election and the Fed’s next monetary policy decision on Nov. 7, which means investors will likely remain on edge. It will also be an action packed week highlighting reuslts from GDP on Wednesday, Core PCE price index on Thursday (Fed favourite gauge of inflation) and NFP Friday. If youre not equipt you might want to avoid trading around these releases.
US30: After reaching above the previous weeks high on Monday, price had posted its first 5 day losses in a row in a full week this year, this to me highlights that the bearish pressure if very strong so I will be on a look out for my downside movements as there a many structural breaks to the downside on the 4H. I would like to see price push past 42042.63 and I think price has a change to get to or past the 41675.97 area if we continue to the downside.
GER40: After passing highs of 19500.4, price has posted a loss week with 4 losing days and 1 bullish day. Price seems to be trading sideways on the higher timeframe as the previous months high, at the moment there may be a chance price will reach 19679.3 from what I see before is decided to do what it needs to but I will like to see price sometime make its way to 19340.6-19306.5 and continue its bearish momentum

Trendline BreakThis a continuation pattern, the price has consolidated and formed a downward trendline after making a higher on the higher timeframes, now we see a breakout and pullback, time to go long.
WE ONLY TRADE PULLBACKS

GER40 = SELLI came up with this market structure that confirm a bearish trend, hopefully it goes well 🙏💯🔥

Dax - back to 19KOn the intraday chart , the DAX has formed a H&S pattern , that is nearly completed.
This is a bearish pattern , and suggests weakness in the index.
The projection of the Head from the sloped neckline , has a target at 19K.
This pattern commonly has a divergence of price , with momentum and volume, as seen on chart.

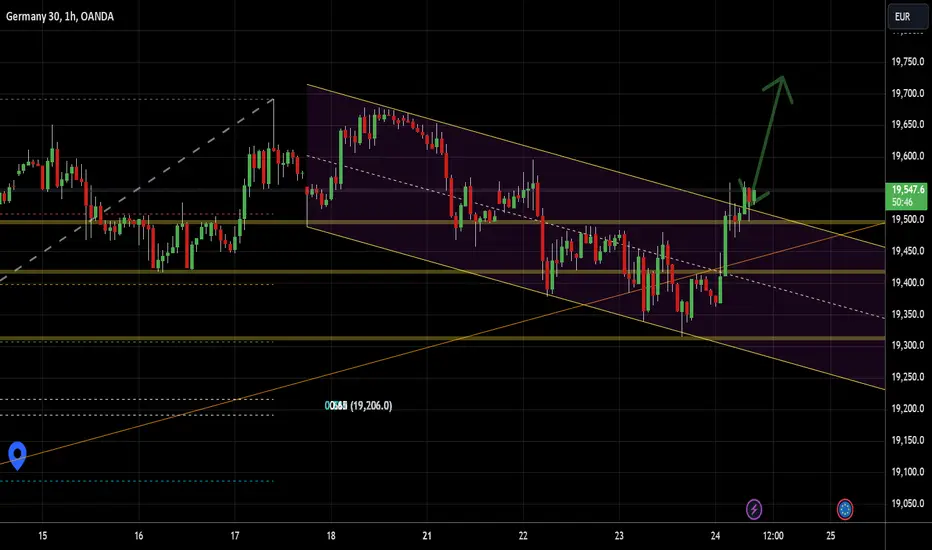
DAX30 Buy 1H Exit parallel channelThe price exit the 1H descending parallel channel, TP back to Historic Maximus

DAX 40 Loses Upward MomentumDAX 40 Loses Upward Momentum
Today, Germany's PMI data was released, according to Forex Factory:
→ German Flash Manufacturing PMI: actual = 42.6, expected = 40.7, previous = 40.6;
→ German Flash Services PMI: actual = 51.4, expected = 50.6, previous = 50.6.
The DAX 40 index (Germany 40 mini on FXOpen) showed a slight intraday increase, which could be viewed positively, especially given that last week, the index reached a yearly high.
However, the chart for the DAX 40 (Germany 40 mini on FXOpen) shows signs of the upward momentum slowing:
→ The RSI indicator is showing bearish divergence;
→ Price fluctuations are forming a triangle that could turn into a bearish reversal pattern known as a Bearish Rising Wedge (marked by black lines).
If a bearish break below the lower black line occurs, it might indicate that the bulls failed to maintain the momentum above the blue channel, within which the DAX 40 index had fluctuated for most of 2024.
Thus, a potential pullback towards the psychological level of 19,000 should not be ruled out.
This article represents the opinion of the Companies operating under the FXOpen brand only. It is not to be construed as an offer, solicitation, or recommendation with respect to products and services provided by the Companies operating under the FXOpen brand, nor is it to be considered financial advice.

GER30: Peak Reached, Support Retest LikelyHello,
FX:GER30 has reached a peak and is now poised to retest support. While a potential decline toward the 1M pivot point is possible, the likelihood remains low. A bullish continuation is more probable if the 1D support holds firm.
TradeWithTheTrend3344

Finding support The index looks headed to find support on near by barriers, as it failed to push up as a continuation.

DAX H4 | Potential bullish bounceDAX (GER30) is trading close to a swing-low support and could potentially bounce off this level to climb higher.
Buy entry is at 19,421.13 which is a swing-low support that aligns with the 38.2% Fibonacci retracement level.
Stop loss is at 19,280.00 which is a level that lies underneath a pullback support and the 50.0% Fibonacci retracement level.
Take profit is at 19,689.28 which is a swing-high resistance that aligns with the all-time high.
High Risk Investment Warning
Trading Forex/CFDs on margin carries a high level of risk and may not be suitable for all investors. Leverage can work against you.
Stratos Markets Limited (www.fxcm.com):
CFDs are complex instruments and come with a high risk of losing money rapidly due to leverage. 64% of retail investor accounts lose money when trading CFDs with this provider. You should consider whether you understand how CFDs work and whether you can afford to take the high risk of losing your money.
Stratos Europe Ltd (www.fxcm.com):
CFDs are complex instruments and come with a high risk of losing money rapidly due to leverage. 66% of retail investor accounts lose money when trading CFDs with this provider. You should consider whether you understand how CFDs work and whether you can afford to take the high risk of losing your money.
Stratos Trading Pty. Limited (www.fxcm.com):
Trading FX/CFDs carries significant risks. FXCM AU (AFSL 309763), please read the Financial Services Guide, Product Disclosure Statement, Target Market Determination and Terms of Business at www.fxcm.com
Stratos Global LLC (www.fxcm.com):
Losses can exceed deposits.
Please be advised that the information presented on TradingView is provided to FXCM (‘Company’, ‘we’) by a third-party provider (‘TFA Global Pte Ltd’). Please be reminded that you are solely responsible for the trading decisions on your account. There is a very high degree of risk involved in trading. Any information and/or content is intended entirely for research, educational and informational purposes only and does not constitute investment or consultation advice or investment strategy. The information is not tailored to the investment needs of any specific person and therefore does not involve a consideration of any of the investment objectives, financial situation or needs of any viewer that may receive it. Kindly also note that past performance is not a reliable indicator of future results. Actual results may differ materially from those anticipated in forward-looking or past performance statements. We assume no liability as to the accuracy or completeness of any of the information and/or content provided herein and the Company cannot be held responsible for any omission, mistake nor for any loss or damage including without limitation to any loss of profit which may arise from reliance on any information supplied by TFA Global Pte Ltd.
The speaker(s) is neither an employee, agent nor representative of FXCM and is therefore acting independently. The opinions given are their own, constitute general market commentary, and do not constitute the opinion or advice of FXCM or any form of personal or investment advice. FXCM neither endorses nor guarantees offerings of third-party speakers, nor is FXCM responsible for the content, veracity or opinions of third-party speakers, presenters or participants.

Could the price bounce from here?GER40 is reacting off the support level which is a pullback support and could bounce from this level to our take profit.
Entry: 19,439.80
Why we like it:
There is a pullback support level.
Stop loss: 19,279.78
Why we like it:
There is a pullback support level that aligns with the 50% Fibonacci retracement.
Take profit: 19,673.35
Why we like it:
There is a pullback resistance level.
Enjoying your TradingView experience? Review us!
Please be advised that the information presented on TradingView is provided to Vantage (‘Vantage Global Limited’, ‘we’) by a third-party provider (‘Everest Fortune Group’). Please be reminded that you are solely responsible for the trading decisions on your account. There is a very high degree of risk involved in trading. Any information and/or content is intended entirely for research, educational and informational purposes only and does not constitute investment or consultation advice or investment strategy. The information is not tailored to the investment needs of any specific person and therefore does not involve a consideration of any of the investment objectives, financial situation or needs of any viewer that may receive it. Kindly also note that past performance is not a reliable indicator of future results. Actual results may differ materially from those anticipated in forward-looking or past performance statements. We assume no liability as to the accuracy or completeness of any of the information and/or content provided herein and the Company cannot be held responsible for any omission, mistake nor for any loss or damage including without limitation to any loss of profit which may arise from reliance on any information supplied by Everest Fortune Group.
