Hang Seng.....On the path!Hello Traders,
Hang Seng has declined into my cited target rang from 26200-25848. Today the index closed trading at 26119.26. The decline does not look complete, so my goals remains unchanged!
At 25484 the 0.382 Fibo of the advance from 23124-27040. So, it could be a good Fibonacci-target.
Note the open gap at 25712.98-26157.77, in which HS has diving in. It could be possible, that this gap will be closed completely.
It needs a push above 26668 (blue arrow) to alter this view.
I wish all of my readers and their families a merry and healthy Christmas.
Have a great time....
Ruebennase
Feel free to ask or comment!
Trading this analysis is at your own risk!
HONGKONG50CFD trade ideas
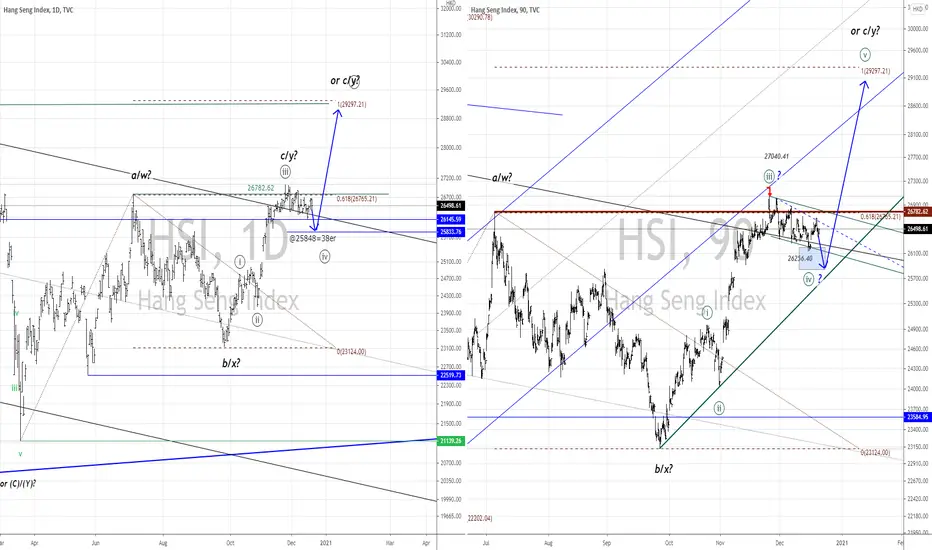
Hang Seng.....Open target @25848!Hello Traders,
Hang Seng has touched the lower boundary of the channel and bounced to the upside (@ 26668) and pulled back again. The overall development from the high @ 27040 does not look complete and my mentioned target (@25484 is still valid!
In this case, the odds would favor a wave ((iv)) and after impulse within a weave 5, that develop as a 1-2-3-4-5 would be next.
Any break of the wave ((i)) high @ 24970would alter the count, `cause wave ((iv)) would break into the territory of wave ((i)).
Keep in mind, that every 1-2-3 could be a wave a-b-c (w-x-y)!
Have a great Sunday.....
Ruebennase
Feel free to ask or comment!
Trading this analysis is at your own risk!
HANGSENG 19122020NEUTRAL.. SIDEWAYS
SUPPORT 26,250 , 26K
RESISTANCE 26.6K , 26.8K , 27K
PENDING FOR BREAKOUT


HANGSENG 12122020HSI weeky closed bearish.
but still supported by 26,250
break below 26,250 will visit 26k
Bullish structure still there.
seeing potential bounce
immediate resistance 26.6k

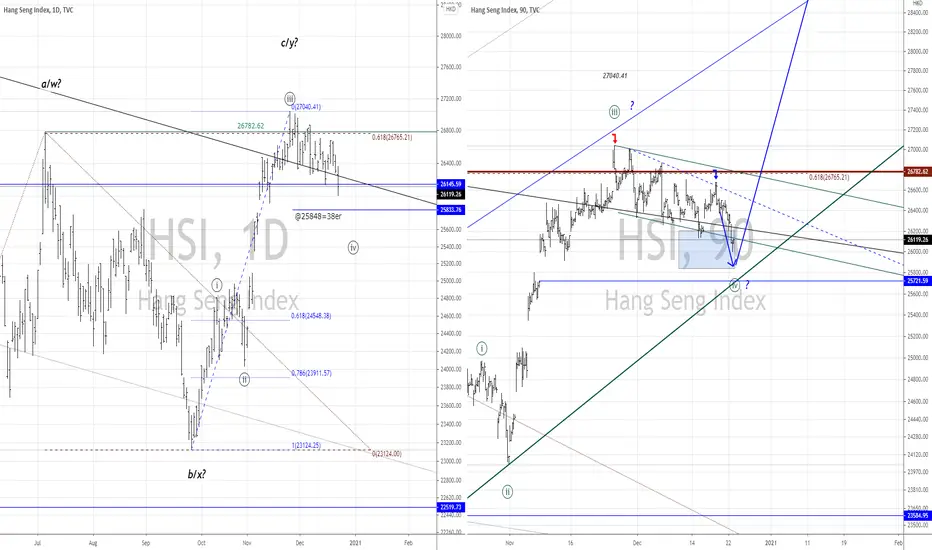
Hang Seng.....Bear flag in progress!Hello Traders,
HS is moving in a sideways consolidation and is embedded in a bearish flag. This move hasn't touched the 0.382 Fibo of the latter advance and is the minimum target I'd like to see for the end of the flag!
So it could be that HS is „gambling“ around the 26782 level and moving in the trend channel (green lines) for some days.
Any break of the 27040 level would imply that a wave (iii) of ((iii) has started and would be a strong advance to higher levels around the 29-30K area!
A break of the lower boundary of the channel give more potential for weakness development in the coming week (possibly) and could range from 26200-25848 level.
Have a great weekend.....
Ruebennase
Feel free to ask or comment!
Trading this analysis is at your own risk!
HSIRemember $HSI?
Did nothing since my last post 3 weeks ago.
Still Fascinating thought
👀
THE index to trade with price levels


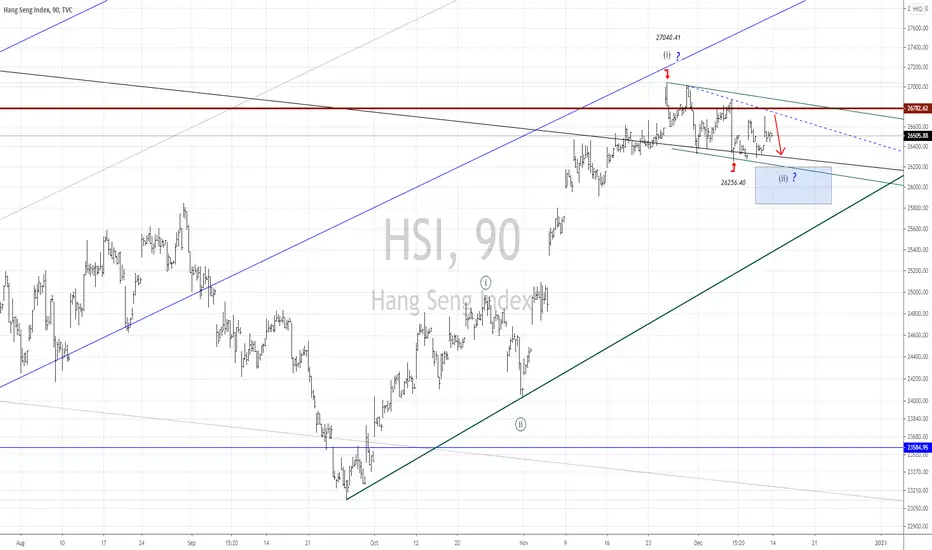
Hang Seng.....Important decision ahead!Hello Traders,
since my last analysis HS broke out to the upside with a 200 point gap ( I argued this) and made new highs.
The pullback from 27040.41 area, the „breakout high“ is a retest of the support, former resistance level. If HS confirm this level in the coming hours and days and made a new high above the 27040.41 level, we will get a new buy-signal!
As to observe at the graph is the clear „three-down“ from 27040.41 – 26322.68 area (red arrows)! That means, the next degree of trend is to the upside.
So, the important level on the downside is the 26322.68, the upside is 27040.41. Any break of these levels indicate further weakness or more bullish potential in the coming hours and days.
But keep in mind, that HS is now at a critical level (at 26782.62, brown trend line)! This area is important to overcome, too.
If HS is likely to break this area, the next target is the open gap, left by trading from the weekend on Feb. 21-24. This means a close of the gap should bring HS to 27308.81.
Have a great week.....
Ruebennase
Feel free to ask or comment!
Trading this analysis is at your own risk!

HANGSENG 05122020weekly closed with a struggled candle.
tested support 26.3k and 26.6k
if break and closed above 27k can go to 28k
overall more on bullish bias

Hong Kong stonks Formating descending triangle on the top of the strong trend, possible fall to 26350

HSI 28112020HSI finally broke above 26.6k
support to watch 26.6k , 26.4k
Resistance to watch 27k, 27.4k , 27.8k


HSI bouncing from channel , more upside ! HSI bouncing from channel, more upside ! Stochastics is also showing hidden support level for price to bounce from!


HSI is seeing support from the trendline, more upside ! HSI is seeing support from the trendline, more upside !
Hang Seng.....Next breakout?Hello Traders,
since my last analysis (red arrow) HS-index has broken out to new highs since the low at 23124.25 on September 25. It has moved into a range of resistance (at 26782.62) that pretty cool coincide with the 1.382 Fib-Extension of wave x. And it is the 0.618 Fib.-Extension of waves x and y!
So, multiple resistance lies directly ahead.
And at least, HS also reached the declining trend line that connects the high from January 2018 and April 2019.
It could be that HS will spike above the trend line to touch the areas, mentioned before. Two scenarios are still possible.
It will fail to breakout to new highs and corrective setback is next.
Or it will breakout with a massive gap to the upside (a bullish gap) and this would open the door to 292xx area still!
I will update the count in the coming hours.
Have a great Sunday!
Ruebennase
Feel free to ask or comment!
Trading this analysis is at your own risk!

view on HSI 22112020HSI sideways for weeks within
26k-26.6k..
pending for breakout above 26.6k for further upside.
No game if price break below 26k.


