Another opportunity to Short HKXHKD (HK50)FOREXCOM:HKXHKD is still in Seller's territory and now is a good time to short.
Purely Price Action setup and here is my personal trade opinion:
Sell Limit at 23,891
Stop Loss at 24,400
Take Profit at 22,589
Risk Reward Ratio = 2.63R
Disclaimer :
The analysis above for educational purposes only, I do not responsible for your losses. Please adjust your own lot-sizing according to your appetite.
If you are benefiting from my trade opinion, please buy me coffee .
As always, move your SL when you are in the profit zone.
HONGKONG50CFD trade ideas

Hang Seng.....Wave "4" of lesser degree done?Hello Traders,
my latter call for a countertrend in Hang Seng was to early. It took some more down-up sequences to complete the structure of a wave ((3)) decline. This structure was done on September 25 @ 23124.30.
Then, the countertrend did occur and push HS to a high @ 23780 area. Today`s decline should be part of wave ((v)) which will bring HS to fresh new lows below the wave ((3)) low @ 23124! One cited target area should be around 22505. A break of the 23258 level would strengthen the odds for this view.
An extension of the countertrend could lead into a pattern of an a-b-c-X-a-b-c-pattern, that should end below the possible wave i low @ 24213!
Have a great week...
ruebennase
Feel free to ask or comment!
Trading this analysis is at your own risk!

HSI ((HK33HKD; Oanda)We are currently in the 1st ellipse pointed out about 2 weeks ago (link to that post below).
We can see lots of buying coming in at the bottom of the range, however we also see the overall immense pressure of selling at various points of this range as well.
Prices has only retraced till Fib23.6 of the current down leg which indicates there's a further move down to go (it may travel down the channel or it could be a trap move, that I may not be too clear; I hope it's the latter).
I'm expecting prices to test 23350 region before retracing decently, and hopefully towards our 2nd ellipse in due course.
Please refer to previous plan in link below to get a complete picture.

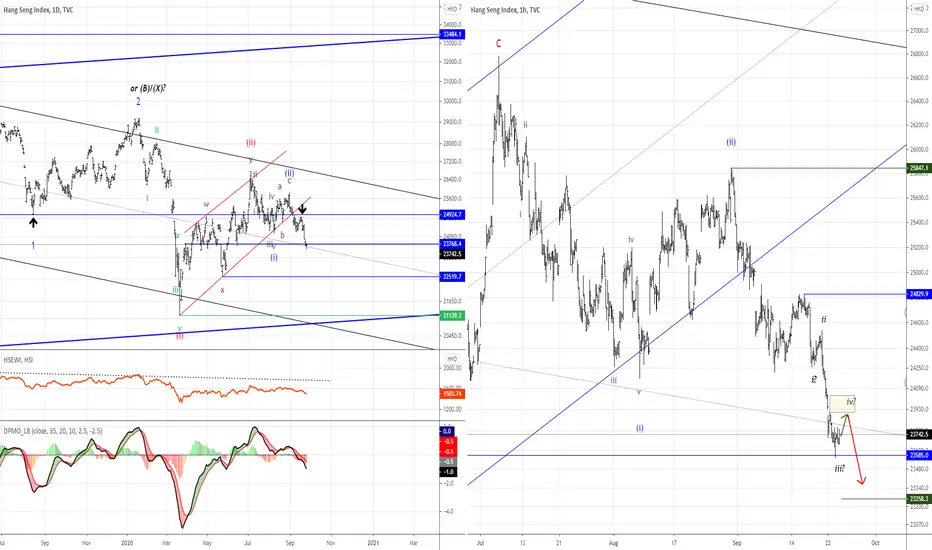
Hang Seng.....One more up-down sequence?Hello Traders,
Hang Seng declined too, today`s low @ 23560 could be a wave 3 of an impulsive move. If so, the next move is countertrend and develop as a „three-up“. A possible target range is at or around the 23900 level, were an open gap is left at chart and above to 24036 area, the 0.382 Fibonacci of the decline. On rule for Elliott wave is, that a wave 4 can never enter the territory of wave „1“! of any degree. So a „knock-out“ for the impulsive move is @ 24590.90. If this level will be touched, the odds are high that the impuslive move failed to develop.
The decline from 25847, the possible wave (ii) high looks more as a „three-down“, not an impulsive move yet, but the odds for a „flat-pattern“ would be high that one more up down sequence is needed to complete this structure. A target range for this scenario is the level at 23260, were waves c=a!
Have a great week...
ruebennase
Feel free to ask or comment!
Trading this analysis is at your own risk!
HSI Looking BearishDespite the short term bullishness in the market, we can see from a higher timeframe that OANDA:HK33HKD is currently making its move in a wave form. Using the Elliot Wave and Fibonacci technique, I personally think that the market is in the 4th wave and it should swing to wave 5 soon.
We can look for potential weakness to open short position and add more position once the support of 24k is broken. The conservative TP for this particular trade would be around 24000 points and the more aggressive TP would be around 18k. CL should be above 27k.
Please DYODD before making taking risks using money you can not afford to lose. This is just a personal sharing on the patterns which I spot without taking geopolitical factors and the fundamental economics into consideration.

Hong Kong Stock Index (We are in the Probabilities Businesses)View On Hong Kong Stock Index (16 Sept 2020)
In our previous analysis of 7 Sept, we expect this index to go lower than 25,250 region.
It went to 24,250 region as expected and it is making a minor bounce.
Now, 24,600 has become a decent support region and it is a life support for now.
IF the 24,600 region supports the price well, it could swing to 25,200-25,500 region.
How the today and tomorrow candles end will be very important. Let's see.
Cheers.
Legal Risk Disclosure:
Trading foreign exchange or CFD on margin carries a high level of risk, and may not be suitable for all investors.
The high degree of leverage can work against you as well as for you. Before deciding to trade foreign exchange you should carefully consider your investment objectives, level of experience and risk appetite.
The possibility exists that you could sustain a loss of some or all of your initial investment and therefore you should not invest money that you cannot afford to lose.
You should be aware of all the risks associated with foreign exchange trading, and seek advice from an independent financial advisor.
DISCLAIMER:
Any opinions, news, research, analyses, prices or other information discussed in this presentation or linked to from this presentation are provided as general market commentary and do not constitute investment advice.
Sonicr Mastery Team does not accept liability for any loss or damage, including without limitation to, any loss of profit, which may arise directly or indirectly from use of or reliance on such information.

Potential Short for HKXHKDThe FOREXCOM:HKXHKD prices had been consolidating for quite a while and not creating any higher highs (HHs). Yesterday was a good setup to short after the compression was done, but I failed to catch it.
This morning, I saw another good opportunity to short with a condition that the price will close at 24,190 area.
Here is my personal trade opinion :
Sell Stop at 24,190
Stop Loss at 25,000
Take Profit at 23,125
Risk Reward Ratio = 1.35R
Disclaimer :
The analysis above for educational purposes only, I do not responsible for your losses. Please adjust your own lot-sizing according to your appetite.
If you are benefiting from my trade opinion, please buy me coffee .
As always, move your SL when you are in the profit zone.

Hang Seng.....First waves of decline?Hello Traders,
at my latter analysis I wrote this: „If the upward push is not complete, and HS need some more up-divisions, a target range should be at or around 24830-24852 level were the move has to retrace a 0.382 Fibonacci of the decline from 25847 and it is the 1.382 Fibonacci extension of wave „a“.
Exactly this scenario played out after.
Hang Seng achieved to the area and reversed after to the downside, but failed to show an impulsive structure yet. Overall the pattern from the low @ 24213.40-24826 is a „three-up“, which means the next larger trend is down.
From 24826 the move down looks like a not complete impulse move with waves 1-2-3-4 to be complete or nearly so and a wave 5 is next to come to finish the first waves down. A potentially area should be around the 24221.40 area with more bearish potential to be possible.
Any extension of the possible wave (y) high @ 25847 levels would mean that a more complex structure of correction is underway.
Overall to speak. Much more bearish potential exist, with much lower price to come in the next days and maybe weeks. Keep that in mind!
Have a great weekend....
ruebennase
Feel free to asko r cemment!
Trading this analysis is at your own risk!

Hong Kong Stock Index (Too Much Uncertainties)View On Hong Kong Stock Index (7 Sept 2020)
Even though the other stock markets such as US Dow Jones, NASDAQ and German DAX were doing extremely well, Hong Kong Stock Index (HSI) failed to do so.
Since the island state is facing lot of political upheaval recently, the performance of the stock market is pretty much expected.
With the on going political escapade, falling property prices and the covid uncertainty, we will not be bullish on the Hong Kong Stock Market for the time being.
It shall face more bear pressure in the near term and it should easily to retest the swing low level of 25,250 region (or) even lower.
Cheers.
Legal Risk Disclosure:
Trading foreign exchange or CFD on margin carries a high level of risk, and may not be suitable for all investors.
The high degree of leverage can work against you as well as for you. Before deciding to trade foreign exchange you should carefully consider your investment objectives, level of experience and risk appetite.
The possibility exists that you could sustain a loss of some or all of your initial investment and therefore you should not invest money that you cannot afford to lose.
You should be aware of all the risks associated with foreign exchange trading, and seek advice from an independent financial advisor.
DISCLAIMER:
Any opinions, news, research, analyses, prices or other information discussed in this presentation or linked to from this presentation are provided as general market commentary and do not constitute investment advice.
Sonicr Mastery Team does not accept liability for any loss or damage, including without limitation to, any loss of profit, which may arise directly or indirectly from use of or reliance on such information.


HSI (HK33HKD; Oanda)Yesterday's close showed some signs of bullishness.
Inverse H&S, Higher Lows and possibly be wave 4 of EW throughout Eur and US sessions.
Still in a Long at market start but shifted SL to 25%TP currently.
Hopefully it has at least 1 more leg to go to touch the extrapolated ascending neckline of the H&S before turning back.
If it gets past previous highs, will shift SL to 50%TP to preserve profits.

HSI (HK33HKD from Oanda)The chart above is how I plan to trade HSI in the coming weeks.
I'm expecting some ranging to go on. At times, it'll look like a break-up/break-down only to pullback and close below/above a critical price area (resistance/support). If you are late to the move, don't chase it! You can try to wait at to enter a trade using your own method of entry at the 4 ellipses.
Let me explain. *1st ellipse* I'll be expecting a trap move down coming up (Not able to predict the timeframe; days? weeks?), BUT when it does happen, do take note of these...
1st ellipse - Currently, Purple box is acting as a support. Expecting a false break to at least 24000 (below this is definitely likely).
See how price reacts and close before making a decision to Buy.
2nd ellipse - Short term resistance from trendline. See if you want to do an intra-day/s short.
3rd ellipse - If there is a breakout(finally) from 2nd ellipsed area, price will want to retest that same purple line. Using your method, see if you want to go Long.
**4th ellipse - Depending on how cautious the market is from here (see how the candles form to reach this point), I'm expecting price to lightly touch and retrace immediately or 'burst' through the outer purple resistance trendline for a false break and thereafter retrace and swiftly start dropping.
*Posting this in advance as a plan (if it happens) as I do not seem to have time to post updates during the day while I trade intraday on other indices or currencies. There are of course more trades to take on the HSI than the above mentioned plan but intraday trades are taken based on the day's bull/bear strength and constant formation of candles so it's more difficult to post those with proper analysis. By the time those are posted, the move may already have begun and I usually don't see many views within 20mins (most come after 45 mins to an hour after) from the post like the USDCAD post I did recently (link below) and the move to TP was over in half an hour. TV may not be the right place for almost 'live' trade ideas.
Anyway, Good luck and see you in the money!

Hang Seng...Mixed picture!Hello Traders,
since my latter analysis, Hang Seng has declined nearly 1000 points but failed to show an impulsive decline. The move since yesterday's low @ 24220 is either a small „three-up“ that is complete or it is part of a larger structure with higher price to come in the next hours.
In the first case, HS will decline in the coming session to lows below the 24213 level with targets at or around the 24170-24150 area. More bearish potential exists.
If the upward push is not complete, and HS need some more up-divisions, a target range should be at or around 24830-24852 level was the move have to retrace a 0.382 Fibonacci of the decline from 25847 and it is the 1.382 Fibonacci extension of wave „a“. We will see if the market will respect this level of resistance.
I will update the count tín in the coming days.
Have a great weekend....
ruebennase
Feel free to ask or comment!
Trading this analysis is at your own risk!


HK50 short term analysis, give me some ideas!! Am I correct?
If price breakdowns 24443, it will be a downtrend to 22000
If price breakout 25778, it will go up to 26600 first then rebound to be a downtrend
Short Term
SHORT @ 25200 or wait for SHORT@24443
SL @ 25800
TP @ 22000
Risk and reward rate around 1:3- 1:5
Thank you.

Can round 3 stimulus resurrect the weakening HK market ?Read latest news here
This candle that I highlighted is crucial as it sits in between the bullish trend line of HSI. This doji candle signify indecision amongst the buyers and sellers. Either side can be winning to lead the momentum for which now we do not know what the outcome is.
We also see some support at 24,130 which in the short term, we might see HSI revisiting this level .Last night , the Tech sell off may influence the Asian market to follow as well. So, tonight closing for the US indices is crucial as it will influence how the Asian market performs next week.
IMO, I tend to lean on the bullish side and view any short term corrections as an opportunity to go long.
Now that the HK protests has died down, the government has one pressing issue on hand - COVID 19 which they are getting strong support from China. Mass testing is ongoing now in HK and it is a matter of time, it will be contained. Also, we have vaccines being developed by several countries (Russia, China , Singapore ,etc) which would be a big help to HK.

HSI Rising Wedge PatternHang Seng Index (HSI) has started a rising wedge pattern since March 2020.
It has just broken the wedge pattern last Friday, closing low than 24814.
See if the breakdown is confirmed in the next 2 trading days.
If it goes back to the wedge, look for a SHORT at 26050 level in October.
The Risk / Reward Ratio is 1:5.6
Target: 21500 (Some main long term trend line support)
Stop Loss: 26850 (Above previous high)


HSI quick trade for the eveningHow to quick trade this?
If there is an opportunity during the US session, Stay on the SHORT side if prices move above 25100.
TP1 at bottom purple line.
If there's a breakout from the channel TP2 at 24600.
SL slightly above the yellow channel (1st candle).
** Do not mistake, this is a separate, shorter term analysis.
Previous post's trade is still running but reduced lot size (reduce ie TPed some of it)
prnt.sc


Hong Kong Stock Index (Trying to break out higer)View On Hong Kong Stock Index (25 AUG 2020)
There are 2 major level that you need to watch out 24,200 as support while 25,500 as resistant.
Now it is trying to break the resistant of 25,500 region and sooner or later it shall break up higher.
It may take some time too. but we shall see 26,000 level soon.
Legal Risk Disclosure:
Trading foreign exchange or CFD on margin carries a high level of risk, and may not be suitable for all investors.
The high degree of leverage can work against you as well as for you. Before deciding to trade foreign exchange you should carefully consider your investment objectives, level of experience and risk appetite.
The possibility exists that you could sustain a loss of some or all of your initial investment and therefore you should not invest money that you cannot afford to lose.
You should be aware of all the risks associated with foreign exchange trading, and seek advice from an independent financial advisor.
DISCLAIMER:
Any opinions, news, research, analyses, prices or other information discussed in this presentation or linked to from this presentation are provided as general market commentary and do not constitute investment advice.
Sonicr Mastery Team does not accept liability for any loss or damage, including without limitation to, any loss of profit, which may arise directly or indirectly from use of or reliance on such information.

Hang Seng Index plan (Part 2)This week could see a drop to the lower channel support buffer zone (purple lines) to test if there would still be interest in the mkt for this up move.
Do remember that this seems to be a corrective move (up) relative to the impulse move (downwards) in March. Furthermore, we are already 5 months into the laboured corrective up move, hence we can see pretty heavy selling at various levels.
If you are cautious, you can wait for the down move to begin (break of bottom channel/structural change; could be 1st signs of end of correction).
However, upward speculation could take us to 27K levels. Hence, there could be some bullish profits to be made.
If you want to stay on the bullish side , you can buy at the purple bottom channel lines and TP/sell at the red trendline. SL is placed slightly below the 2nd previous Higher-Low (all shown in chart).
*My opinion is that it may peak in Nov-Dec b4 in confluence with EOY (akin to) profit taking and other conditions including fundamentals and technicals showing up at that stage. The nitro will burn out sooner or later. Let's watch the show. Be cautious with Bulls and use guaranteed SL if your broker provides it.
