Dow Jones Extends Rally Toward New HighsOver the past two trading sessions, the Dow Jones Industrial Average has gained nearly 1%, approaching the all-time high zone near 45,000 points. For now, the bullish bias remains intact, supported by the Federal Reserve’s announcement that a rate cut may occur later this year, despite renewed concerns over a potential reignition of trade war tensions. If buying pressure holds in the short term, this could fuel further upward momentum, potentially pushing the index to new record levels.
Consistent Uptrend
The recent bullish swings have sustained a steady level of investor confidence, allowing the upward trend to remain unbroken. So far, there hasn’t been any significant selling correction strong enough to break the structure, meaning the dominant long-term uptrend remains intact. This continues to be the most important technical pattern to monitor, although the index is once again testing previous highs, where short-term selling corrections may emerge.
Technical Indicators
RSI: The RSI line is hovering near the overbought level around 70, suggesting that buying momentum has created an imbalance in market forces. This may open the door to a potential technical pullback as the index approaches historical highs.
ADX: The ADX line continues to rise above the neutral 20 level, maintaining a steady upward slope in recent sessions. If this trend continues, it could indicate increasing strength behind the current uptrend, especially if key resistance levels are broken.
Key Levels:
44,970 – Major Resistance: This level marks the all-time high and serves as the most important short-term resistance. A breakout above it could strengthen the bullish bias, open the door to new record highs, and further confirm the ongoing uptrend.
43,863 – Intermediate Support: A technical indecision zone seen in late February. A drop below this level may trigger a period of short-term neutrality or sideways movement.
42,756 – Critical Support: This zone aligns with the 50- and 200-period moving averages, making it a key technical area. A break below this level may signal the end of the current bullish trend and initiate a deeper correction.
Written by Julian Pineda, CFA – Market Analyst
WALLSTREETCFD trade ideas

US30 Sell IdeaSelling in the 44815–44886 zone, targeting a drop to 44476.50 with a stop loss at 44927.50 to cap risk. This setup aims to catch a pullback from resistance after the recent upward move, expecting the price to retrace toward the lower support area. Trade with discipline and wait for bearish confirmation around the entry zone.

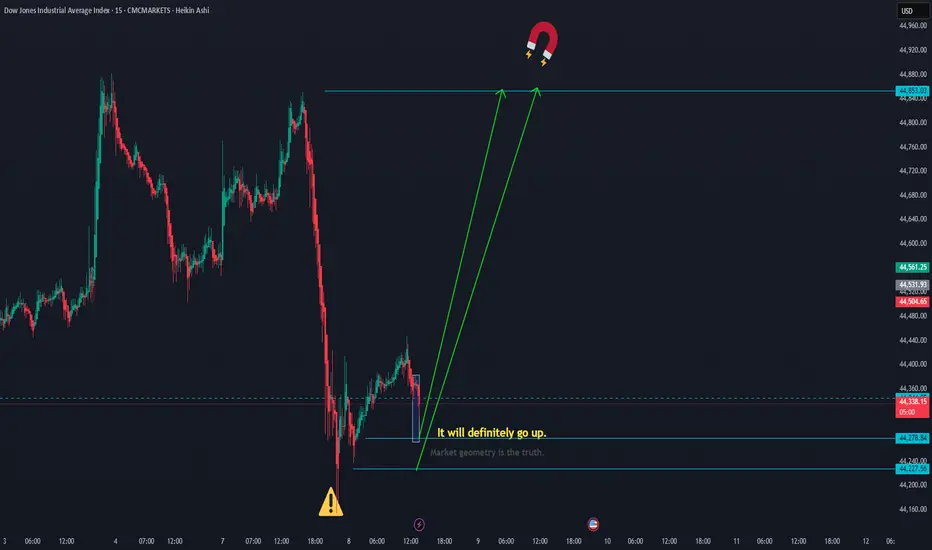
The dowjones should move upThe Dow Jones should move up to 44,853.
The levels 44,278.84 and 44,227.56 are good potential points for a bullish reversal. CMCMARKETS:US30
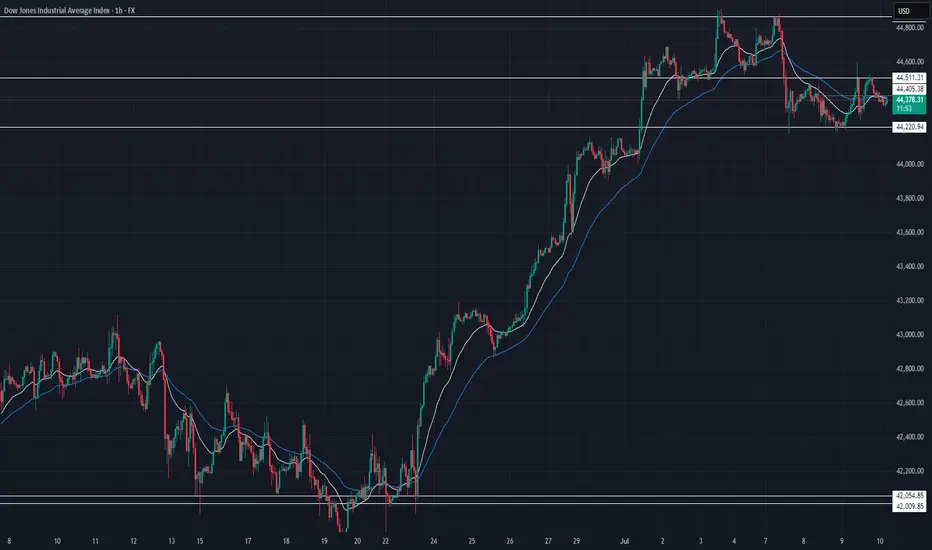
US30: Buy ideaBuy idea on US30 as you can see on the chart because we have a good intersection between the resistance line and the support line.

DowJones bullish continuation supported at 44000Key Support and Resistance Levels
Resistance Level 1: 45000
Resistance Level 2: 45445
Resistance Level 3: 46000
Support Level 1: 44000
Support Level 2: 43700
Support Level 3: 43430
This communication is for informational purposes only and should not be viewed as any form of recommendation as to a particular course of action or as investment advice. It is not intended as an offer or solicitation for the purchase or sale of any financial instrument or as an official confirmation of any transaction. Opinions, estimates and assumptions expressed herein are made as of the date of this communication and are subject to change without notice. This communication has been prepared based upon information, including market prices, data and other information, believed to be reliable; however, Trade Nation does not warrant its completeness or accuracy. All market prices and market data contained in or attached to this communication are indicative and subject to change without notice.

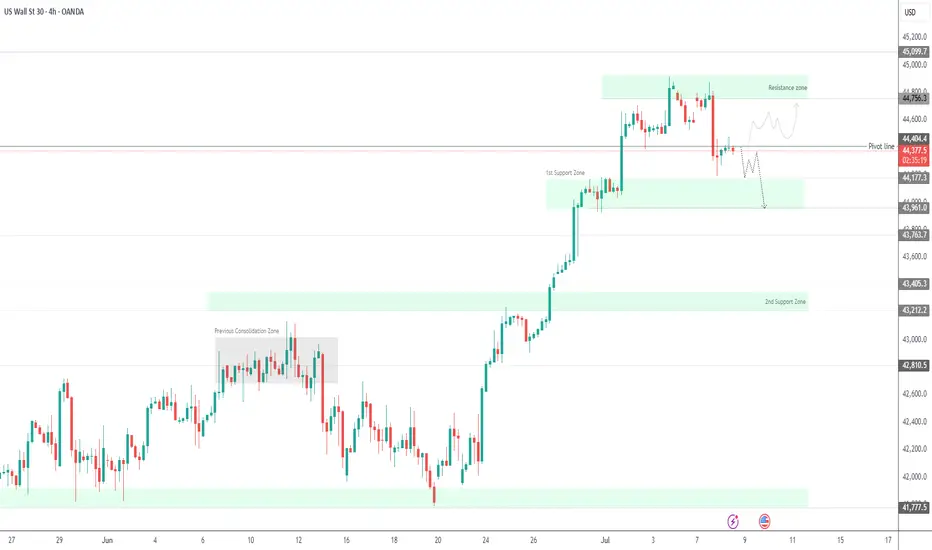
US30 Consolidates Below Resistance – Tariff Risks LoomUS30 – Market Overview
The price is currently consolidating within the range of 44490 to 44180, awaiting a breakout to determine the next directional move.
Bearish Scenario:
As long as the price trades below 44490, we expect bearish volatility to retest 44180.
A confirmed 1H close below 44180 would open the path toward 43960 and 43760.
Bullish Scenario:
If the price closes above 44490, it will likely trigger a bullish move toward 44750, with potential extension to 44970 ATH and beyond.
Note: Market sentiment remains sensitive to tariff-related developments, which may drive sharp moves in either direction.
Pivot Level: 44490
Support: 44180, 43960, 43770
Resistance: 44750, 44960, 45100

US30: Move Up Expected! Long!
My dear friends,
Today we will analyse US30 together☺️
The in-trend continuation seems likely as the current long-term trend appears to be strong, and price is holding above a key level of 44,393.91 So a bullish continuation seems plausible, targeting the next high. We should enter on confirmation, and place a stop-loss beyond the recent swing level.
❤️Sending you lots of Love and Hugs❤️

US30 Market Update – 07/10/2025
📍 US30 Market Update – 07/10/2025
The bounce attempt failed and sellers are still in control 🐻
Price attempted a reclaim above 44,511 but got rejected again and is now consolidating beneath the EMAs 🚨
📊 What We’re Seeing:
Lower highs forming below 44,600
Rejection wicks near EMA levels (bearish pressure)
EMA ribbon is now resistance zone (20 EMA < 50 EMA)
Key intraday support held at 44,220, but barely
🔑 Key Levels to Watch:
🔼 Resistance: 44,511 → critical for bulls to flip
🔽 Support: 44,220, if broken → next is 44,000
💡 Trade Setup Ideas:
🔻 Short Setup (Main Bias):
Wait for rejection near 44,450–44,500
Entry trigger: Bearish engulfing or shooting star
Targets: 44,250 → 44,000
SL: Above 44,600
🔹 Long Setup (If Bulls Step In):
Must reclaim and close above 44,600 on 1H
Look for strong bullish candle with follow-through
Targets: 44,800 retest
SL: Below 44,400
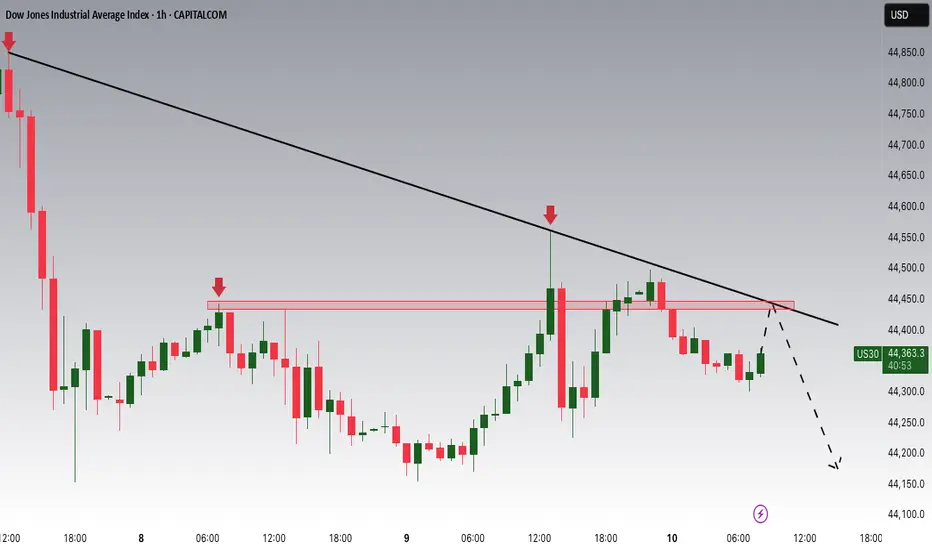
Dow Jones Potential DownsidesHey Traders, in today's trading session we are monitoring US30 for a selling opportunity around 44,450 zone. Dow Jones is trading in a downtrend and currently is in a correction phase in which it is approaching the trend at 44,450 support and resistance area.
Trade safe, Joe.
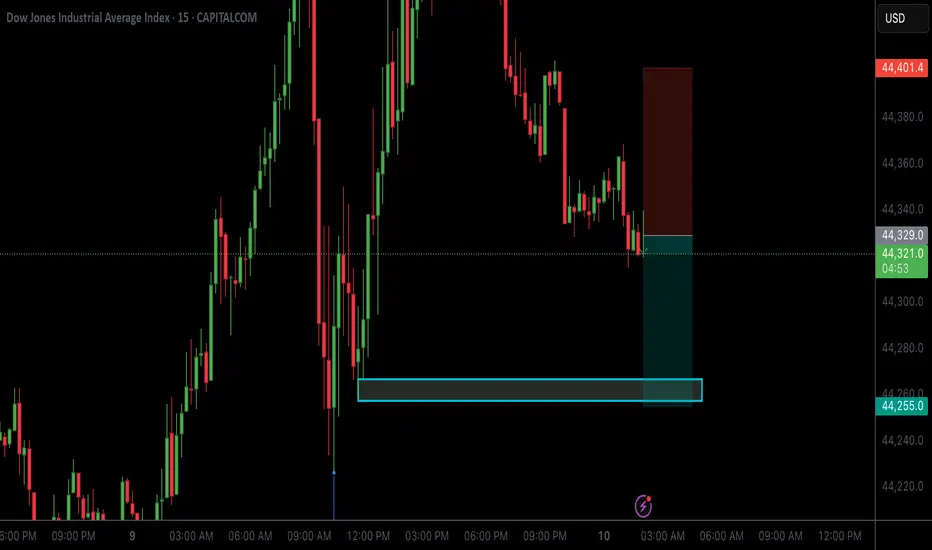
US30 SELLTake trade on your own risk!
still moving on the downward trend to the next supply & demand zone, no sign of reversal.
Set TP: 44,255
US 30 is still bullish OverallThe Buy set up remains higher probability set up till we get a bearish confirmation and if that happens very instructively, then the extreme POI would be a great TP target and the next higher probability buy trade set up

sell then buyWe are witnessing a change in the trend from upward to downward. It is time for him to go down and see the bottom of his first weekly pivot and then go back up to reach the new weekly ceiling


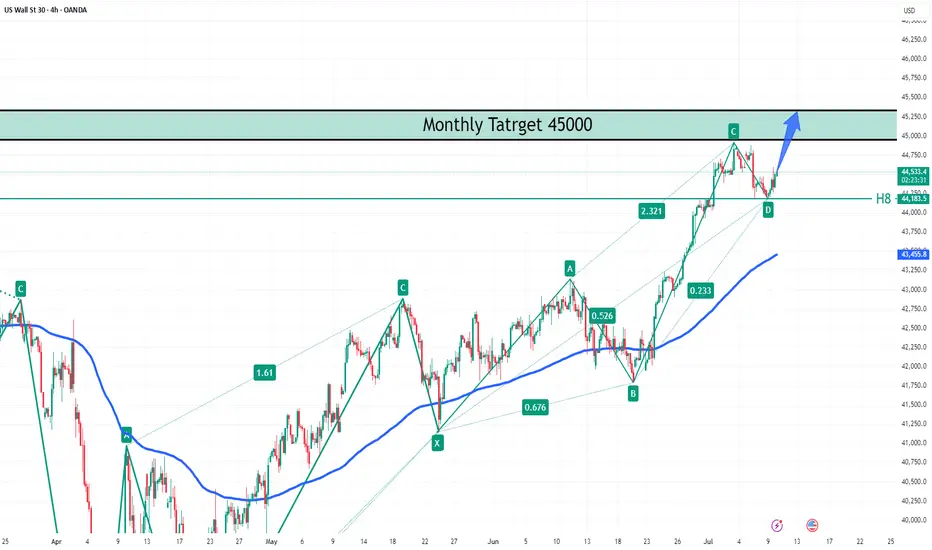
Dow Jones (US30): Recovery in Motion — Target at 45,000Market Overview:
The Dow Jones index holds above the support zone at 44,183 after a local correction. The broader trend remains bullish, with the primary target set near the monthly resistance zone at 45,000.
Technical Signals & Formations:
— Completed ABCD pattern
— Support confirmed at H8 level (44,183)
— EMA acting as dynamic support
— Upside potential toward channel resistance
Key Levels:
Support: 44,183, 43,455
Resistance/Target: 45,000
Scenario:
Primary: If Dow Jones remains above 44,183, continuation toward 45,000 is likely.
Alternative: A break below 44,183 could trigger a deeper correction toward 43,455.
US30 – Pullback Holding Above 44300After rallying into the 45,011.92 resistance, US30 is pulling back modestly but still trading above the prior breakout zone at 44,313.00. This could act as short-term support if bulls maintain momentum.
Support at: 44,313.0 🔽 | 43,800.0 🔽
Resistance at: 45,011.9 🔼 | 45,500.0 (psych level) 🔼
🔎 Bias:
🔼 Bullish: Price holding above 44,313.0 keeps bullish structure intact with eyes on new highs.
🔽 Bearish: A breakdown below 43,800.0 may shift momentum and trigger a deeper retracement toward 42,800.0.
📛 Disclaimer: This is not financial advice. Trade at your own risk.

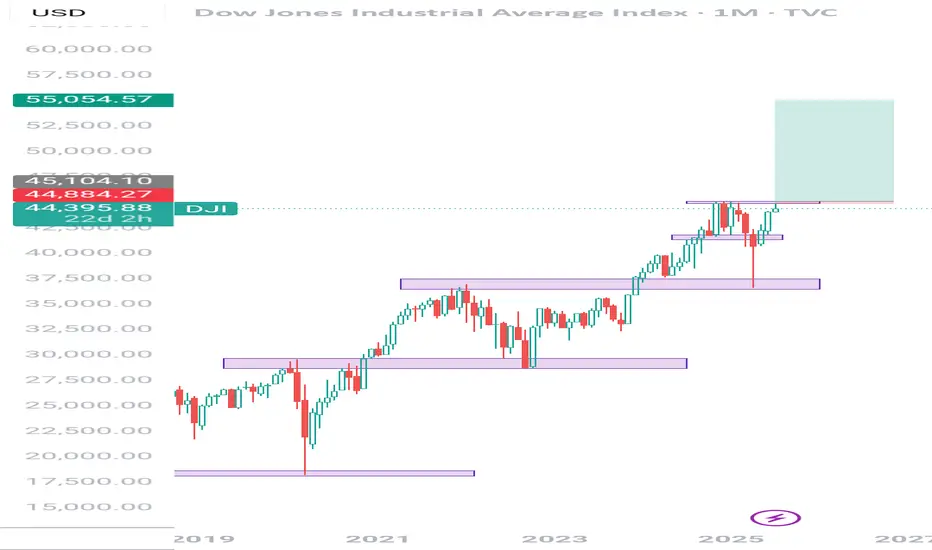
Long position on DJIA Price action analysis on Dow Jones. Dow Jones has a repetitive pattern of retesting the previous Higher High after a market crash so in this analysis I'm anticipating a breakout on the 45.000 price mark then go long till 55.000 which is 10000 pips before a market crash occurs to retest the 45.000 price. Dow Jones moves +- 18000 pips on a long position before a market crash occurs which provides a beautiful opportunity to go long.
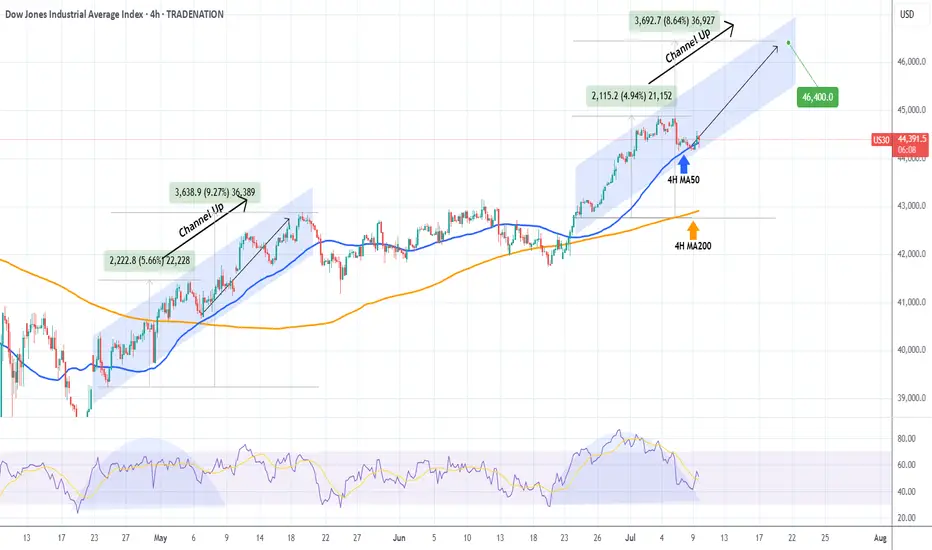
DOW JONES repeating May's pattern.Dow Jones (DJI) has been testing its 4H MA50 (blue trend-line) since yesterday, following 2 straight weeks of trading strongly above it.
If it holds and rebounds, the pattern will draw even more similarities with May's Channel Up, which after the May 06 Low, it resumed the uptrend to peak on a +9.27% rise from the bottom, before breaking below the 4H MA50.
Since the current rise is -0.70% weaker (+4.94% against +5.66%) from May's fractal, we can assume that as long as the 4H MA50 holds, we can expect a peak at 46400.
-------------------------------------------------------------------------------
** Please LIKE 👍, FOLLOW ✅, SHARE 🙌 and COMMENT ✍ if you enjoy this idea! Also share your ideas and charts in the comments section below! This is best way to keep it relevant, support us, keep the content here free and allow the idea to reach as many people as possible. **
-------------------------------------------------------------------------------
Disclosure: I am part of Trade Nation's Influencer program and receive a monthly fee for using their TradingView charts in my analysis.
💸💸💸💸💸💸
👇 👇 👇 👇 👇 👇
Us30 Long Day Trade New York OpenIm looking for a long on the Us30 for a 1:3 min , im trade a long after a the retest due to the the trend has been bullish

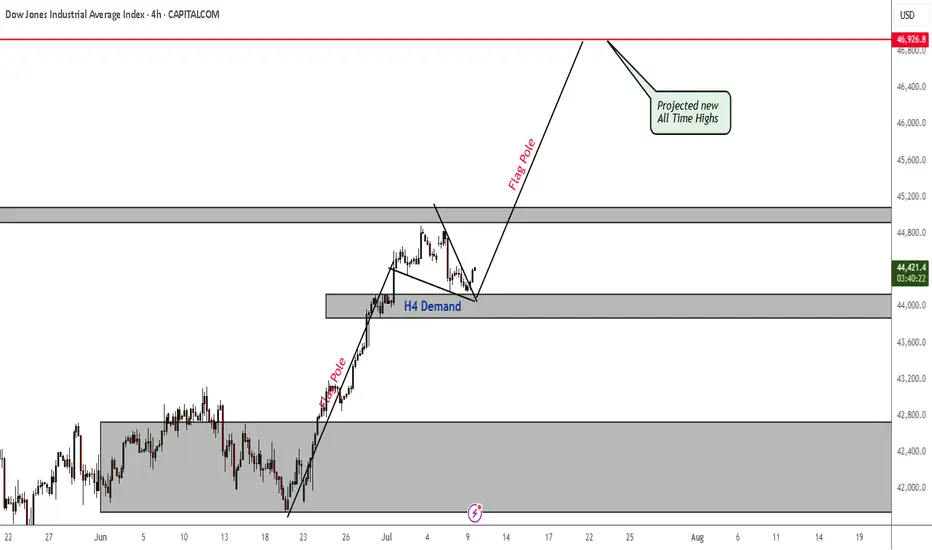
US30 Projected All Time Highs As Bullish Trend ResumesPrice is currently being supported by an H4 demand zone. If this demand zone continues to hold and apply pressure to the upside, we will soon be seeing new all time highs. Which really should not surprise us because as we all know, indices are generally bullish long term.
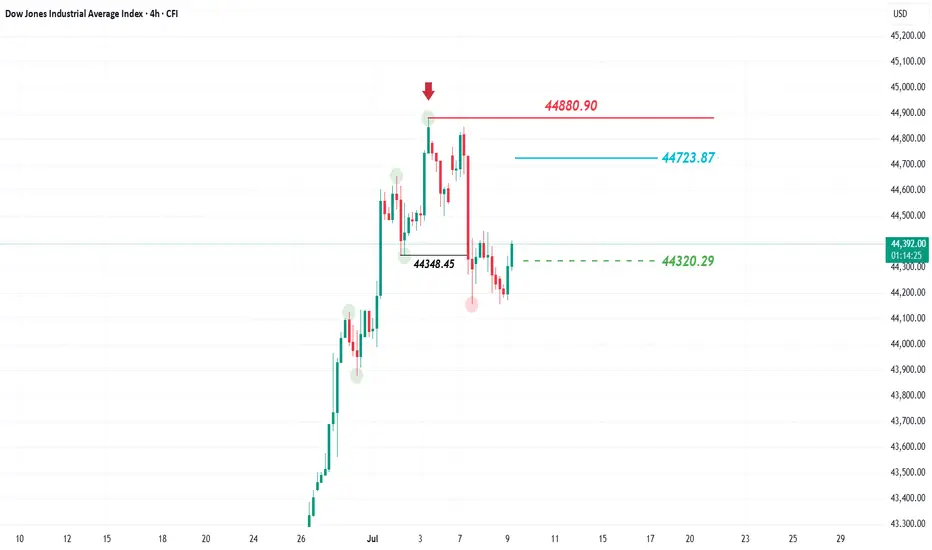
Dow Jones takes a different path!US President Donald Trump announced a postponement of the suspension of tariffs from July 9 to August 1, stressing that this deadline is final and will not be delayed again.
This decision has left the markets cautious, particularly US indices, but the Dow Jones Index has taken a different route compared to the S&P 500 and Nasdaq, which are generally trending upwards. Meanwhile, the Dow has shifted its direction from bullish to bearish.
On Monday, July 7 2025, the Dow Jones fell and recorded a lower low at 44,348.45, below its previous higher low. This signals a trend reversal on the 4-hour chart from bullish to bearish, a trend it had maintained for the past few weeks.
What’s the next expected move?
The current rise is considered a corrective move aiming to retest the 44,723.87 level, before likely dropping again to target 44,320.29. The bearish outlook would be invalidated if the price rises above 44,880.90 and closes a 4-hour candle above
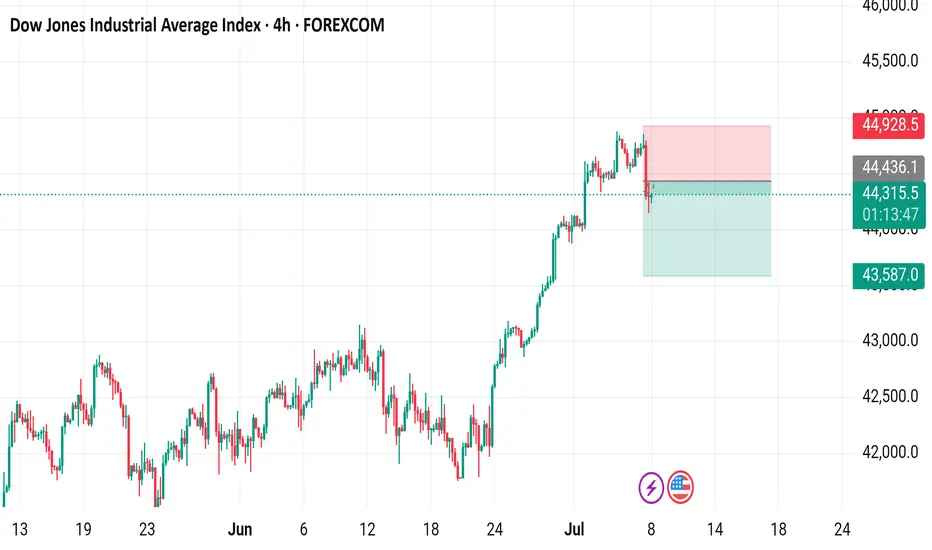
Dow Jones Industrial Average Index - 4h Chart (FOREXCOM)4-hour candlestick chart of the Dow Jones Industrial Average Index (US30) showing the price movement from late June to early July 2025. The current price is 44,314.0, with a slight increase of +23.0 (+0.05%). The chart includes buy and sell signals at 44,316.5 and 44,310.5 respectively, with highlighted resistance and support zones. The index has shown a general upward trend with some volatility over the period.
Dow Jones Below Key Pivot – Tariff Talks to Define Next MoveDow Jones – Overview
Fundamental Outlook:
In April, President Trump capped all so-called reciprocal tariffs at 10% until July 9, giving room for trade negotiations with key partners. That same month, the Nasdaq slipped into bear market territory, while the Dow and S&P 500 entered correction zones.
Since then, Wall Street has rebounded sharply. Last week, both the Nasdaq and S&P 500 surged to all-time highs, driven by a strong labor market that helped ease recession fears.
Technical Outlook:
Currently, Dow Jones is trading below the pivot level at 44410, which signals ongoing bearish momentum.
A sustained move below 44410 supports further downside toward 44180, with a break below this level opening the path to 43960.
However, if price reverses and closes above 44410 on the 1H or 4H timeframe, it may trigger a bullish move targeting 44750 and beyond.
Support: 44180 / 43960 / 43770
Resistance: 44515 / 44750 / 45100
Note:
Progress in tariff negotiations would likely support further upside in U.S. indices.
Lack of resolution may keep the Dow under bearish pressure in the short term.
Market ViewMarket Structure Shift
Previous Day Low Breach
London Session
Divergence
Watch
Trade
Manage
Smile
