CKB/USDT LongIt has passes every resistance and re-tested the last support so I think it can easily get me 15% target
CKBUSDT trade ideas

CKBUSDT IDEAUPDATE
Finally Hits Our Complete Target Almost +115% Profit Done✅
COIN DETAILS
The live price of Nervos Network is $ 0.005808 per (CKB / USD) with a current market cap of $ 252.77M USD. 24-hour trading volume is $ 24.28M USD. CKB to USD price is updated in real-time. Nervos Network is +22.40% in the last 24 hours with a circulating supply of 43.52B.

CKBUSDTPreferably suitable for scalping and accurate as long as you watch carefully the price action with the drawn areas.
With your likes and comments, you give me enough energy to provide the best analysis on an ongoing basis.
And if you needed any analysis that was not on the page, you can ask me with a comment or a personal message..
Enjoy Trading... ;)

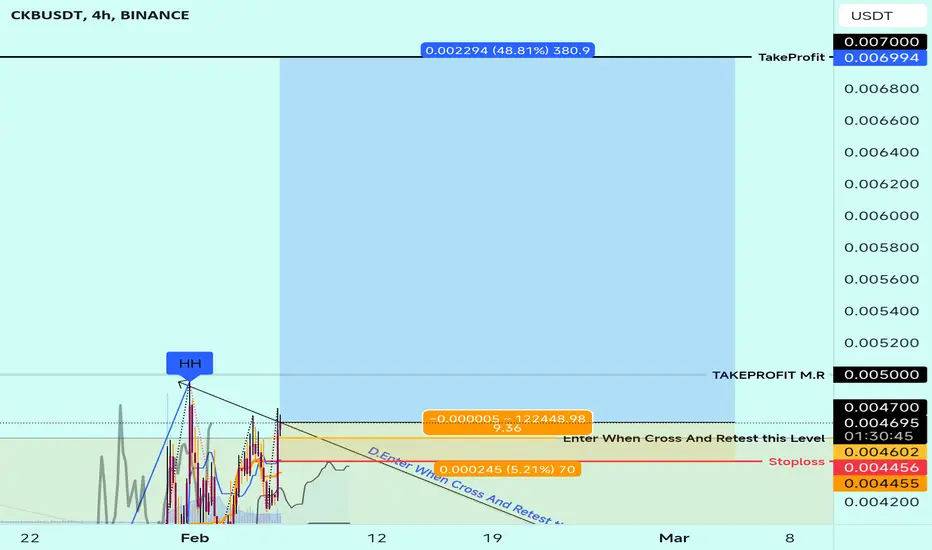
CKB 1hr time frame broke out of resistance zone CKB 1hr time frame broke out of resistance zone
and retested ... now crossing it's previous high
Market Cap : 250M
Category : DeFi
Enter at current price with lower bid in support zone
Targets 0.006892 / 0.008098 / 0.009190
Stop Loss 0.005254
This is for ENTERTAINMENT purpose Only.
Not Financial Advise
Always DYOR ( do your own research )

CKBULL FLAGSHIP CKB has undergone consolidation within multiple descending parallel channels. Following a break and retest of the initial parallel channel, signaling the beginning of a bullish trend, we anticipate the price to advance towards the subsequent resistance of the second channel and ultimately reach the third channel. A breach of the final descending parallel channel will confirm the continuation of the bullish trend.

CKBULL FLAGSHIP CKB has undergone consolidation within multiple descending parallel channels. Following a break and retest of the initial parallel channel, signaling the beginning of a bullish trend, we anticipate the price to advance towards the subsequent resistance of the second channel and ultimately reach the third channel. A breach of the final descending parallel channel will confirm the continuation of the bullish trend.

CKBUSDT(Nervos Network) Daily tf Range Updated till 06-02-24CKBUSDT(Nervos Network) Daily timeframe range. 0.003966 range level holding strong for now. 0.005078 is not far away clearing it up will give it a advantage here. but for that 0.003966 needs to hold.

CKB " Price Surge Alert! 📈 - Your Path to Wealth Starts Here"## CKB Coin: Fundamentals & Recent News
**Fundamentals:**
* **Nervos Network's native token:** CKB powers the Nervos Network, a modular public blockchain infrastructure aiming for universal asset programmability.
* **Unique architecture:** Utilizes a layered Proof-of-Work (PoW) consensus for security and a separate Layer 2 for scaling, enabling high transaction throughput.
* **Interoperability focus:** Designed to seamlessly interact with various blockchains and Layer 2 solutions, promoting a broader crypto ecosystem.
* **Tokenomics:** Fixed total supply, emission schedule designed for long-term sustainability, and mechanisms to incentivize network participants.
**Recent News:**
* **Mainnet upgrade "Godwoken" launched in December 2023:** Enables faster and cheaper smart contract execution on Nervos, potentially boosting developer adoption.
* **Growing ecosystem:** Increasing number of projects building on Nervos, including DeFi, NFTs, and gaming applications.
* **Strategic partnerships:** Collaborations with industry players like Chainlink and Filecoin expanding Nervos' reach and functionality.
* **Price performance:** CKB has seen significant volatility in 2024, currently down from its November 2023 highs.
**Please note:** This information is not financial advice and should not be considered as such. It is crucial to conduct your own research before making any investment decisions.
**Additional Resources:**
Remember, investing in any cryptocurrency carries inherent risks. Always invest responsibly and only with what you can afford to lose.
CKBUSDT ?
Tested this level in Nov n Dec 23.
Whats good is that.. stabilize at this price for few days.
f it could trade @ 0.0046/47 would be good
We ll see how
All the best
New in this space.

CKBUSDT is bearish trend CKBUSDT is bearish trend
So can trade through Sell stop and Stop loss is last LH

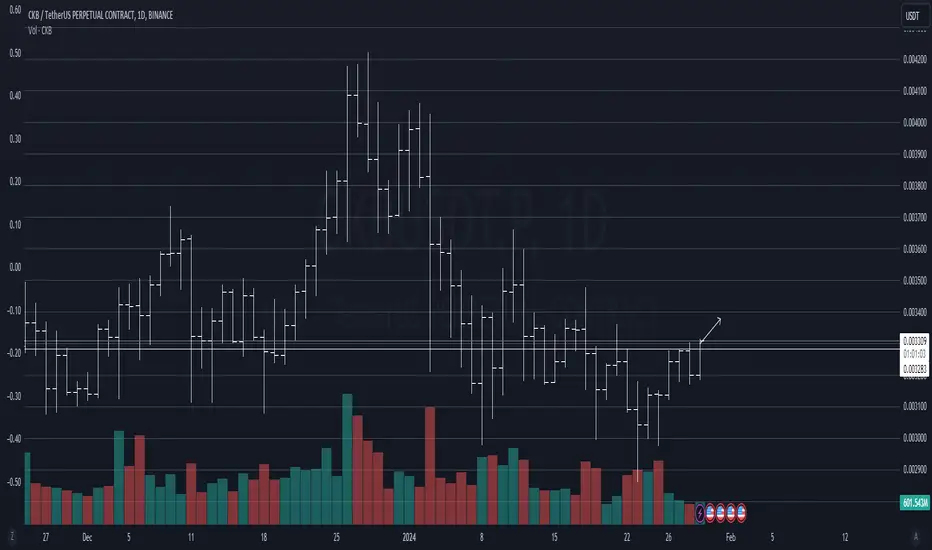
CKBUSDT(Nervos Network) Daily tf Range Updated till 01-02-24CKBUSDT(Nervos Network) Daily timeframe range. tried at 0.004823 but failed its holding close if it can break out of 0.004823 clean than till 0.006213 is a clear way. if not than back to 0.003777.

CKBUSDT IDEAUPDATE
Ckb has Breaking Descending Triangle in Weekly TF.
Successful Breakout can lead 85-90% Bullish move !!!
COIN DETAILS
The live price of Nervos Network is $ 0.004111 per (CKB / USD) with a current market cap of $ 178.57M USD. 24-hour trading volume is $ 71.02M USD. CKB to USD price is updated in real-time. Nervos Network is +24.78% in the last 24 hours with a circulating supply of 43.44B. CKB Price History USD.

CKB IS VERY BULLISH (1D)We are in a large diamond diametric that looks like the E wave is over.
By maintaining the green area, it can be pumped up.
Please note that the time frame is daily and time consuming.
For risk management, please don't forget stop loss and capital management
Comment if you have any questions
Thank You

Nervous is making us nervousWith good volume and multiple buy prints we expect that 0.04 area another resistance and if it passes than then more fireworks. DYOR

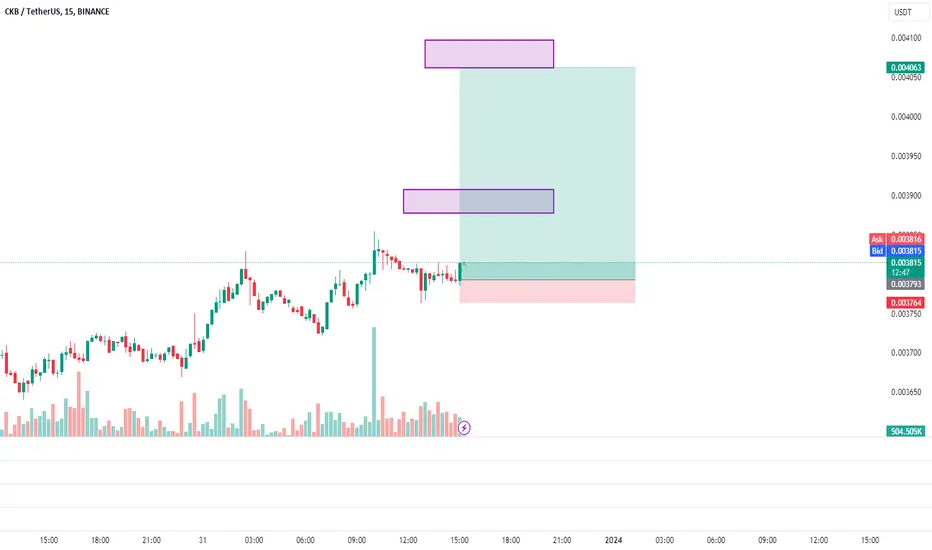
Long from Day level, accumulation before level, free zone afterLong from Day level, accumulation before level, free zone after
CkbHi guys
I’m going to new position for 2 target
I’m bullish
Break trend line
Moving averages strategy

The key is whether it can rise above 0.003906Hello traders!
If you "Follow" us, you can always get new information quickly.
Please also click “Boost”.
Have a good day.
-------------------------------------
(CKBUSDT chart)
(1D chart)
An important volume profile section is forming around 0.003906.
Accordingly, the key is whether the price can be maintained by rising above 0.003906.
However, a full-fledged upward trend is expected to begin only when the price rises above 0.006045.
If the price remains above 0.003120, which is the upper point of the box section of the HA-Low indicator, it is expected that there will be an attempt to rise above 0.003906.
Otherwise, it is expected to touch around the HA-Low indicator point of 0.002708-0.002870.
Buying at low prices is one way to earn greater profits, but you must be careful because it may take a long time for prices to rise if there is no confirmation that they are going up.
Currently, the point where CKB is preparing to rise is above the 0.003906 point.
Have a good time.
thank you
--------------------------------------------------
- The big picture
The full-fledged upward trend is expected to begin when the price rises above 29K.
This is the section expected to be touched in the next bull market, 81K-95K.
#BTCUSD 12M
1st: 44234.54
2nd: 61383.23
3rd: 89126.41
101875.70-106275.10 (when overshooting)
4th: 13401.28
151166.97-157451.83 (when overshooting)
5th: 178910.15
These are points that are likely to encounter resistance in the future.
We need to see if we can break through these points upward.
Since it is thought that a new trend can be created in the overshooting area, you should check the movement when this area is touched.
If the general upward trend continues until 2025, it is expected to rise to around 57014.33 and then create a pull back pattern.
1st: 43833.05
2nd: 32992.55
-------------------------------------------------- -------------------------------------------
** All explanations are for reference only and do not guarantee profit or loss in investment.
** Trading volume is displayed as a candle body based on 10EMA.
How to display (in order from darkest to darkest)
More than 3 times the trading volume of 10EMA > 2.5 times > 2.0 times > 1.25 times > Trading volume below 10EMA
** Even if you know other people’s know-how, it takes a considerable amount of time to make it your own.
** This chart was created using my know-how.
---------------------------------

600 days below 0.005 resistance accumulation phases below 0.004 is almost over.
or next resistance is:
0.0055
then
0.13 ( 300% upside ) ckb seen a very slow momentum in the last 2 years.
with the low market cap of 130M, ckb can 10-20x in the upcoming bull run.

go upthis is the same as my previous technical analysis idea ... i have illustrate all the tp and the sl and the entry point and so on .. do whatever you want to do on your own risk ... this is not a trading advice ..
CKB primed for a $0.25+ price valueCKB is one of the most undervalued quantum computing focused crypto tokens currently available on the market to date.
At these sub 0.01 cent levels it’s beyond a bargain. With product rolling out it’s inevitable that CKB breaks loose and jumps swiftly to its proper price value between 0.25-0.50 cents
We are likely to see these prices and possibly more as we go into BTC halving, ETF approval etc.
Don’t miss a trade like this, we only see 3-4 trades of this scale per cycle. Being as this upcoming cycle will be a super cycle, we are talking about mid 6 to low 7 figure profits from CKB
TP 1: 0.143
TP 2: 0.255
TP 3: 0.496
TP 4: 0.75

CKB USDT (Long Trade Setup) Technical Analysis behind CKB USDT trade:
1. Resistance Breakout & Supported by the immediate support area.
2. Three White Soldiers Candlestick pattern formed, a bullish sign.
3. Supported by the 100 Days SMA.
4. RSI is at 70, a bullish sign.
5. Volume & Momentum analysis also supports the trade.
6. The stop loss is based on the volatility indicator (ATR)

CKBUSDTCKBUSDT
looking bullish on
wh indicator ,
buying setup set
target set
and sl
all of them in 1 chart :)

CRYPTO : CKBUSDTHM signal (High momentum) spotted. Looking good with previous wave up with increasing volume and momentum.
- Price experience increase in buying pressure without much selling
- support at Zone @ 0.003584 - 0.003660
It is potentially trending up higher with increase of strength and momentum.
