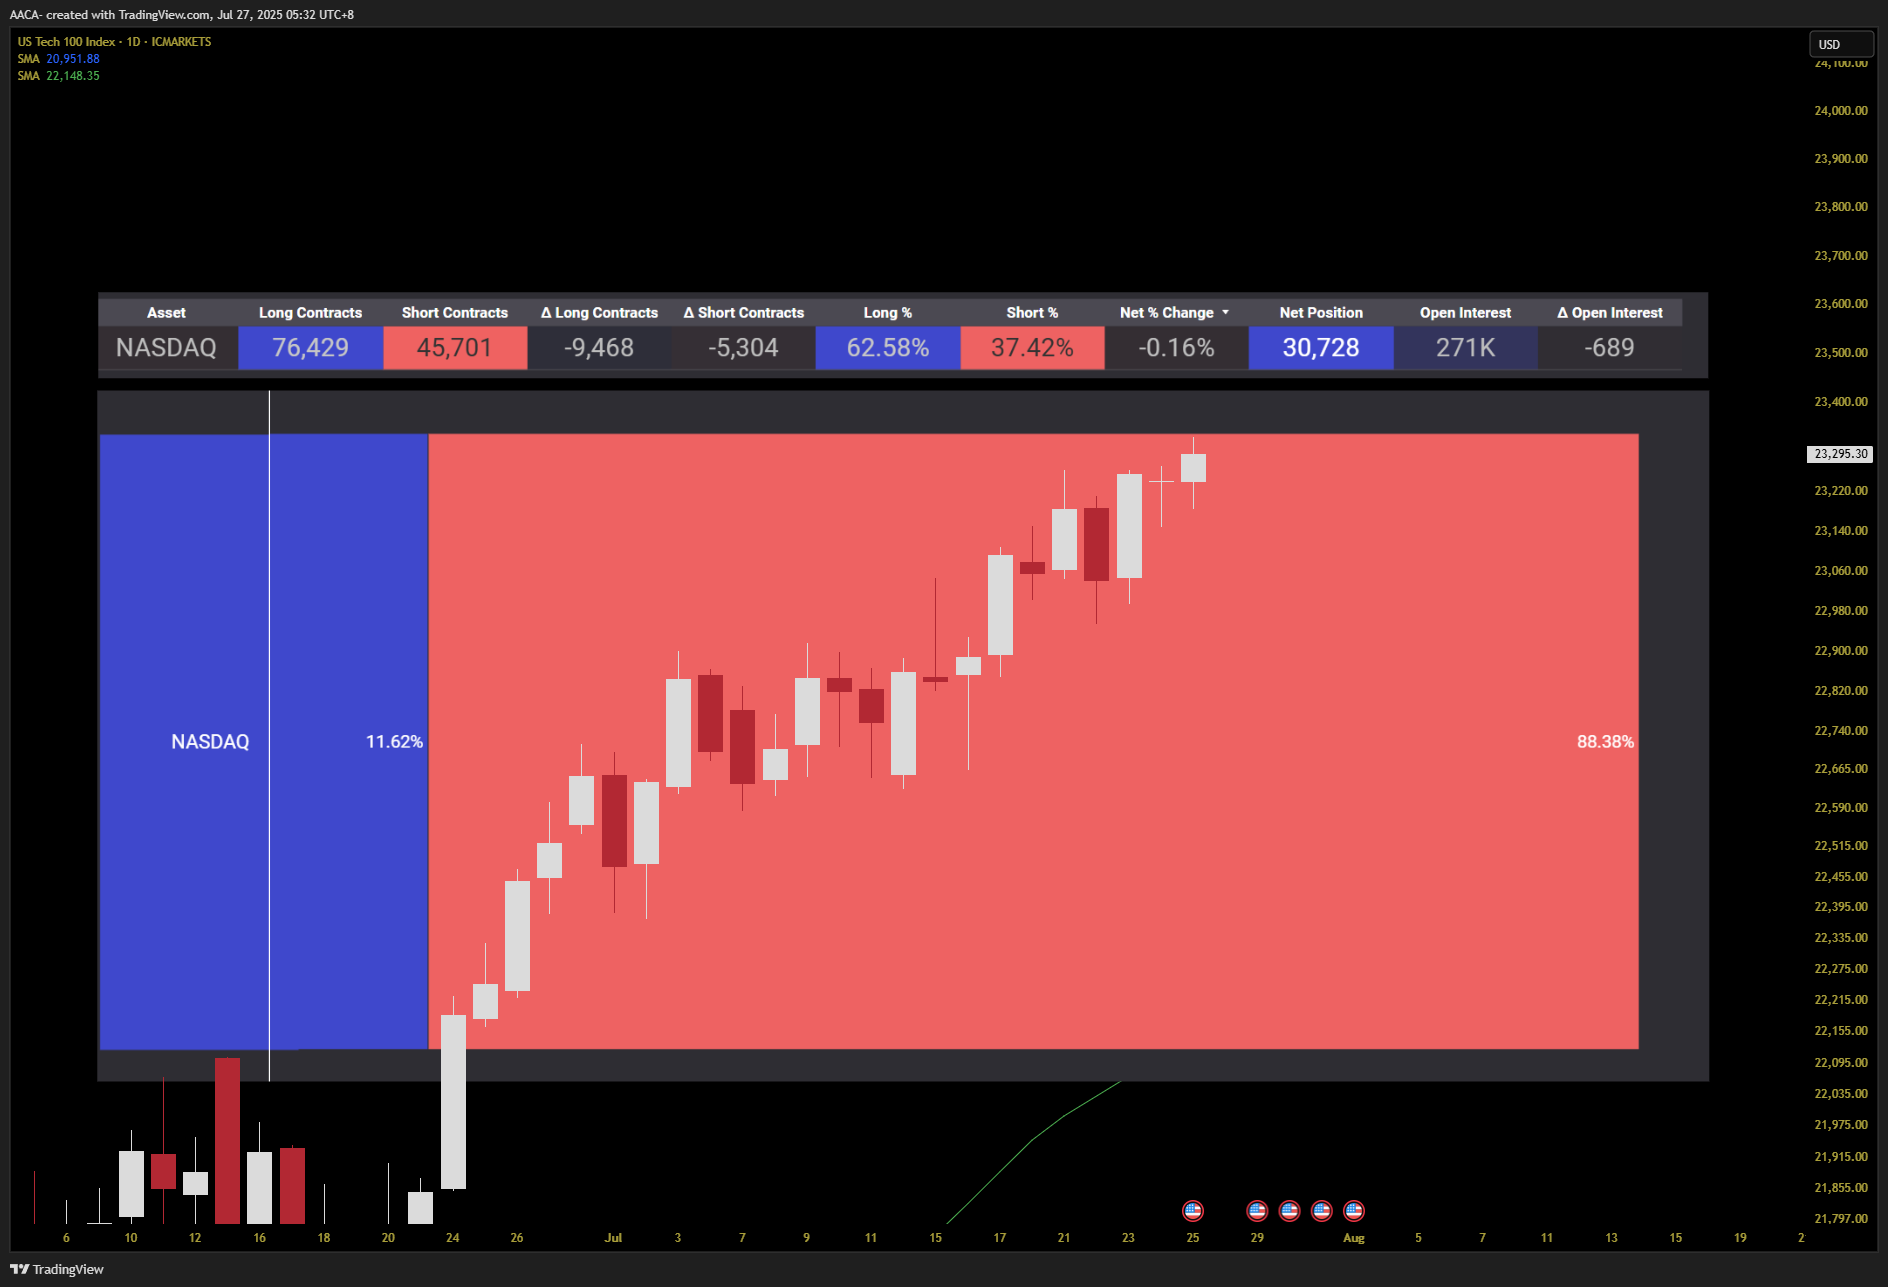
US NDAQ 100 - CashUS NDAQ 100 - CashUS NDAQ 100 - Cash

US NDAQ 100 - Cash

No trades
See on Supercharts

US NDAQ 100 - Cash forum


NAS100USD SPX500USD
Make trading as simple or as complex as you like but it’s certainly not a coin toss, even if some treat it that way.

I’ve said it before and I’ll say it again: respect yourself and your account. Don’t throw away equity on impulse. Don’t enter trades without knowing why you’re in them.

You owe it to yourself and your loved ones to protect that capital.

Mitigate and manage risk, accumulate and Take Profit, Not Chances.
Snapshot

NAS100
1/1 NASDAQ Daily Market Analysis—May 29, 2025

Introduction

The NASDAQ market has been a focal point for traders and investors alike, especially with the current live price hovering around 21,700 USD. This analysis aims to provide a comprehensive overview of the market using various technical indicators, including Fibonacci retracement levels, exponential moving averages (EMA), RSI divergence, and more. We will explore both the daily and 4-hour time frames to identify key support and resistance levels, along with insights into the upcoming USD news that could impact market dynamics.

Market Overview

Current Price: 21,700 USD

As we delve into the technical analysis, we will utilize the following indicators:

Support & Resistance Levels

Fibonacci Retracement Levels

Exponential Moving Averages (EMA)

RSI Divergence
Order Blocks
MACD

Weekly and Daily Pivots

Technical Analysis

Support & Resistance Levels

Daily Time Frame:

Support Levels:

Level 1: 20,659 (Swing High)
Level 2: 20,500
Level 3: 20,331 (Swing Low)

Resistance Levels:

Level 1: 21,800
Level 2: 22,000
Level 3: 22,300

4-Hour Time Frame:

Support Levels:

Level 1: 20,400
Level 2: 20,250
Level 3: 20,100

Resistance Levels:

Level 1: 21,750
Level 2: 21,900
Level 3: 22,050

Fibonacci Retracement Levels

Using the recent swing high of 20,659 and swing low of 20,331, we can identify the Fibonacci retracement levels:

23.6% Level: 20,616
38.2% Level: 20,590
50% Level: 20,495
61.8% Level: 20,400
76.4% Level: 20,300

These levels are crucial for identifying potential reversal points in the market.

Exponential Moving Averages (EMA)

Daily Time Frame:

EMA 50: 20,650
EMA 100: 20,750
EMA 200: 20,900
EMA 400: 21,200

4-Hour Time Frame:

EMA 50: 20,600
EMA 100: 20,700
EMA 200: 20,800
EMA 400: 21,000

The EMAs help to determine the market's trend direction and potential reversal points.

RSI Divergence

The Relative Strength Index (RSI) is currently showing a divergence on the daily time frame. As the price reaches higher levels, the RSI is failing to confirm these highs, indicating potential weakness in the current bullish momentum. This divergence suggests that traders should be cautious about entering long positions.

Order Blocks

Identifying order blocks on both time frames reveals significant areas where institutional buying or selling has occurred:

Daily Order Block: Located around 20,500, indicating strong buying interest.
4-Hour Order Block: Found near 20,400, suggesting potential support.

MACD Analysis

The Moving Average Convergence Divergence (MACD) indicator is currently showing a bullish crossover on the daily time frame, indicating potential upward momentum. However, traders should monitor for any signs of weakening momentum, especially in light of the RSI divergence.

Summary of Key Levels

Daily & 4-Hour Support and Resistance

Daily Support Levels: 20,659, 20,500, 20,331
Daily Resistance Levels: 21,800, 22,000, 22,300
4-Hour Support Levels: 20,400, 20,250, 20,100
4-Hour Resistance Levels: 21,750, 21,900, 22,050

Exponential Moving Average (EMA) Levels

Daily EMA Levels:

EMA 50: 20,650
EMA 100: 20,750
EMA 200: 20,900
EMA 400: 21,200

4-Hour EMA Levels:

EMA 50: 20,600
EMA 100: 20,700
EMA 200: 20,800
EMA 400: 21,000

Weekly Pivots

Pivot Point: 21,100
Resistance 1: 21,350
Support 1: 20,850

Daily Pivots

Pivot Point: 21,200
Resistance 1: 21,400
Support 1: 21,000

Fibonacci Retracement Levels

23.6% Level: 20,616
38.2% Level: 20,590
50% Level: 20,495
61.8% Level: 20,400
76.4% Level: 20,300

Fundamental Analysis and Upcoming USD News

📅 As we look ahead, it's essential to monitor upcoming economic events that could impact the NASDAQ market. Key USD news to watch for includes:

Non-Farm Payrolls (NFP): Scheduled for the first Friday of June. This report will provide insights into employment trends and can significantly influence market sentiment.
Consumer Price Index (CPI): Set to be released mid-June, this data will shed light on inflation trends,

NAS100 if the bounce on 21700 is confirmed it could be an occasion to enter..also this news on the tariffs judge ruling is huge..now they have 10days to eliminate some of the tariffs… if this does not bring us to ATH o don’t know what it will

NAS100USD

Hint of the day:

If you love your account and want to see some good results today...

Do not miss the HL of the day...be patient
try smaller lot sizes at first and then scale up over time.
Snapshot

NAS100 Also another thing to take note of,

Short = Short term trades

Long = Long term trades

You CAN NOT have a long term bearish view on an index that has only appreciated in price (and will only appreciate in price) over the largest time frames.

You will be 100x more likely to win a trade by buying a dip than shorting a “top”, tops are there to be broken. and they will get broken and not just broken but absolutely smashed. purposefully to liquidate those who are trying to short a top.

If you shorted at 16.5k area, all i can say is good luck as i don’t think we will see it ever again, however if you longed the old ATH, well now your almost at break even and well done for holding (if you used proper risk management you wouldn’t have closed)

Read lines 2 and 3 again if that doesn’t make sense.

NAS100USD

I get these comments from time to time that I am silent when the market is selling and it is not bullish and they followed me and got their account blown and a whole host of complaints...yaada yaddah yaaadah...

Here is my response:

1. I am not a signal company or service.

2. I share elements of my strategy that I know work 100%

3. I have said time and time again when you are learning or
developing a strategy for yourself...use a demo account.

4. Do your own analysis and trade what you see...

5. Understand risk management...you must understand your
risk percentage that your account can handle before
taking trades...I have accounts that can go for weeks and
months in drawdown because of the lot sizes I commit
to.

6. If you cannot make money on a demo account, you will
never be consistently successful on a live acccount.

7. There are no consistently successful traders who rely on
signals from other people

8. If the market is in a bearish retracement, I wait or if the
retracement is worth it, I can trade a small position and
take my profits out on the HL

9. Stop blaming others for your own screw ups...get a demo
and try again...we have all had days when accounts were
blown...you are not the first and you certainly will not
be the last...(What do you need a cookie?...this is not a
sport for cry babies this is real life stuff...the sooner you
realize this, the better for you)

I make no apologies to people that loose at trading when trying to understand a strategy...that is the tuition for learning.

YOu will never be successful until you learn how to consistently loose and fix what is causing you to loose.

So if you are serious at becoming the 1 - 5% of traders who are successful;

Get up...
Brush yourself off...
Open a demo account...
Practice...
Stop blaming others for your own screw ups (they never entered the trade for you)...
Try...
Try...
And try again...

You do not get to be the best at anything by following...
That only comes by creating and innovating....

I am Chris Auber and I approve this message

HL's to HH's GUARANTEED!

#oneauberstrategy
Snapshot

NAS100 At least it finally broke that pesky 21500 zone, today could retest that zone so be careful. The daily candle has already moved a large amount so i expect maybe a pullback during the NY session today.

Let’s wait and see

🧠 NAS100USD – Gamma Broken, Momentum Unleashed ⚡
📍 Live Price: 21,742.1
📈 Change: +1.23% (+263.7 pts)
🎯 Gamma Peak: 21,318
📌 Max Pain: 21,175

🔥 What’s Happening?
Price has decisively broken out above the gamma wall at 21,318, rejecting any idea of dealer pinning for now. This is a classic gamma unwind — upside flow becomes self-reinforcing as dealers chase hedges.

✅ Implications
We’re in uncharted gamma territory

Every dip above 21,420 = buy-the-dip zone

Watch for momentum targeting 21,800–21,900 short-term

⚠️ Risk
Volatility rises when above gamma peaks — expect whip and pullbacks

Any drop back under 21,420 = ⚠️ fading momentum

Flow says: Bulls are pressing advantage — don’t fade strength.

Take Profits, Not Chances. Manage Risks to Accumulate.

#NAS100USD #NASDAQ #GammaUnwind #OptionsFlow #MomentumFlow #TitanProtect
Snapshot

NAS100 sometime some trader forget that behind an index there are real company that influence the market. Yesterday those that were fixated on nvdia vs their TA were ready to react not based on pre-conceived positions but based on the market..this could have gone either way ..and make happy all the bear , if the results were bad instead the happy are the bull as today ..the key was not to predict..the key was to be ready at close yesterday ..will we have an ATH ? For sure ! Will we have a major pull back may be on Friday after CPE? May be .and the bear will say I told you …but the timing..wrong ? Bottom line taking a position based on TA before an event where we have no control is just not smart…..stay humble , stay super informed and stay ready to commit when you know !
PS and Sorry if you think you waste your time reading …

🧠 Markets Surge Amid NVDA Blowout & Political Pushback

NAS100USD SPX500USD

📈 Indices are ripping higher post-NVDA earnings, which smashed expectations and reinforced the AI growth narrative. NVDA continues to act as the gravity well for tech.

Meanwhile…

⚖️ A federal court has blocked Trump’s ‘Liberation Day’ tariffs, ruling them an overreach of executive power. This eases trade war concerns and reaffirms Congressional authority over tariff setting.

Together, these two headlines remove near-term macro overhangs — AI optimism + reduced trade risk = risk-on.

📌 Add to that fund managers still being underweight US equities (per BofA), and the stage is set for forced participation.

Let price confirm, but the backdrop just turned more bullish.

Take Profits, Not Chances.
Snapshot