Intro to my python-tradingview strategyAfter three years working on multiple trading strategies, I decided to share my experience and my trades. But before going live, I think I need to explain the roadmap I’ve followed so far.
I initially started coding my strategy in PineScript, which is a powerful tool. It allowed me to simply code my ideas and turn them into trading signals using alerts and conditions. I’m sure you’ve already watched dozens of YouTube videos on how to use webhooks and TradingView to send signals to your trading platform. Anyway, I began developing my strategy in Pine and used webhooks to connect to Tradovate. I went live after a few months of testing—which, of course, was my first mistake. In January 2022, my algo went live. I traded on a strategy that was just tuned on seen data, manually flipping parameters to maximize PnL—a purely overfit model—and I went live with real money. Anyway, the first month was positive and I thought I was the best trader in the world. I even told my wife we were going to be rich, like nothing could stop us. But after three months of trading, I lost—obviously. It was a bummer, but I knew where the problem was: lack of proper backtesting.
So that was the moment I moved my code to Python. It took me a couple of weeks to build an end-to-end backtesting framework in Python. I used Backtrader as a backtesting tool, which is awesome. I’ll have some videos soon to explain more about that. Anyway, moving my code to Python gave me the luxury of backtesting and creating rolling walk-forward optimizations, allowing me not only to refine my strategies but also to test them on 5–6 years of historical data.
Long story short, working with Python enabled me to come up with five different strategies for NQ and ES. I plan to share those trades, but before that, I thought I should share my journey first.
Please leave comments and follow my channel. More to come.
NDAQ100M2025 trade ideas

NQ Range (06-09-25)TACO Trade LONG, China will increase the US Tariffs, we reduce the China and the NAZ will increase, Bunker will spin it and you will scratch your head. Don't worry it is upside down world, just go with it and SHORT it on Tuesday. Following the white arrow until stal out or rejection near channel bottom above.

The SECRET is Compounding Tiny Objectives & Finding SatisfactionIn this video I talk about what I don't really find people talking about, which is how important it is to find satisfaction in your trading. When I say 'satisfaction', I am talking about the monetary kind. What do I mean by this?
A problem I used to have in my earlier days was over-trading, revenge trading, blowing accounts, the usual story. I even had a decently high win-rate and I was good at understanding price. What I discovered was that I was not finding satisfaction because I was not risking enough on my trades. You see.. my strategy had a high win-rate with a positive R average, but the setups did not appear that often. Not as rare as a unicorn, but still, I'd have to sit around and wait and wait and wait. By the time my setup came, I put on a small risk, and I won small. Subconsciously, I found that quite frustrating, even though I was actually winning most of my trades. You can imagine how I felt when I lost a trade. I felt like I invested all that time for nothing. One could argue that I was being careful, but the problem was I was being too careful. I age the same as everyone else, and everyone else ages the same as me. I am investing my time into this strategy, time I will never get back. If I am not utilizing my time in relation to the earning potential, then that is a bad investment. Being a psychologically prone person, I made it a serious rule that all my criteria for my setup must be hit before I take that trade, no exceptions. I kept myself on the higher timeframes so that my mental state can safely process what I needed to process, whether it was analytical or just psychological.
Another point was getting over what others were showcasing or doing. Material luxuries and large wins are all subjective things. It was frustrating seeing people trade every single day, most of them with green days. I felt like I had to do the same too to be a good trader. I was WRONG. What I actually need to do was make my system work for me, and that included how I implemented risk and what was satisfying enough for me to pursue. Like I said in the video, if what you want to do is not interesting or attractive to you, you won't want to do it. As long as what you want to do makes sense and isn't you trying to go from zero to a hundred in 2.5 seconds. As the title says, compound tiny objectives but make it satisfying in terms of risk and your time invested.
- R2F Trading

NQ Short (06-02-25)H/S playing out with drop test on deck. Short below KL 562 and Long above, expect the same tricks/games during the O/N and Dead Zone of Reg Session. Boring days as we wait for some selling to show up as the buyers are losing steam.
NDX - DAY TRADE - LONG & SHORT SET UPSGood Morning,
Day trade set up for Nasdaq. All long and short levels are listed in the chart!
Enjoy!

Will Musk–Trump Ceasefire Fuel Friday Rebound?Thursday’s Tesla-driven sell-off in Nasdaq 100 futures may flip into a Friday squeeze ahead of nonfarm payrolls, with Politico reporting that Elon Musk and Donald Trump have a scheduled phone call later today to broker a peace deal.
Given their sparring on Thursday was a key factor behind the Nasdaq nosedive, the headlines could help reverse the move into the European session.
Traders may look to establish longs with a stop beneath the intersection of minor horizontal and uptrend support near 21,436. Thursday’s session high screens as a potential target. If the headlines are refuted—or price action fails to respond—both could be grounds to cut the trade.
Good luck!
DS

Volume Speaks Louder: My Custom Volume Indicator for Futures
My Indicator Philosophy: Think Complex, Model Simple
In my first “Modeling 101” class as an undergrad, I learned a mantra that’s stuck with me ever since: “Think complex, but model simple.” In other words, you can imagine all the complexities of a system, but your actual model doesn’t have to be a giant non-convex, nonlinear neural network or LLM—sometimes a straightforward, rule-based approach is all you need.
With that principle in mind, and given my passion for trading, I set out to invent an indicator that was both unique and useful. I knew countless indicators already existed, each reflecting its creator’s priorities—but none captured my goal: seeing what traders themselves are thinking in real time . After all, news is one driver of the market, but you can’t control or predict news. What you can observe is how traders react—especially intraday—so I wanted a simple way to gauge that reaction.
Why intraday volume ? Most retail traders (myself included) focus on shorter timeframes. When they decide to jump into a trade, they’re thinking within the boundaries of a single trading day. They rarely carry yesterday’s logic into today—everything “resets” overnight. If I wanted to see what intraday traders were thinking, I needed something that also resets daily. Price alone didn’t do it, because price continuously moves and never truly “starts over” each morning. Volume, however, does reset at the close. And volume behaves like buying/selling pressure—except that raw volume numbers are always positive, so they don’t tell you who is winning: buyers or sellers?
To turn volume into a “signed” metric, I simply use the candle’s color as a sign function. In Pine Script, that looks like:
isGreenBar = close >= open
isRedBar = close < open
if (not na(priceAtStartHour))
summedVolume += isGreenBar ? volume : -volume
This way, green candles add volume and red candles subtract volume, giving me positive values when buying pressure dominates and negative values when selling pressure dominates. By summing those signed volumes throughout the day, I get a single metric—let’s call it SummedVolume—that truly reflects intraday sentiment.
Because I focus on futures markets (which have a session close at 18:00 ET), SummedVolume needs to reset exactly at session close. In Pine, that reset is as simple as:
if (isStartOfSession())
priceAtStartHour := close
summedVolume := 0.0
Once that bar (6 PM ET) appears, everything zeroes out and a fresh count begins.
SummedVolume isn’t just descriptive—it generates actionable signals. When SummedVolume rises above a user-defined Long Threshold, that suggests intraday buying pressure is strong enough to consider a long entry. Conversely, when SummedVolume falls below a Short Threshold, that points to below-the-surface selling pressure, flagging a potential short. You can fine-tune those thresholds however you like, but the core idea remains:
• Positive SummedVolume ⇒ net buying pressure (bullish)
• Negative SummedVolume ⇒ net selling pressure (bearish)
Why do I think it works: Retail/intraday traders think in discrete days. They reset their mindset at the close. Volume naturally resets at session close, so by signing volume with candle color, I capture whether intraday participants are predominantly buying or selling—right now.
Once again: “Think complex, model simple.” My Daily Volume Delta (DVD) indicator may look deceptively simple, but five years of backtesting have proven its edge. It’s a standalone gauge of intraday sentiment, and it can easily be combined with other signals—moving averages, volatility bands, whatever you like—to amplify your strategy. So if you want a fresh lens on intraday momentum, give SummedVolume a try.

How to Identify Head and Shoulders?How to identify head and shoulders patterns?
We’ll use the current example from the Nasdaq or the US markets. We can quite clearly observe that a potential head and shoulders formation is developing. This means that if the price breaks below the neckline, we may see a deeper correction from the April low.
I will go through the rules on how to identify a head and shoulders formation.
We will also cover how to recognize when the pattern is invalid — meaning the market may continue pushing above its all-time high.
Finally, we’ll discuss how we can position ourselves early, before waiting for a break below the neckline for confirmation.
Micro Nikkei Futures
Ticker: MNQ
Minimum fluctuation:
0.25 index points = $0.50
Disclaimer:
• What presented here is not a recommendation, please consult your licensed broker.
• Our mission is to create lateral thinking skills for every investor and trader, knowing when to take a calculated risk with market uncertainty and a bolder risk when opportunity arises.
CME Real-time Market Data help identify trading set-ups in real-time and express my market views. If you have futures in your trading portfolio, you can check out on CME Group data plans available that suit your trading needs www.tradingview.com
Trading the Micro: www.cmegroup.com
www.cmegroup.com

Short MNQ/MNQ or /NQ broke 5 point upwards trend line earlier this week and is testing opposite trend line as I am writing this. This is also a retest of broken trend line. Stop loss above previous swing high and we’ll see if it dumps. If price breaks above opposite trend line theory is invalid.
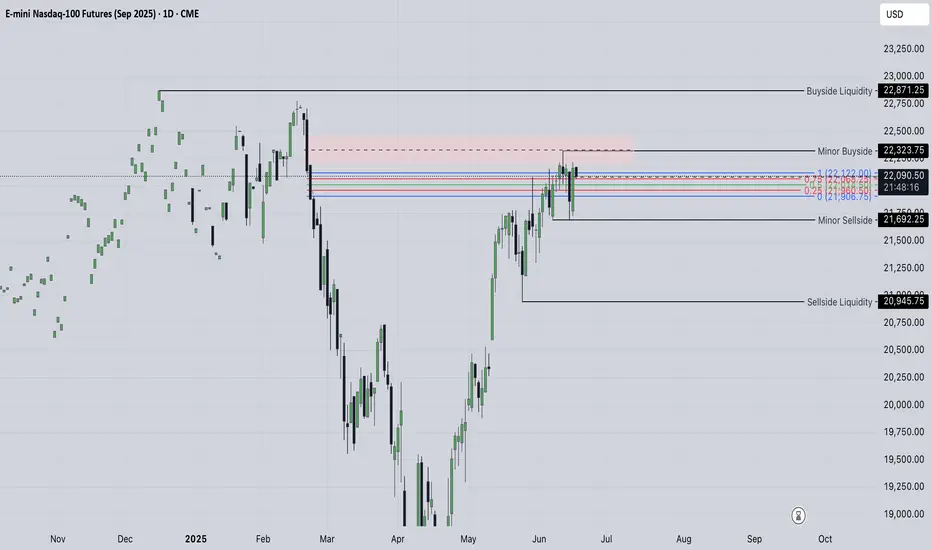
Nasdaq (NQ) Set to Complete 5 Waves, Defining Bullish TrendOn April 7, 2025, the Nasdaq (NQ), like other major global indices, marked a significant low, setting the stage for a potential bullish trend. From this low, the index has embarked on a five-wave impulsive rally. This a hallmark of bullish momentum in Elliott Wave theory. The initial advance, wave 1, peaked at 18,361.5. It was then followed by a corrective pullback in wave 2, which found support at 16,735. From there, the index resumed its upward trajectory in wave 3. The move up in wave 3 has an internal five-wave structure, signaling strong bullish momentum.
Within wave 3, the first sub-wave, ((i)), concluded at 19,386.75. Subsequent pullback in wave ((ii)) found support at 17,700. The index then surged higher in wave ((iii)), reaching 21,562. Afterwards, a corrective dip in wave ((iv)) ended at 20,725.04, as illustrated on the one-hour chart. This wave ((iv)) correction unfolded as a double-three Elliott Wave pattern. Wave (w) bottomed at 21,072.75 and wave (x) peaked at 21,337.5. The final leg, wave (y), concluded at 20,725.04, completing the correction.
The Nasdaq has since turned higher in wave ((v)). From the wave ((iv)) low, wave (i) advanced to 21,858.75, followed by a pullback in wave (ii) to 21,071.5. The index is now poised to extend higher in wave (iii) of ((v)), continuing the impulsive rally from the April 7 low. In the near term, as long as the pivotal low at 20,725.04 holds, any pullbacks are expected to find support in a 3, 7, or 11-swing pattern, paving the way for further upside. This technical setup suggests the Nasdaq is well-positioned to sustain its bullish momentum in the coming sessions, provided key support levels remain intact.
2025-06-17 - priceactiontds - daily update - nasdaq
Good Evening and I hope you are well.
comment: Big up, big down, big confusion. Market rallies 500 points yesterday and today we get a late bear breakout and close below 22000. Traps on both sides and I am not believing in bear strength what so ever. I see this as a triangle and 22000 is the middle. Chop chop.
current market cycle: trading range
key levels: 21700 - 22300
bull case: Bulls want to stay above 21900 and print a higher low to then re-test 22300. Today they were weak and let the bears close below 22000 which was unexpected, giving yesterday’s bullishness. Tomorrow we have FOMC and I doubt market can move far from 22000 tomorrow. Any longs closer to 21800 make sense.
Invalidation is below 21680.
bear case: Bears left behind a gap up to 22015 but I doubt it can stay open. We have to decent trend lines below us and bears would need to break strongly below 21900 to try and go for 800 or even 700. Bears do not have any arguments to go below 21700 so I won’t make up any. That doesn’t mean it can not happen but it’s unlikely.
Invalidation is above 22230.
short term: Completely neutral around 22000. Only interested in longs below 21900 and shorts closer to 22100.
medium-long term - Update from 2024-06-15: Daily close below 21450 is my validation for the new bear trend which has the first bigger target at 21000 but I think we will printed below 20000 again this year. Structure is obviously not yet bearish, so don’t be early if you want confirmation and can’t/won’t scale in to shorts higher.
trade of the day: Buy low, sell high and scalp. Clear range 22000 - 22100 and the late bear breakout was ok if you made your money before. I do think it was unusual that we did not close the gap to y close 22176.


RTH Setup - My potential everyday model.In the video we see my potential everyday model that I will be looking for, for the next 3-6 months.

Nasdaq Seek and Destroy. Play Patience Game.Patience.
both bullish and bearish idea are valid.
We're ahead of FOMC of tomorrow and we might get false movements / remain under range.
better to no try to rationalize the market here but rather let it showcase his will first.

NQ London Silver Bullet Time WIndowTurtle Soup NQ London target Monday Asian Low. Paper Trading. Reversal After Daily FVG H.

Are we about to see historic highs on the markets?Are we about to see historic highs on the markets?
In my previous article, I predicted that the trade war would soon be over and that the markets would resume their growth. This is exactly what is happening. I believe that stocks have bottomed out and I am positioning myself very bullishly ahead of the summer. Investors now have the opportunity to buy quality stocks at lower prices and use appropriate tools to make purchases at the right price. Maintaining calm during periods of market turbulence is of paramount importance.
The stock market always tends to grow in the long term and, thanks to the intervention of central banks and sometimes governments, manages to overcome moments of deep crisis. This was the case during significant events such as the attack on the Twin Towers in 2001, the Lehman Brothers crisis in 2008, and the Covid period in March 2020.
This dynamic is intrinsic to the history of the market itself. If you take a 20- or 30-year view of any major stock index, this trend is visible.
Therefore, although recent market declines may appear volatile or steep, they are not particularly serious in the context of the long-term trend, provided you have the time and ability to remain calm while waiting for the situation to stabilize.
Immagine
These moments can present buying opportunities for high-quality technology stocks that were previously expensive.
Despite the uncertainty, there are select opportunities when considering companies that continue to innovate by reinvesting their profits in research. These companies tend to emerge stronger from periods of crisis, especially if they have little debt and a loyal customer base.
This is particularly relevant for companies developing artificial intelligence and cloud infrastructure, such as Nvidia, Google Alphabet, and Microsoft Corp. Although these companies are not immune to cyclical difficulties, they continue to innovate internally.
Some companies, while not distributing dividends to shareholders, reinvest all their profits in equity and technological research. Now we will examine what, in my opinion, is the best index to invest in for the summer. It is well known that one of the Trump administration's main goals is to weaken the dollar, and this dynamic is indeed underway.
A weakening dollar has significant effects on American companies, with varying consequences depending on the sector and their exposure to global markets.
It is well known that a devaluation of the dollar leads to improved export competitiveness. Companies that sell products abroad benefit from a weaker dollar because their goods become cheaper for foreign customers, increasing demand and profits. This phenomenon favors industries such as technology, aerospace, and agriculture.
Immagine
The indices we will focus on for the summer are the Nasdaq US TECH 100 and the S&P 500, US 500. Technology companies benefit from a weaker dollar thanks to exports. In general, as I often say, large American companies with strong international revenues tend to benefit from a weak dollar, as foreign revenues increase in value when converted into dollars.
It is well known that Nvidia, Microsoft, and Apple shares have a significant influence on this index. A weak dollar can boost the profits of companies that generate a substantial portion of their revenues abroad, such as the companies mentioned above. As a result, the rise in these stocks could lead the indices to reach new all-time highs.
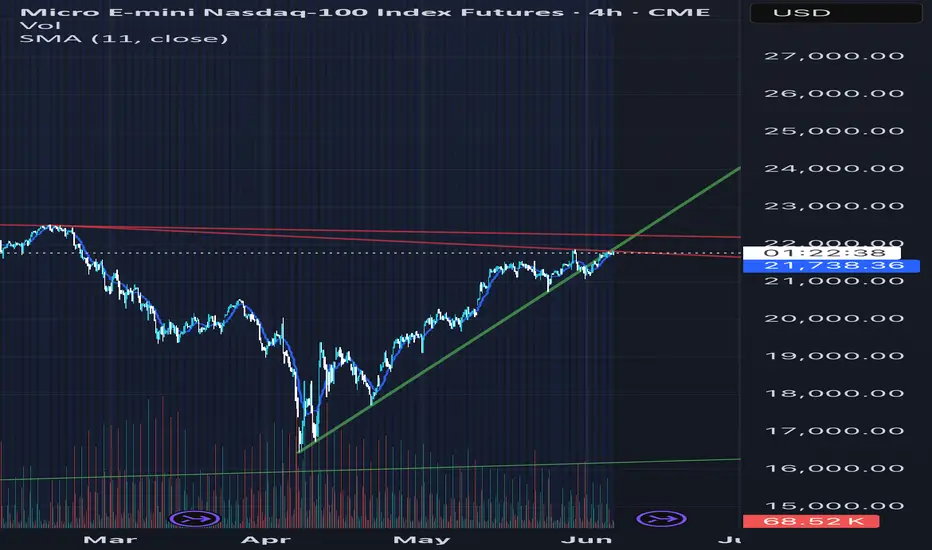
From a technical standpoint, chart analysis supports my purchases on the major US indices. Recent gains are in fact supported by above-average volumes, and prices remain above the 200-period moving average.
In addition, the latest news is positive. As expected, the trade war was short-lived, and the US and Europe have also reached an agreement on 10% tariffs.

NQ Power Range Report with FIB Ext - 6/17/2025 SessionCME_MINI:NQU2025
- PR High: 22177.25
- PR Low: 22065.25
- NZ Spread: 250.25
Key scheduled economic events:
08:30 | Retail Sales (Core|MoM)
Contract rollover week
Session Open Stats (As of 12:45 AM 6/17)
- Session Open ATR: 385.81
- Volume: 47K
- Open Int: 178K
- Trend Grade: Neutral
- From BA ATH: -3.5% (Rounded)
Key Levels (Rounded - Think of these as ranges)
- Long: 22096
- Mid: 20383
- Short: 19246
Keep in mind this is not speculation or a prediction. Only a report of the Power Range with Fib extensions for target hunting. Do your DD! You determine your risk tolerance. You are fully capable of making your own decisions.
BA: Back Adjusted
BuZ/BeZ: Bull Zone / Bear Zone
NZ: Neutral Zone

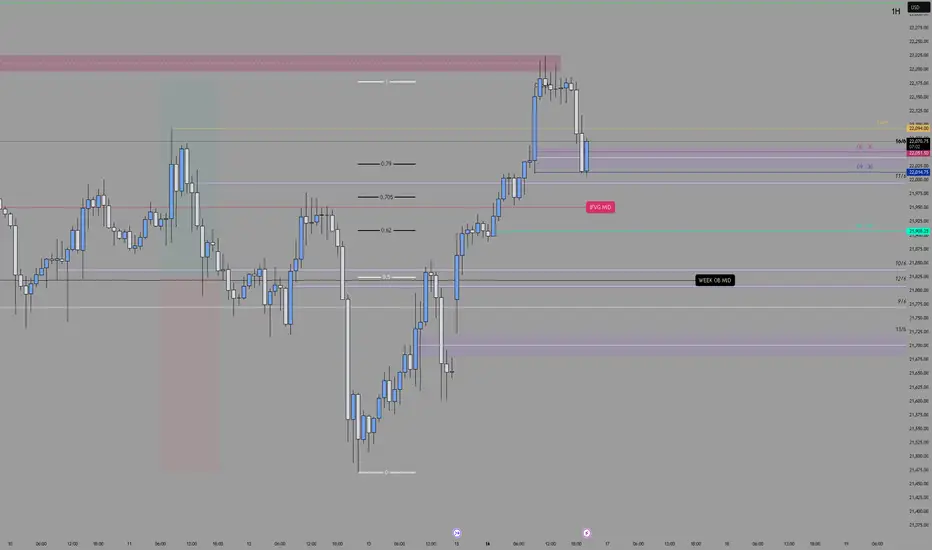
New Dealing Range in HTFAs I Expect The Po3 in my previous analysis and it perfectly projected after that price retraced with daily volume imbalance and tryin to come down...also I found a new dealing range on 4Hr
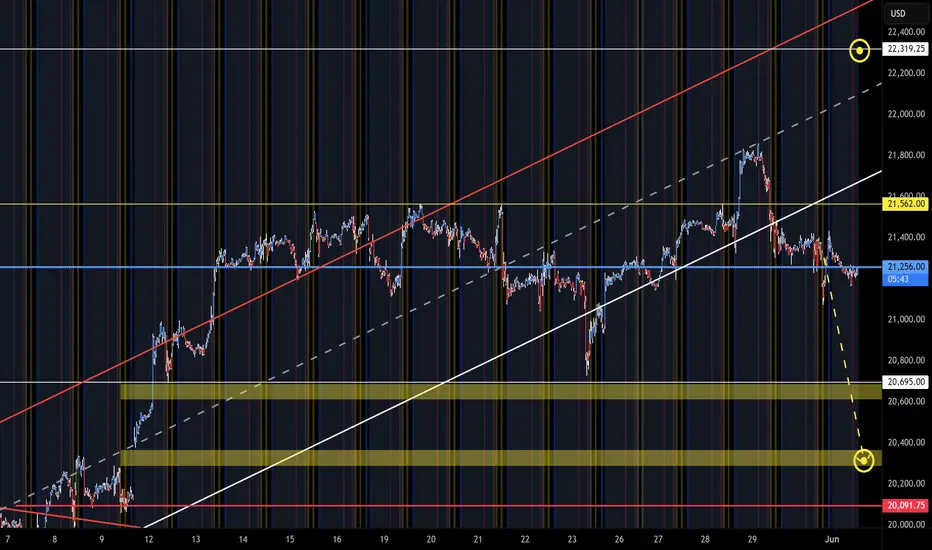
NQ studyI am quite sure the sharp move is coming... which way will it happen we will see, for longer term positions there are no reasonable entries, so once we get a breakout of this distribution or consolidation either way we are likely to see the bigger traders joining along which will accelerate the movement, so far we are looking bullish and ld like to see prices remain above the measured imbalance from 24th of february and its 50 % level, as well as going higher should let us overtake the pink imbalance positioned higher and the minor buyside though we have already received the rejection from that area.
in this case
Looking for sellside delivery first of all I am interested in the minor sellside (20945) as we have formed the equal lows down there, breaking this level will likely put us in shorts for a period of time receiving so called correction to the upward movement we had.
NQ1 wait in the zone for long*The content on this analysis is subject to change at any time without notice, and is provided for the sole purpose of assisting traders to make independent investment decisions.

E-mini Nasdaq-100 Trading Setup for sellers ^)We have completed cup and handle pattern here...
So after the price is still high!
We may see some price gain additional, something like 13-18% .
So we have two option here for the sellers, wait and sell from marked point 1 or 2 .
P.S. This is very long time range position. ( Something like 200-800 day ).
Have a profit in your day!
Thanks.

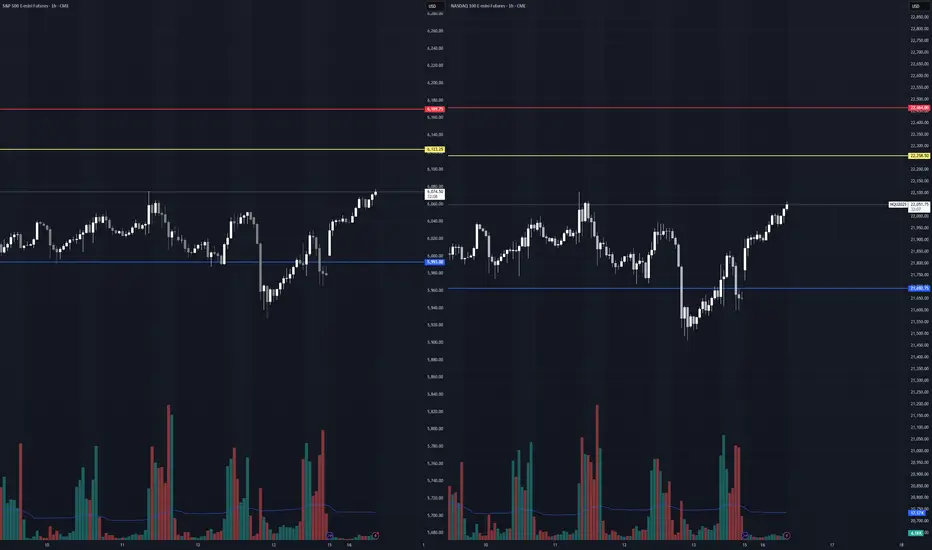
6.16.25 Weekly LevelsES Expected Range: 5993.16 - 6169.64
ES Skew: +.86% 6123.19
NQ Expected Range: 21,692.92 - 22,463.12
NQ Skew: +1.06% 22,258.40
Po3I See a Perfect Accumlation, Manipulation,Distribution On The MNQ Chart After The Sweep of a LOW at 21,471...... LET SEE ON NY OPEN..
