NQ Analysis for the past weekNasdaq has been volatile in the last week and the price didnt decisively break the ATH and tested it. Further with the evolving geo political scenario lets see what happen in the coming week.
NDAQ100M2025 trade ideas

NQ trades with 350+ ticks in profit for longCaught a solid long setup on NQ during the Asia open session, following clean price action and key demand zone confirmation. Two take-profits were hit, and one position closed at break-even — locking in 350+ ticks overall.
Patience and precision paid off today. Zones marked in advance using my custom supply/demand indicator.
#NQ #NasdaqFutures #FuturesTrading #SupplyAndDemand #DayTrading #MicroFutures #PriceAction #TradingViewIdeas #AsiaSession

#202524 - priceactiontds - weekly update - nasdaq e-mini futuresGood Day and I hope you are well.
comment: I do think we will continue to print lower highs from 22094. Very clear invalidation price for that thesis is a print above 21855. 21000 is my target for the next days/weeks. A strong daily bear close below the daily 20ema around 21450 would be my confirmation. Above 21855 we continue to chop sideways and could retest 22094.
current market cycle: trading range most likely for now until we have a daily close below 20ema
key levels for next week: 21450 - 21855 (below 21450 - next target is 21000 and above 21855 next target is 22000)
bull case: Bulls outdid themselves by almost completely reversing the strong sell-off on Friday. That certainly was unexpected but now is decision time. Can they keep the market above 21500 a second time? If so, most bears will likely be quick to give up again and we can continue sideways 21500 - 22100 or even higher. Since we did not close below the daily ema, bulls remain in control.
Invalidation is below 21450
bear case: Bears see the bull wedge as broken and want to trade down from here. The top we have formed is a credible double top with ath 22656 and good for swing shorts. Bulls have been given two amazing macro numbers last week, especially the cpi print and we could not break strongly above. Instead we got a spike and it crumbled afterwards. Those are the type of things that don’t happen in bull trends.
Invalidation is above 21855
short term: Neutral for now and I wait for the breakout to either side. I want to favor the bears but they were so weak after the Globex sell spike on Friday, it’s not wise to hope they suddenly become strong.
medium-long term - Update from 2024-06-15: Daily close below 21450 is my validation for the new bear trend which has the first bigger target at 21000 but I think we will printed below 20000 again this year. Structure is obviously not yet bearish, so don’t be early if you want confirmation and can’t/won’t scale in to shorts higher.

For tomorrow’s Asia open (6 PM EST):NASDAQ Futures Setup – Asia Open Outlook (6 PM EST)
Watching price action closely around zone #24. If we reject this level, I’m anticipating a potential short setup targeting zones #25 and #26, with a final support area near #27. Will reassess if price breaks above and holds #24.
Stay nimble — volatility around session opens can offer great opportunities.
#NASDAQ #MNQ #Futures #AsiaOpen #PriceAction #DayTrading #S&P500 #MicroFutures

NASDAQ Daily Observation Scenarios & Probabilities In ContextCME_MINI:NQ1! CME_MINI:MNQ1! IG:NASDAQ BLACKBULL:NAS100 EIGHTCAP:NDQ100
Well obviously they're 3 possible outcomes but the idea is how we read the context in the upcoming week as the market unfolds each day. But, weighing the outcome based on the current news / fundamentals I would be leading towards 2/3 the the Bullish Long-Term Trend still holds true.
My assumptions would be holding on to the news development of the Iran Israel conflict.
Based on TA heavy we would be still be bullish but a good retracement as the Negotiations of ceasefire with market volatility increase as each time there's a news update with the Conflict & top that with the current Trump Tweets, Tariffs, FED Rate cuts.
Market is weighing the value of this Conflict escalation and deciding the time to price it in. Because market is always forward thinking, IMO.
I personally will be trading these scenarios each-day as the market updates me with NEWS, TA and mainly the Key Levels. As a day futures trader, I will be preparing for volatility. Not as much as the "Liberation Day Sell Off" or the "90 Day Tariff Extension Rally", but futures traders thrive in these kind of market conditions.
It is also sad to hear about the news, or course fundamentally. I am also hoping for the market to make a strong stance absorbing it all with a positive outlook.
Bullish Scenario:
- Market ignores all the war in the Middle East and a rally continuation to make New All Time High.
- News updates on the development of de-escalation war negotiations each day which ends up with a Weekly positive green candle.
Neutral/Consolidation
- News updates brings about both positive & negative impact causing market to range giving the opportunity for accumulation / distribution.
Bearish
- Bad news WAR escalation, Tariffs, Not enough Rate Cuts, Bearish Data.
- Sell side Liquidity wipeout
NOTE:
* 2/3 outcome leaning Bullish because even when a retracement / pullback happens we will rally back up
* since it's a daily observation, i will be looking into the Daily Key Levels of Support/Resistance, Fib Levels, Liquidity Zones, Volume Levels to be tested.
* I wish all good luck and god bless. Thank You.

NASDAQ Weekly Analysis TA & Fundamental News Alignment CME_MINI:MNQ1! IG:NASDAQ CME_MINI:NQ1! NASDAQ:NDX BLACKBULL:NAS100
Highest Probability for the upcoming week?
Not looking good with the Friday news tension of Israel Iran war escalation.
Not much of a selloff coming in, I guess the market is still in the wait and see mode of the upcoming weekend news development; could even be in the next week if the success of de-escalation negotiations.
The TA sure look eerie though, big a** H&S formation completion of the last leg. If successful, could we well be in the recession? Will this scare off the FED and force them to CUT RATES?
Smart money opportunity to buy another big dip?
Have we been in a real proper pullback after a massive rally from "Liberation Day" ?
I wonder why we can't break this level in the last week, could it be that the Smart Money selling to Retail?
It sure does look like an exhaustion point doesn't it?
BEARISH SCENARIO:
- Final Leg of the H&S lead to a massive selloff by Retail and Smart Money buying the dip.
- News WAR breakout with Iran vs Israel, with every development leading to a sell-off / rollover.
- Weekend news leading to a massive gap lower in the Monday Asia Open.
- Last week weekly candle close RED wick/shadow suggesting a strong resistance/ rejection level. A high-probability of the next candle will also be a RED Weekly Continuation?
BULLISH SCENARIO:
- Healthy Retracement and holding strong support levels.
- Even for any bearish news the market holds & the participant buying power will maintain a healthy pullback.
- Sweep up to the liquidity making New All Time High.
NOTE:
*This is a weekly analysis, Price Action within the week will reflect differently from day to day.
*The outcome will only be projected by the end of next week.
*Please do comment on your thoughts, a healthy discussion is always welcomed.
*I am publishing my thoughts and context to the way I interpret the market, in no way I am giving any financial advise.

2025-06-12 - priceactiontds - daily update - nasdaq
Good Evening and I hope you are well.
comment: Neutral around 21900. 21700 was the lowest I expected and we printed 21716.5. Weekly close around 21900 is the most likely outcome for me. We have no acceptance above 21900 and none below 21800 as well. A trend day tomorrow would surprise me.
current market cycle: trading range
key levels: 21700 - 22100
bull case: Bulls want to close the week above 21800 to print a green one. They had spikes above 21900 but nothing else. They are still somewhat in control because we are not making meaningful lower lows and are still at the highs but price action is neutral since last week so no side has the clear advantage. Weekly close above 22000 would be a surprise to me.
Invalidation is below 21680.
bear case: Bears have to close the gap down to 21680 if they want more downside. Until then they have to fade everything above 21900 since that has been profitable for a week now. A weekly close below 21800 would be a decent sell signal going into next week and a clear break of the wedge. Problem for the bears is the same as for bulls on the other side. On the 4h chart we have big tails above and below bars. Market is completely in balance around 21850ish and therefor I expect a weekly close around that price.
Invalidation is above 22100.
short term: Completely neutral. New high or low would surprise me tomorrow. I expect a choppy session where mean reversion will likely be king.
medium-long term - Update from 2024-05-24: Will update this section more after the coming week but in general the thesis is as for dax. Down over the summer and sideways to up into year end. I don’t think the lows for this year are in.
trade of the day: Longing 21730 because it was support all week and the obvious trade.

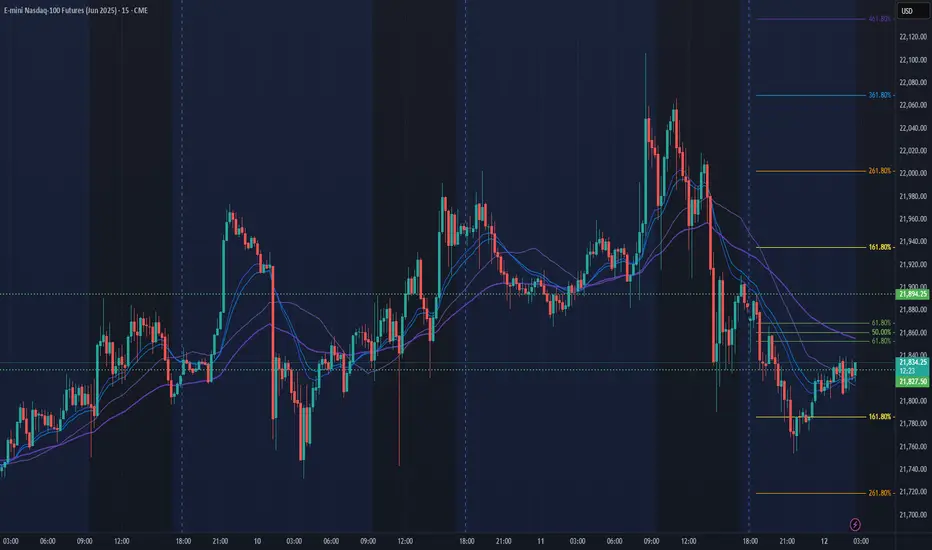
NQ Power Range Report with FIB Ext - 6/12/2025 SessionCME_MINI:NQM2025
- PR High: 21894.25
- PR Low: 21827.25
- NZ Spread: 150.0
Key scheduled economic events:
08:30 | Initial Jobless Claims
- PPI
13:00 | 30-Year Bond Auction
Session Open Stats (As of 12:25 AM 6/12)
- Session Open ATR: 376.45
- Volume: 24K
- Open Int: 268K
- Trend Grade: Neutral
- From BA ATH: -3.6% (Rounded)
Key Levels (Rounded - Think of these as ranges)
- Long: 22096
- Mid: 20383
- Short: 19246
Keep in mind this is not speculation or a prediction. Only a report of the Power Range with Fib extensions for target hunting. Do your DD! You determine your risk tolerance. You are fully capable of making your own decisions.
BA: Back Adjusted
BuZ/BeZ: Bull Zone / Bear Zone
NZ: Neutral Zone
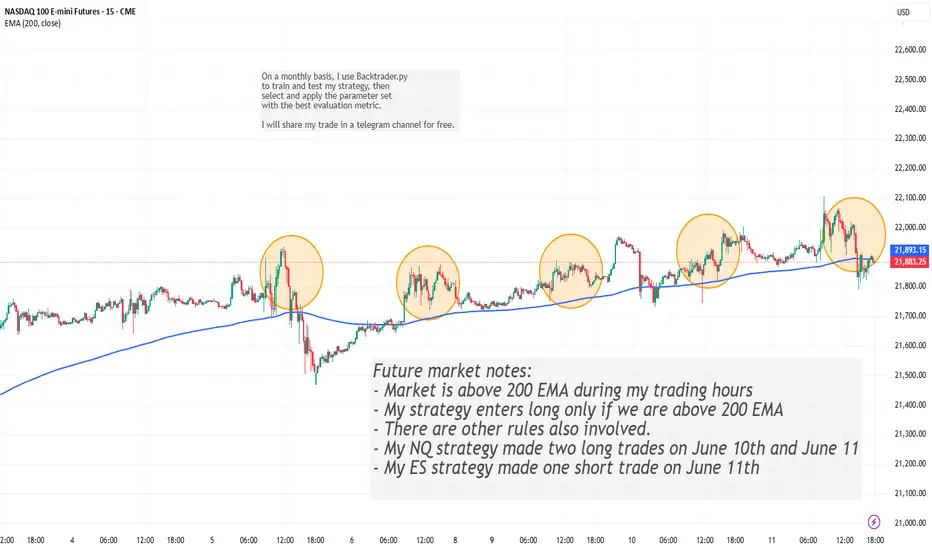
200 EMA Futures Strategy Recap: June 10–11Description:
Market Context:
During my trading window (11:00–17:00 ET), price remained decisively above the 200-period EMA.
Key Rule:
• As one of several entry conditions, the model only goes long when price is above the 200 EMA.
June 10–11 Trades:
NQ Strategy: Two long entries—one on June 10 and one on June 11.
ES Strategy: One short entry on June 11 (all other rules aligned).
Feel free to ask questions or share feedback!

Nasdaq Potential Daily ReversalIPDA Speaking + Contract closure we can see speed take place to reach BSL outside IPDA range but why whould the just past 20 days HRLR instead of moving higher with speed
Because of Intermarket striction
maybe to build more stops there but it would be greater in terms of liquidity efficiency to place a fake D high in here and reverse, take the liquidity lower on D HRLR and then continue higher to reach 22,672.00.
The key here is: do we breach above the D SIBI or do we react from it.
one of two will unlock the next 20 to 40 trading days of delivery.

NQ Power Range Report with FIB Ext - 6/11/2025 SessionCME_MINI:NQM2025
- PR High: 21983.75
- PR Low: 21937.00
- NZ Spread: 104.75
Key scheduled economic events:
08:30 | CPI (Core|YoY|MoM)
10:30 | Crude Oil Inventories
13:00 | 10-Year Note Auction
Session Open Stats (As of 12:25 AM 6/11)
- Session Open ATR: 380.78
- Volume: 24K
- Open Int: 272K
- Trend Grade: Neutral
- From BA ATH: -3.4% (Rounded)
Key Levels (Rounded - Think of these as ranges)
- Long: 22096
- Mid: 20383
- Short: 19246
Keep in mind this is not speculation or a prediction. Only a report of the Power Range with Fib extensions for target hunting. Do your DD! You determine your risk tolerance. You are fully capable of making your own decisions.
BA: Back Adjusted
BuZ/BeZ: Bull Zone / Bear Zone
NZ: Neutral Zone

Live Paper Trading Using my own strategy. I was playing a break of a downtrend with OB at certain levels, I waited for a confirmation to get into the trade.
I let the trade play out to long i could have taken profits around the $110 mark, I wanted to see how far i could ride it until it reversed on me. I need to learn how to scale out as well i could have scaled out 4 out of my 8 contracts and rid the other 4. Im taking this learning expiernce by taking profits sooner rather than letting the chop take my gains away. I would say i had a great entry maybe 30 seconds to soon but i caught a 5 minute move. I need to take note that if Im going to scalp just make it a 3-5 minute play.

Live trade 06/10/2025Here is what one of my strategy traded today. I have 5 trading strategies in NQ and ES.
Today's trade was made based on the NQ DVD strategy where I look at the cumulative daily volume, an indicator that I developed. The Cumulative daily volume is calculated based on the direction of each candle and it resets on daily basis. For more info, please see my channel.
For this specific trade, the both TP and SL are calculated based on a coefficient of ATR. If none of them are met, then I close the trade by 16PM EST.

Nasdaq Bearish 4hNasdaq Bearish after the failure in continuation through Previous Weekly High and the rejection afterwards.
Setting the Target to 21,471.00 Swing Low and using 21,716.00 as Low Easy Hanging Fruit (LEHF) objective that We may even reach today despite the small range day expectation (pre-CPI)

$NQ things to watch for There are a few trendlines to keep an eye on possible formation of an H&S pattern inside a rising wedge. Hope this helps

Will NASDAQ Continue Its Bullish Momentum Next Week?
- Current Price: 21761.79
- Key Insights: NASDAQ continues to exhibit robust bullish sentiment, driven by
technology sector strength. Investors should watch resistance at 22,385 and
key support near 21,414 for directional cues. While upside pressures remain,
risks of a short-term pullback could materialize if overbought conditions
persist.
- Price Targets:
- Target 1 (T1): 22,275
- Target 2 (T2): 22,385
- Stop Level 1 (S1): 21,600
- Stop Level 2 (S2): 21,414
- Recent Performance: The NASDAQ has shown resilience, maintaining its upward
trajectory amid potential headwinds such as weaker momentum signals and
geopolitical trade developments. Technology stocks, specifically
semiconductor firms, have powered market gains, buoyed by optimism in the
sector's outlook.
- Expert Analysis: Analysts agree on the likelihood of continued upside provided
key resistance levels are cleared. However, caution surrounds potential
reversals due to overbought technical conditions. A pullback might occur
within the next 3–6 weeks, reinforcing the importance of monitoring
divergence signals.
- News Impact: Optimistic US-China trade comments and semiconductor growth have
supported the rally. Broadcom's recent earnings could temper enthusiasm,
serving as a potential inflection point for the index's short-term
trajectory.

NQ1! ATH or what???NQ1! ATH or what?
optimism coming back or no? Chyna CHyna CHyna? or no CHyna? let us know~~
we caught april bottom now run ATH?
🐉We value full transparency. All wins and fails fully publicized, zero edit, zero delete, zero fakes.🐉
🐉Check out our socials for some nice insights.🐉
information created and published doesn't constitute investment advice!
NOT financial advice

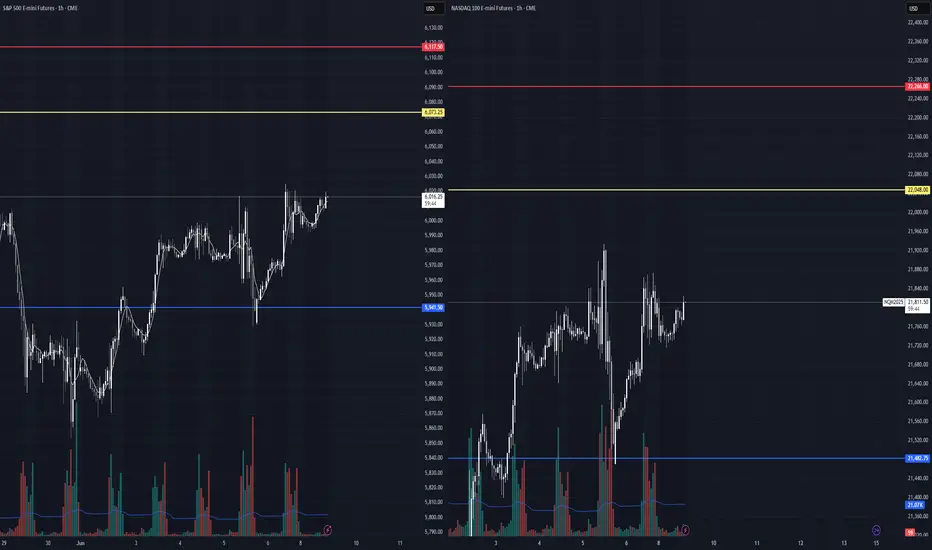
ES/NQ 6.9.25 Weekly Range + Expected CloseES Weekly Range: 5941.78 - 6117.31
ES Weekly Expected Close: 6073.08 +.91% Skew
NQ Weekly Range: 21,483.56 - 22,265.57
NQ Weekly Expected Close: 22,048.41 +1.04% Skew
Long ideaDaily: We rejected from a Daily FVG (Daily TF) and found support with little to no pullback from the monthly trend, displaying the strong uptrend.
Today we still have bearish resistance off that reaction but bias is obviously bullish both short and long term facing mid trend, explaining why i'm expecting to long this area against the mid trend.

NQM June 9 Breakout in Play| Momentum Building Toward 22000📝 Description:
📅 Date: 09 June 2025
📊 Instrument: NQM2025 (Micro Nasdaq Futures)
NQM has successfully broken above the critical 21700 level, confirming a bullish breakout from the earlier consolidation zone (21605–21675).
This move has unlocked a fresh momentum zone — supported by strong bullish candles and higher timeframe RSI strength.
🔥 Active Bullish Outlook:
📌 Breakout Level: 21700 ✅
📈 Next Targets:
1)🎯 21850
2)🎯 22000
Above 22000
🛑 Temporary Pause Expected: 21980 – 22080
→ Market may range or pull back slightly in this zone
💥 Post-Pause Momentum: Targeting up to 22200
🔍 What to Monitor:
A clean breakout above 22000 may stretch up to 22020–22050, where we may see a short pause.
If the price holds above 21980, the next leg toward 22200 could begin.
Avoid chasing entries near 22000 — wait for either a dip to support or clear breakout continuation.
📊 Analysis Based On: Emperor Pivot + RSI Candle Setup
🔹 Emperor Candles confirm trend & Strength
🔹 Emperor Pivots define Buyer and Seller zones

NQ Power Range Report with FIB Ext - 6/9/2025 SessionCME_MINI:NQM2025
- PR High: 21820.75
- PR Low: 21730.25
- NZ Spread: 202.25
No key scheduled economic events
Session Open Stats (As of 12:15 AM 6/9)
- Session Open ATR: 406.53
- Volume: 25K
- Open Int: 272K
- Trend Grade: Neutral
- From BA ATH: -4.0% (Rounded)
Key Levels (Rounded - Think of these as ranges)
- Long: 22096
- Mid: 20383
- Short: 19246
Keep in mind this is not speculation or a prediction. Only a report of the Power Range with Fib extensions for target hunting. Do your DD! You determine your risk tolerance. You are fully capable of making your own decisions.
BA: Back Adjusted
BuZ/BeZ: Bull Zone / Bear Zone
NZ: Neutral Zone

#202523 - priceactiontds - weekly update - nasdaq e-mini futuresGood Day and I hope you are well.
comment: Same as last week, markets are all very similar. Nq is also in a wedge right under the big round number. I doubt bears can prevent the bulls from printing 22000 but bulls have certainly tried long enough now. Either they get it next week, or it won’t happen for couple of weeks/months.
current market cycle: trading range on the weekly tf, bull wedge on the daily tf
key levels for next week: 20700 - 22000
bull case: Can bulls find enough buyers above 21900 next week to push for 22000 or even a new ath above 22656? Right now bulls are still favored for everything but that does not mean buying above 21500 is a good trade. If you were to buy right now at 21789, your stop has to be 21720 or better 21655. You would be buying at the very top of an ascending triangle we have been in since Thursday. It’s certainly not a good short but I wouldn’t buy it either.
Invalidation is below 21300
bear case: Bears need to close the gap down to 21300 and then we can talk about the highs being in, maybe. For now they fail at making lower lows and letting the bulls make higher highs. They are selling new highs but market is still grinding higher. For couple of weeks now I have been writing that for bears to change the character of the market, they would need a strong gap down or sell spike and leave an open gap. I do think it’s not bad by the bears that we have still not printed 22000, which everyone expected on Thursday but instead bulls had to give up again and we sold for 700 points. Long story short, bears have nothing and no one would be surprised if we print 23000 next week.
Invalidation is above 22100
short term: Neutral around 21800. Longs closer to the wedge trend line 21600 are likely decent. I expect at least 22000 to get hit before we could maybe turn. Most insane thing would be to see a giant melt-up next week and continuing for 23000 over the next 2-3 weeks. Certainly much higher possibility of that happening than a weekly close below 21000.
medium-long term - Update from 2024-06-07: Market is refusing to go down but I can not see this going much more up. Maybe we hit 22000 maybe we don’t. My assumption is still that latest around mid/end of July we begin to decline over the summer.
