US 30 - Ranges overview Let's see what the charts are telling us on US 30.
Similarly to US 100 we are currently redistributing after a clean retracement towards the HTF sellside.
Pretty easy plan as always.
IF we hold 36970 expect us to aggressively trade towards 42500. From a LTF perspective - the current price action is ideal for scalpers. So don't hesitate to play the LTF ranges BASED ON THE HTF ranges.
IF deviate and hold below 36970 we will revisit 35597. We have a LTF inverted FVG sitting between 37620 and 36970 so keep an eye on it.
Stay safe and never risk more than 1-5% of your capital per trade. The following analysis is merely a price action based analysis and does not constitute financial advice in any form.
US30 trade ideas

Weekly Forex Outlook Sun.April.13.2025 - Fri.April.18.2025Like and Comments would be appreciated :D Not Financial Advice, Just my outlook/opinion

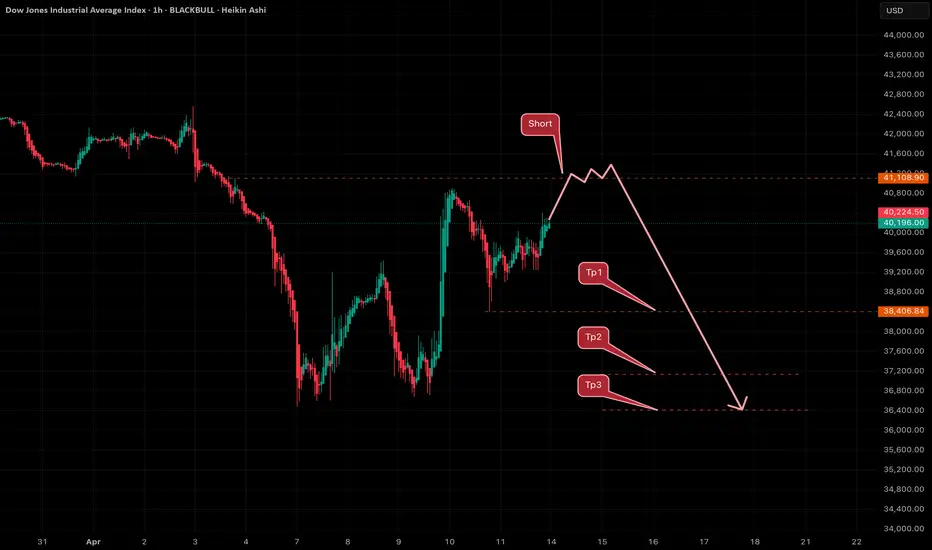
Close to the short entry zone.BLACKBULL:US30 Following a potential move above the 41,108 resistance level, we anticipate short-selling opportunities. The initial downside target is identified at 38,406. Should bearish pressure persist, a secondary target lies below 36,470. Upon reaching this key support zone, we will closely monitor price action for signs of a possible bullish reversal and the emergence of new long setups.
NASDAQ100 - Bullish ??Perfect — now we’re on the 4H timeframe, which is great for refining entries. Let’s break this down again with the three frameworks:
⸻
1. Smart Money Concept (SMC)
Key Elements:
• CHoCH (Change of Character) — clearly marked after price broke above a short-term structure, shifting market sentiment bullish on 4H.
• EQH (Equal Highs) — potential liquidity resting above; smart money may target these.
• BOS (Break of Structure) — further confirms internal bullish structure.
• Order Block (OB) or Demand Zone in the green box (~17,700–18,200)** — price respected this zone strongly after BOS, indicating smart money accumulation.
SMC Bias (4H):
• Currently bullish, moving from demand to premium pricing.
• Price is forming higher highs and higher lows post-CHoCH.
• Liquidity pool above EQH near 19,000 is likely next target.
• Potential long re-entry if price returns to demand zone (18,000–18,200).
⸻
2. Elliott Wave View (Micro Count on 4H)
• If this is part of Wave 4 retracement on the Daily, this current 4H rally could be subwave A or B of the corrective structure (flat, zigzag, triangle).
• Alt. view: This may be Wave 1 of a new impulsive move upward if macro bearish bias gets invalidated.
• Current price action looks impulsive — strong vertical move (potential Wave 1 or 3).
If impulsive structure:
• Wave 1: 17,000 → 18,900
• Wave 2: pullback to ~18,100 (near OB)
• Wave 3 underway — targetting >19,000
⸻
3. Dow Theory (on 4H)
• Short-term trend is now up: Higher high confirmed post-BOS, and higher low formed.
• To maintain bullish structure, price must not break below 17,900 (demand zone).
• Confirmation of strength if we break above 19,000 — forming a higher high again.
⸻
Trade Idea (4H Setup) — Bullish SMC Entry
Entry (Buy Limit): 18,150 (mid-demand zone)
SL: 17,750 (below OB)
TP1: 19,000 (liquidity above EQH)
TP2: 19,800 – 20,200 (Daily supply zone)
RR Ratio: ~1:3+
⸻

DOW JONES: Just triggered the most historic buy signal (1M MA50)Despite the bearishness on the lower timeframes, Dow is neutral on the ultimate long term chart, the 1M (RSI = 51.044, MACD = 1991.530, ADX = 44.038) and that is due to the fact it almost touched its 1M MA50. This neutral technical setting is a great reset for the Channel Up and stands as the most ideal long term buy entry and was tested before on all 4 major market bottoms (September 2022, March 2020, January 2016, October 2011). In all incidents it set in motion the new Bull Cycle, technically the bullish wave of the Channel Up. The most common price increase is +70% and along those lines, we anticipate Dow to hit 60,000 by the end of 2027.
## If you like our free content follow our profile to get more daily ideas. ##
## Comments and likes are greatly appreciated. ##

Will Sellers win the battle in US30?IN this idea i believe should the us30 break down and close with the candle it will be a good opportunity to push the market to the downside further

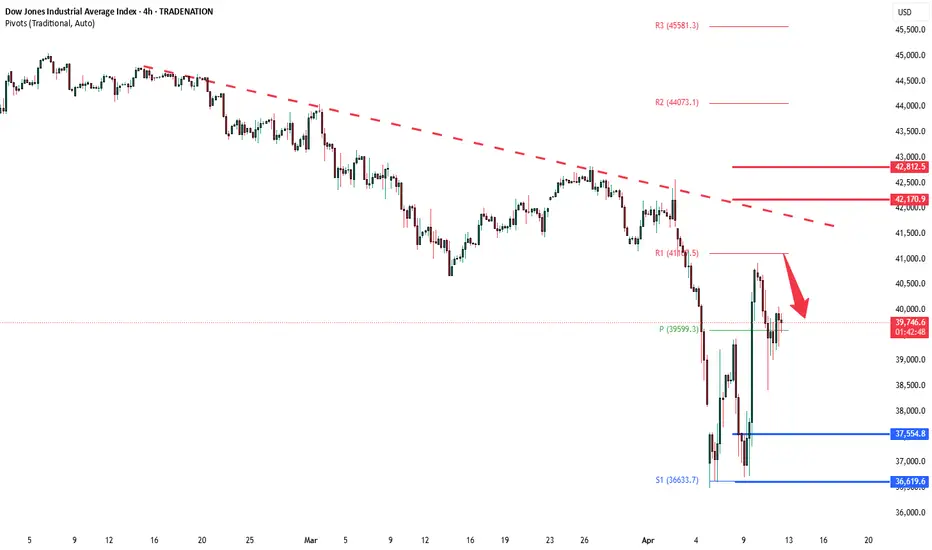
Dow Jones INTRADAY reaction to China Tariffs HikeKey Support and Resistance Levels
Resistance Level 1: 41100
Resistance Level 2: 42170
Resistance Level 3: 42800
Support Level 1: 37554
Support Level 2: 36620
Support Level 3: 35125
This communication is for informational purposes only and should not be viewed as any form of recommendation as to a particular course of action or as investment advice. It is not intended as an offer or solicitation for the purchase or sale of any financial instrument or as an official confirmation of any transaction. Opinions, estimates and assumptions expressed herein are made as of the date of this communication and are subject to change without notice. This communication has been prepared based upon information, including market prices, data and other information, believed to be reliable; however, Trade Nation does not warrant its completeness or accuracy. All market prices and market data contained in or attached to this communication are indicative and subject to change without notice.
US30: Will the Channel Hold? Trading the Intraday StructureUS30 1-Hour Analysis - Potential Trading Setup
Technical Outlook — 11 April 2025
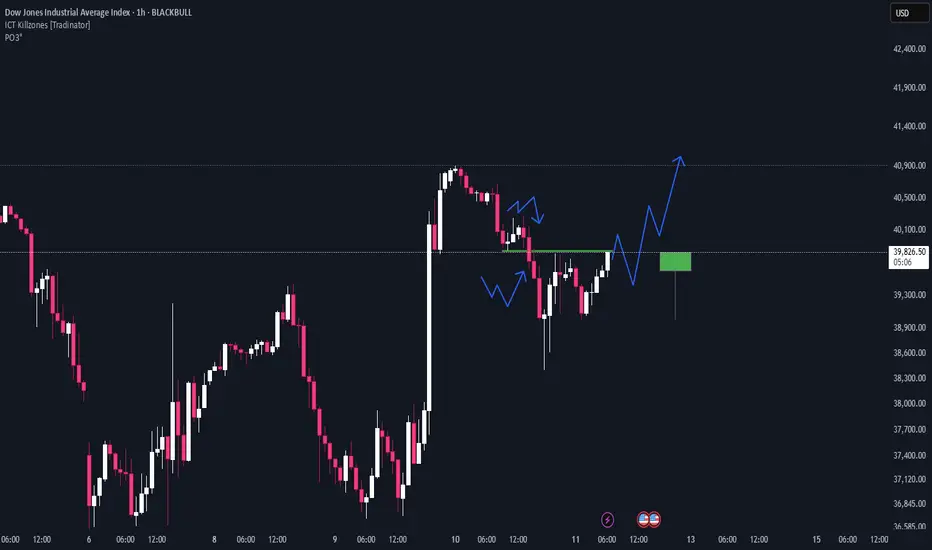
Current Market Condition:
US30 on the 1-hour timeframe is currently trading within a short-term ascending channel, showing a recent test of the upper trendline. The price is now exhibiting signs of potential bearish pullback within this channel.
Potential Trading Setup:
Bearish Pullback Setup (Primary Scenario):
Entry: Look for confirmation of bearish rejection from the upper ascending channel trendline. This could be in the form of bearish candlestick patterns (e.g., bearish engulfing, pin bar) on the 15-minute or 30-minute timeframe after testing the channel top.
Stop Loss: Place a stop loss above the high of the rejection candle or above the upper channel trendline to protect against a potential channel breakout.
Take Profit Targets:
TP1: The middle of the ascending channel (currently around 40,600).
TP2: The lower trendline of the ascending channel (currently around 40,300 - 40,400).
Potential TP3: If the channel breaks down, the next support zone around 39,800 - 39,900.
Rationale: Trading within an ascending channel often involves buying at the lower trendline and selling at the upper trendline. The recent rejection at the channel top provides a potential short opportunity for a pullback towards the lower trendline.
Bullish Breakout Setup (Lower Probability, Requires Strong Confirmation):
Entry: Consider a long entry only upon a strong and sustained break above the upper ascending channel trendline (around 41,000). Look for strong bullish candlestick patterns and increasing volume on the breakout.
Stop Loss: Place a stop loss below the low of the breakout candle or below the upper channel trendline after it has been broken.
Take Profit Targets:
TP1: Previous swing highs or resistance levels above the channel (refer to the chart for specific levels).
Rationale: A breakout from the ascending channel could signal a continuation of bullish momentum, but requires strong confirmation to avoid false breakouts.
If you found this analysis valuable, kindly consider boosting and following for more updates.
Disclaimer: This content is intended for educational purposes only and does not constitute financial advice.

DJI REJECTION OPTIONLooking at the DJI - I see this as a worst case scenario. From here I would rather see a complete rejection of this red candle or a long swoop. if we follow the path here, a rejection would see a significant down trend begin. Lets hope we break out.

11/04/2025 us30 nq es ///read description pls ///yesterday i share with u why market should go down and go up already explain it in the last post go check it in my profile
now were waiting confirmation
this is not trade this just my vision to market and u should be aware we have news and last day of the week
dont take it as trade . cause we dont have confirmation yet its just a vision we need confirmation to take this trade
ill keep u update if we get confirmation in this post
never ever risk more than 1% from ur capital a day
respect ur plan even if ur plan goes wrong
any question feel free
be safe
US30 Outlook – April 11, 2025📉 US30 Outlook – April 11, 2025
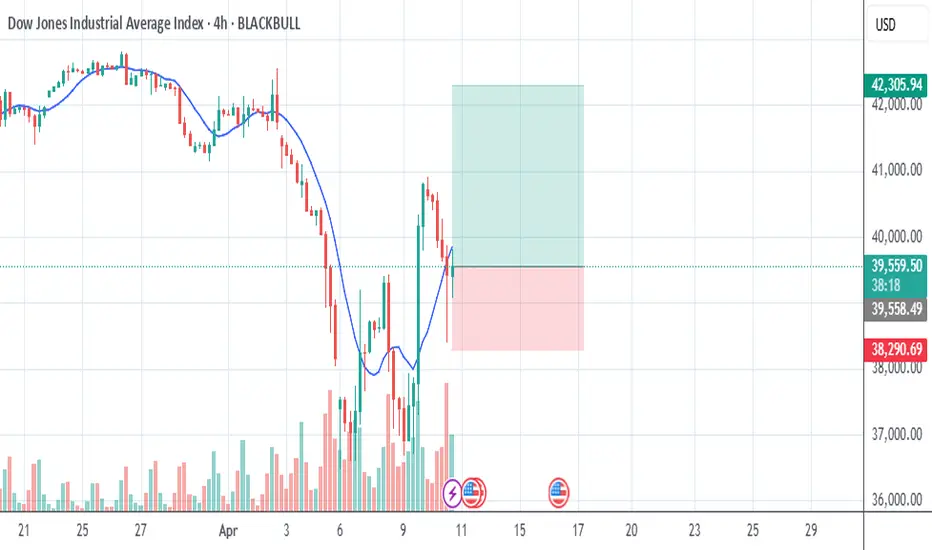
US30 has staged a sharp V-shaped recovery from the recent low near 36,743, climbing back over 39,500. However, bulls are now showing signs of exhaustion after failing to hold above 40,000, a key psychological and structural level.
🔍 Chart Analysis:
✅ Strong recovery with bullish EMAs crossover
❌ Multiple rejections at the 40,000 handle — turning it into short-term resistance
🧨 Price forming lower highs after the spike — hinting at weakening momentum
🔻 Key support zone sits at 38,800–39,000, a break below opens downside
🧠 Outlook Summary:
Bias: Turning neutral after a strong bounce
If 40,000 is reclaimed and held → Bullish continuation toward 40,800 / 41,200
If price breaks 38,800, expect a retrace to 37,700 / 36,743
🎯 Key Levels:
Resistance: 40,000 / 40,800 / 41,200
Support: 39,000 / 38,800 / 37,700

correction A correction and fluctuation trend is expected to form within the support levels, then the start of the upward trend is likely.

us30 buy tradeThe Relative Strength Index (RSI) is showing an upward trend, indicating increasing momentum. Additionally, the Moving Average Convergence Divergence (MACD) is showing a bullish crossover, further supporting the potential for an upward move.
Dowjones Short AnalysisDow is in downtrend now. I have used various technique in analysis. Sl is the rectangle top. And target is below arrow.
❤️ If you find this helpful and want more FREE forecasts in TradingView
. . . . . Please show your support back,
. . . . . . . . Hit the 👍 LIKE button,
. . . . . . . . . . Drop some feedback below in the comment!
❤️ Your support is very much 🙏 appreciated!❤️

BULLISH PRESSURE US30All details are in the picture itself. If you have any questions feel free to message me.

Dow Jones - Value Is The King Of 2025!Dow Jones ( TVC:DJI ) withstands all bearish struggles:
Click chart above to see the detailed analysis👆🏻
All major U.S. indices have been weakening lately but the Dow Jones is clearly the strongest of all. It seems like big institutions are shifting back to value stocks and therefore the Dow Jones remains very strong. Looking at technicals, this trend is rather likely to continue during 2025.
Levels to watch: $40.000, $50.000
Keep your long term vision,
Philip (BasicTrading)
