CANADIAN DOLLAR FUTURES (6C1!), H1 Potential for Bearish DropType : Bearish Momentum
Resistance : 0.77520
Pivot: 0.77310
Support : 0.76480
Preferred Case: On the H1, with price moving below the ichimoku indicator, we have a bearish bias that price will drop from our pivot at 0.77310 in line with the swing high resistance to the 1st support at 0.76480 in line with the 161.80% fibonacci extension, 100% fibonacci projection and swing low support.
Alternative scenario: Alternatively, price may break the pivot structure and rise to the 1st resistance at 0.77520 in line with the overlap resistance and 78.6% fibonacci retracement .
Fundamentals: The prospect of a more aggressive Fed saw further gains in the USD/CAD pair. At the same time, an oversold CAD is deemed from the equally hawkish BoC and firm oil prices resulting in mixed to weak bullish view for the Canadian Dollar Future.
6C1! trade ideas

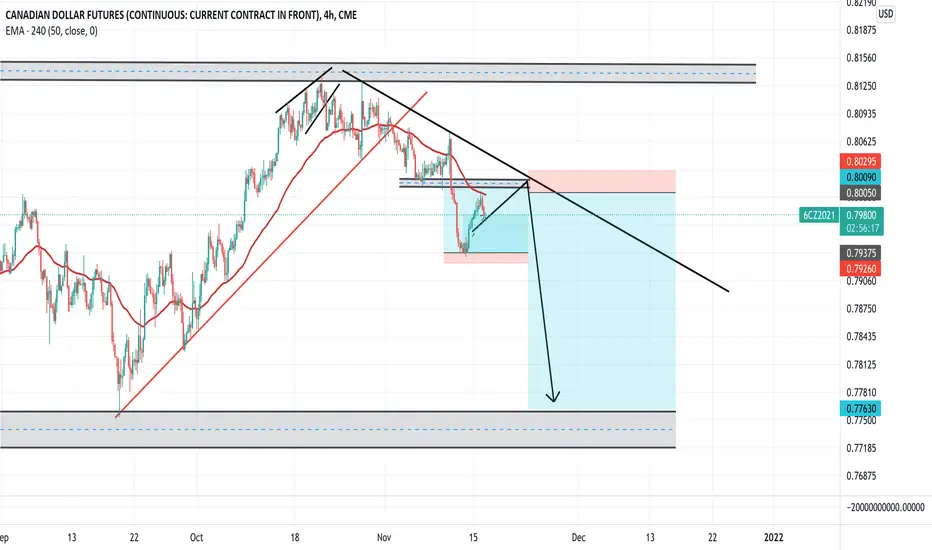
6C1! increase in the pricewe will see a continuation of the downtrend after the confirmation of the range breakout

6c1! increase in the priceafter having a forceful break of a strong resistance from a large candle with a large volume we will see an increase in the price

Short Canadian Dollar vs USD Low volume today on the CAD Futures.
Volatility contraction before the expansion. Negative divergence is also obvious.
Looking for /6C to move down about a cent from .795 to to about about .785 - back to the 50% Retracement
Can easily move down two cents though to .77435 - that will depend on the SPX
Six hour chart.

6C1! increase in the priceafter having a forceful break of a strong resistance from a large candle with a large volume we will see an increase in the price

6C1! increase in the pricewe will see an increase in the price after the breakout with strength of the range

High probability for reversal move next weekstrong support at level 0.77320 . rebound on it more than five time .

Canadian Dollar: anticipatory Symmetrical Triangle
Major Pattern: Weekly Descending Triangle
Anticipatory: Daily Symmetrical Triangle
Trigger points: 0.7821 or 0.7913

Detailed explanation of the harmonic model 5-05-0 pattern discovered by Scott Carney and published in his book “Harmonic Trading, Volume Two”
It is a unique model that has precise corrections of the Vibonachi ratio to check the health of the model.
Although the 5-0 pattern is a reflective pattern, because the 50% recovery level is the most important in the possible reflection area, and the correction ratio is slightly different from the Bat or Gartley pattern.
The 5-0 category falls within a family of 5 point harmonious reflection models and is essentially defined by the B point, which is mandatory for all compatible patterns.
The basic pattern assumption is to determine reactions after finishing the opposite direction, and 5-0 patterns usually represent the first retreat to reflect the large direction.
In many cases, the AB rib of structure is the final failing wave of direction.
“The buying pattern”
-Rib 0X beginning of formation of model structure.
XA rib does not require a certain correction, but provided it does not break the top of the rib 0X.
- AB rib between fibonachi extensions 1.13 to 1,618 from XA rib.
-C point between fibonachi extensions 1.618 to 2,224 from AB rib.
-Dot D from here we need to see one lower final comeback complete at the BC Correction Level 50.
- CD rib should D be equal in AB rib length.
“The Selling pattern”
-Rib 0X starting to be the model structure.
The XA rib does not require a certain correction, but provided that the bottom of the rib is not broken.
- AB rib between fibonachi extensions 1.13 to 1,618 from XA rib.
-C point between fibonachi extensions 1.618 to 2,224 from AB rib.
-Dot D from here we need to see one lower final comeback complete at the BC Correction Level 50.
- CD rib should be equal in AB rib length.
Take a look at some of our previous analyzes with this analysis
And don't forget to hit like so we can continue to publish such useful posts

Canadian Dollar - Short
With four naked points of control below - which is very unusual it's safe to say the CAD has some backtracking to do.
Most likely they will be taken out all very quickly.
News bomb like a high CPI number might do the trick to send the DXY higher and the CAD lower.
Personally I am short in the futures marketing targeting the last VPOC.

MCD1 CADUSD Bullish ReversalCad USD is reaching an important area in where price could stop the bearish price action and reverse. It is important to watch carefully the area in order to determine if there is a valid bullish opportunity. Target one is the previous high, target two is the marked area.

cad index for EURCAD WE ARE Expecting CAD weakness & EUR strength In fact, we posted this pattern in 14 nov but private , as you can see it RUNNING we as i expected
so buy EURCAD any time it goes down
Canadian Dollar Short
You can see the CAD has been in accumulation mode.
This may not be over - however as we are at the top of the triangle I put on a short this morning while the CAD was up, the EURO down and the DXY up.
Targets below as well as various VPOCs.

Canadian Dollar Futures MonthlyCanadian Dollar Futures Monthly Chart Bullish Bias
10/18/21
Looking at Current Market Price Action, on the Monthly Time Frame We can see that the Canadian Dollar Futures is painting a bullish recovery over the past 2 months
Finding support at the 0.77500 level we can see that the price action of August and September rejected that level very quickly, also we have a great level of confluence in that zone with the 2020 highs.
Also we find that we have ran through not only 2020 highs but 2019 highs as well and we matched 2017 highs with the run in the first quarter of this year.
Looking at all this data we can see that price has a willingness to trade higher and will most likely make its way to the 0.87500 level as the next major level in the next 6-12 months.


All Pairs vs USD - CAD SHOWN
This is a pretty obvious chart of whats going on with CAD - you can see its sitting at 50% retracement with trendline resistance overhead.
This is now cyclical matter - DXY continues to make higher highs - and inversely CAD, Cable, and AUD are lower highs. This also means lower oil and Gold of course.
Based this chart this is a good point to short anyone of these.
See related chart below for more info

CAD upside push incoming CAD futures has approached critical ob on 4h timeframe. I'd like to see bullish momentum take place clearing all the liquidity trapped above.


Half a cent in 5 Minutes
I only publish this because its interesting.
They dragged the CAD up to the VPOC highlighted went to sell it and there no buyers sending the CAD down half a cent in 5 Minutes - you don't see that everyday.
The top is the six average price and the bottom is the three day average price.
Wish I had taken that short. You would have gotten paid instantly - in this case.

Short on Can dollar 6C for the next 24 Taking short position on Canadian $$ futures. 2 contracts for the next 24 hours. Target is on the chart.


CADUSD | When and where to enter long and short#CADUSD #Futures #6CM2021 #1HR
- Here is CADUSD futures 1hr chart. Currently, yellow upward trendline is supporting and a short-term bottom has been formed at 0.82370. I am more bearish when this bottom fails supporting.
- When that happens before 5/20 19:00, I am looking at 0.82200~0.82280 as a short-term support. If you wish to enter long here, make sure to take profit under the previous bottom at 0.82370 since it will then act as a resistance due to SR Flip.
- On the other hand, if CADUSD rallies upward to test the top of the white channel before 5/20 18:00, 0.82760~0.82840 seems to be a decent resistance. If white channel gets broken above, 0.82990~0.83070 is next resistance I am considering.
- If the market gets bearish and goes through some more correction, here are some of the supports for long entry: 0.81530~0.81630, 0.81110~0.81210, and 0.80540~0.80670.
- All of the periodic references are in Korean standard time (UTC+09:00).

Canadian Dollar short put verticalMax profit: $70
Probability of Profit: 83%
Profit Target relative to my Buying Power: 20%
Max loss with my risk management: ~$150
Req. Buy Power: $430 (max loss without management at expiry, no way to let this happen!)
Tasty IVR: 28 (average at futures)
Expiry: 36 days
Sell 1 !6CM1 Jun4' 0.8 Put
Buy 1 !6CM1 Jun4' 0.785 Put
Credit Call spread for 0.70cr each
Stop/my risk management : Closing immediately if daily candle is closing BELOW the box, max loss in my calculations in this case could be 150$. Probability of loss in this way: ~10% .
Take profit strategy: 50% of max.profit in this case with auto sell order at 0.35db. Probability of profit this way: ~90%.
Of course I'll not wait until expiry in any case!
If you liked this article, check my other ideas.
Anyway: HIT THE LIKE BUTTON BELOW , and for fresh option ideas FOLLOW ME( @mrAnonymCrypto ) on tradingview !
