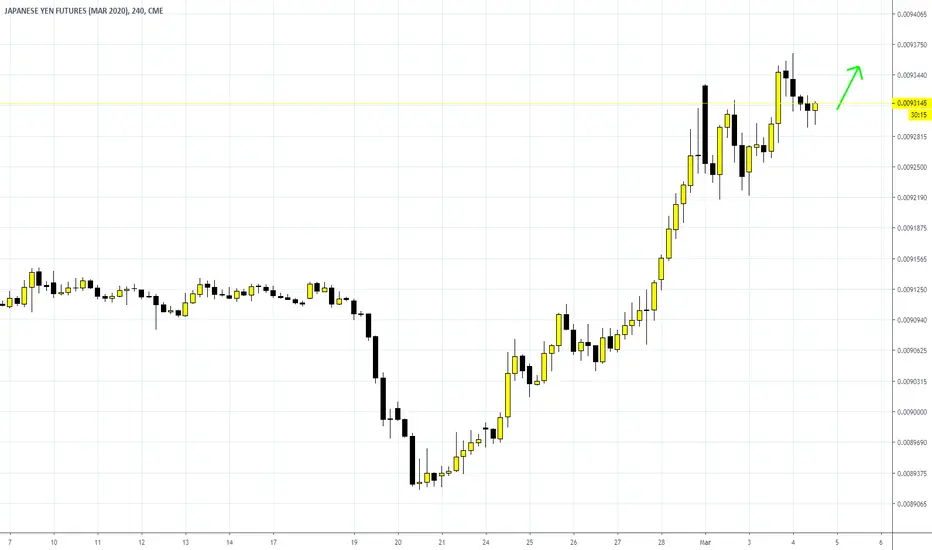
Break out in Yen above .00094000.We have an ascending triangle that is poised to continue the bullish pattern that has been established. May take a couple of days to weeks to play out. Bought the June 6J Futures, sold the September 6J futures.
6J1! trade ideas


BUY JAPANESE YEN FUTURES (CONTINUOUS: CURRENT CONTRACT IN FRONT)BUY JAPANESE YEN FUTURES stop lose 0.0092705 and take profit 0.0094520

6JShort Term Higher
Long Term Swing Idea
If close below the green line extreme rotation lower expected


SMS Trade Update - JY Short Stops Moving DownOur short position in the Japanese Yen continues to trend. Stops are moving down to 9323.

Japanese Yen Bottoming? Negative News Ahead?The Yen futures are at a very big flip zone as can be seen on the daily chart. On the 4 hour, we have had multiple swings lower, and that trend seems to be exhausting.
We had a fake out candle, indicated by the large wick, which is CONFIRMED due to the break and close above it.
Expecting to see some sort of pattern here, perhaps a head and shoulders.
The Yen is seen as a safe haven currency. Mainly because the Japanese government is seen as stable, and the fact that the Japanese have the highest savings of the western allied orientated nations. The Yen is backed by savings.
If we do see a move up here on the Yen, you must consider the possibility of some sort of negative news. Perhaps about the Coronavirus being worse than admitted by the Chinese. This is likely. I do not trust Chinese economic data, nor would I trust their data on the virus.
So we may be setting up for a pullback in equities on this news maybe which will come out next week. Just seeing the cycles of the chart.
So some pairs that look interesting:
EURJPY may trigger here on the daily candle break today.
CHFJPY may not trigger until next week.
USDJPY interesting on the 4 hour, but not the best looking trend that I look for.
Other yen pairs remain below their first lower high swings on the daily charts.


Potential Japanese Yen Move...Market Pullback?Looking at the Japanese Yen Futures on the 4 hour chart, and we are beginning to see the ending or exhaustion of this downtrend. We are not making anymore more lower highs, and it seems we may be setting up for a first higher low...this will be shown with the head and shoulders pattern we are seeing but awaiting for the trigger.
The Yen generally has a correlation with the equity markets (although I stress this is now always the case...especially in this macro environment where we are seeing a disconnect as funds and investors need to chase yield with the stock market being the only place to do so).
Some yen pairs that I have been watching have already triggered like AUDJPY, EURJPY, and TRYJPY.
USDJPY is looking prime:

THE BEAST ANALYSIS + Other Pairs Overview Dear traders,
Getting ready for the next week battle :
in this video i'm sharing my charting for DXY and other pairs
My impression is that The Dollar is very Bullish but located @ Supply zone ( that been pierced tested many times now deeper into the zone )
the zone is @ D Completion of Bearish Gartley Pattern !!!! Watch it closely because right on top of it we have a Bearish shark pattern waiting @ 98.28- 9854 @ MLSR
Other currency pairs overview to find out in the video
If you guys enjoyed this video , Kindly leave your comments your thoughts
you can follow me here for more content, if you want to learn more how to approach the forex market with the methodology i'm using, plz drop me a message for more educational posts
Thank you.
courage.

#Yen weekly chart update ! The futures chart suggests we are very close to be breaking out of a 4 year consolidation ( in this case barrier triangle ) in the price of Yen. This move should last aprox 2 years ( i am looking for wave equality of C vs A) , which looking at the macro global picture means that we should be getting ready for a period of strong risk averse sentiment , turbulent equity markets and overall defense style approaches. The catalyst for this remains to be seen, but the charts are telling you this before it happens. Buckle up !!

Yen 0.382 pullbackYen futures has completed a 0.382 pullback from it's recent impulse wave. Will be looking to go long once the EMAs and MACD are bullish on the 4 hourly chart

Yen futures breakdown and retest scenarioIt appears that the yen has completed a 50% correction of the previous impulse down move. I am waiting for a breakdown through current support levels so that the MA's and MACD will turn bearish and then place a short order at this support turned resistance level.


Yen consolidation tells it allThis is why I believe that the USDJPY will continue Bullish. Investors at this time are optimistic about the US-China trade deal so the price of the Yen is at a low price equilibrium. Momentum and MAs all are indicating that bearish momentum will be here for a while. The only thing that could change this sentiment is the US President and Chinese Officials derailing the phase 1 deal.
Current market sentiment - contraction bearish


LONG - ABC correction finishedThe ABC correction could have been completed, now a movement of 1 to 5 is expected in search of new highs.
SPX near maxiums

JPY Futures Index - Trend Change in Yen CrossesJPY Futures chart shows the Yen is currently oversold, broke below falling wedge, approaching strong trend-line and horizontal support.
Watch for trend reversals across all JPY crosses. (Individual charts for Yen crosses show many pairs approaching Daily resistance zones)
Yen crosses tend to produce decent trend trade opportunities. The large impulsive move in August, shown on the chart, is a perfect example (Sudden shift to Risk Off sentiment, as S&P saw a sharp selloff) . AUD NZD CAD and even GBP (Risk currencies) would provide good short opportunities in a similar situation.
Higher time-frame charts show JPY trending higher, allowing us to trade with trend.
