6J1! trade ideas

Yen looking to head south.I see Yen making a lower high on the 4 hour. Would love to hear your input.


Japanese Yen: Bullish Patterns I have been interested in going long the Japanese Yen futures contract since the completion of the large Bullish Cypher pattern (I first saw this idea by @TradingJazz on USDJPY, his original idea is linked below).
I got picked up on a long at .8811 last night but took my small profit when it seemed it was heading back down after making a lower high. I am now looking to get back involved, and have identified two possible bullish patterns : Butterfly and Bat.
The PRZ of the two patterns will likely complete at the trendline since the Yen's December low which is another additional confluence in addition to these two patterns and of course the very large Cypher. As this is a large PRZ I will be watching this zone closely prior to entering in hopes of entering entering as low as possible with the least amount of risk I can to try and enter the possible large move.
If you have any comments or feedback on this idea, or your own view of the Yen, please feel free to share it!

Key SupportWith a lot of the Yen pairs looking over extended here its worth noting the Japanese futures is approaching a key support area for a potential bounce

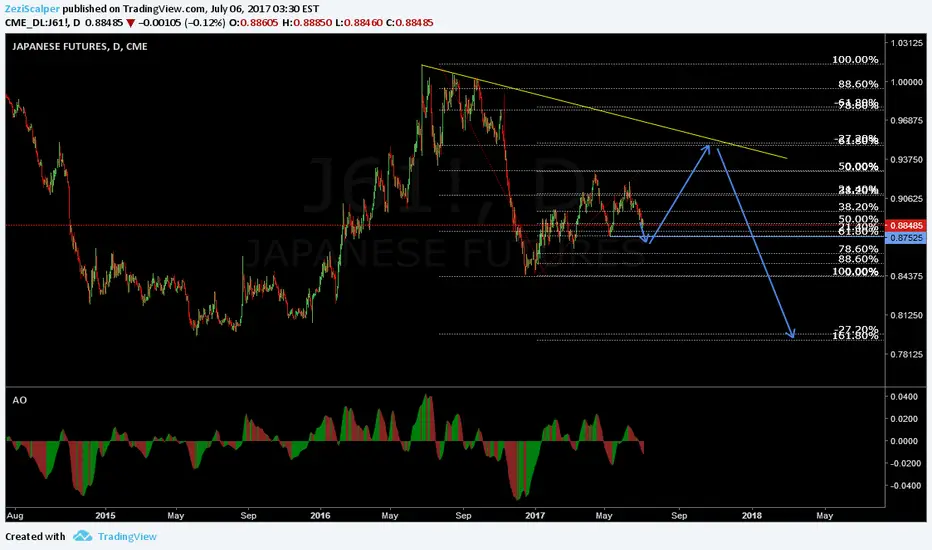
More downside for YEN?Hey guys, Ive been tracking yen futures and posting updates for forex fb group. This is good to look at for JPY pairs. Looking for more downside on YEN, so upside for xxx/JPY pairs


J6 06 April 2017There are several divergences on volume on way up. There is also increasing volume on down swing. This is bearish change behaviour. I expect move down on Yen future. It means on forex pair USDJPY.

Yen futures are offBreakout for the Yen. Looks like we'll strengthen at least to the 200dma at 0.9280. Stop below 0.8950.


