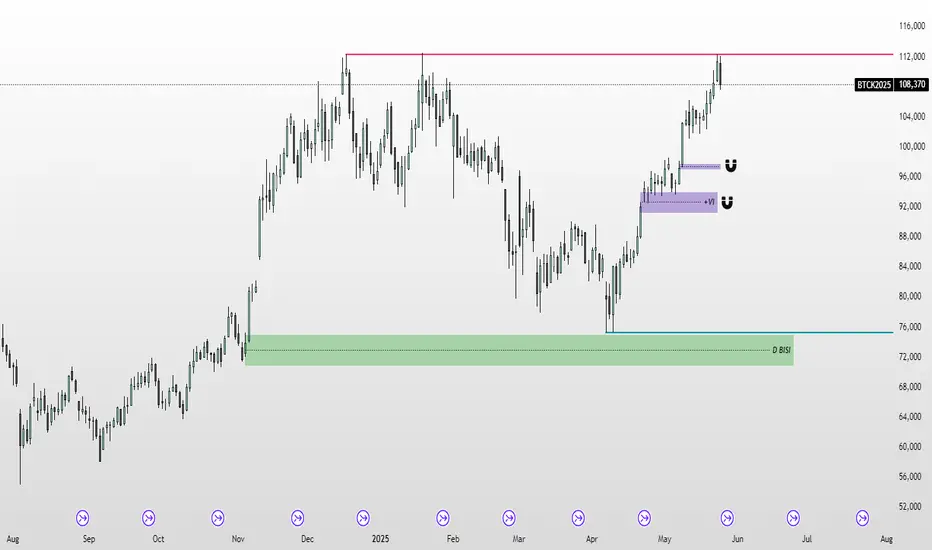
5 Bearish Signals —Bitcoin CME Gap (91,970 - 92,525)Bitcoin's bearish bias is confirmed clearly. Bearish signals are starting to pile up one on top of the other, let's recap those real quick:
1) Bitcoin is trading below its December 2024 high, it's January 2025 peak price and the recent 22-May all-time high. Trading below these levels open the doors for a move downward.
2) Recent lower high. 10-June closed lower compared to 22-May. This is a local lower high.
3) Overall low volume. Total volume decreasing since January 2025. No strong buying activity.
4) Sustained growth. Bitcoin grew straight up for 45 days. It is normal to see a retrace after sustained growth.
5) CME Gap. This is the latest signal that came to my attention and this gives further strength to the bearish case. The GAP sits between $91,970 and $92,525.
It is likely that Bitcoin will move lower before producing a new all-time high. Bitcoin is not likely to move below 80K. This is very unlikely.
Most likely Bitcoin will find support above 90K and if it moves below 90K this might be a brief occurrence lasting only a few hours or a few days at max. When all is set and done, we will continue to see long-term growth based on a bullish structure of higher highs and higher lows. The 7-April bottom will remain untouched.
Namaste.
BTCM2020 trade ideas
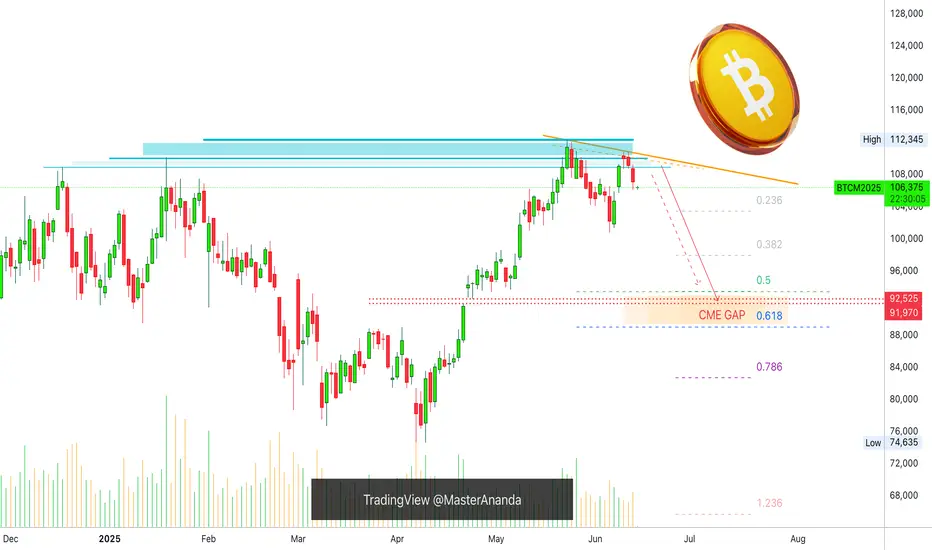
Chart Pattern Analysis Of Bitcoin
There are 4-5 candles consolidate around the resistance,
And the demands keep decreasing.
Compared to K3,
the demand at K4 increased, but it failed to close upon K3.
If K5 is a doji candle close at low price area,
Or,If K5 starts with a bear gap to close below K4,
It is likely that the following candles will fall to test 0.5fib area.
I will try to buy it there.
But now, I will cut off at least half of my long positions if I bought it earlier.
On the other hand,
It is also possible that K5 break up K4 and even close upon it.
That case will be out of my ability to take profit from it.
Short-107444/Stop-108444/Target-92K

BITCOIN (BTC) Analysis For The WeekI've been studying BTC and others and want to share my analysis. Trading involves probabilities, so it's essential to be confident and prepared. Study the market thoroughly before trading with real money.
Let's test strategies this week. You may use a live account if you have capital, and manage your stop losses carefully. Next week, I'll provide more details on entry points and stop losses. Wait for trades at specified levels and avoid positions in the middle to minimize losses. Be patient and trade from one edge to the other.
Good luck and make money.
For one-on-one sessions: $20k per person. You'll learn weekly, monthly, and yearly calculations. Weekly subscriptions are also available for $500 per person.

ETH ShortETH & BTC have similar POIs but BTC approaching much sooner. I think BTC could go higher, allowing ETH to push into the zone and simultaneously creating BOS for BTC which would then turn into another opportunity (for Buys) later

Bitcoin’s Bearish Signal: Key Levels to WatchFenzoFx—Bitcoin consolidates near $104,225 after breaking below the bullish trendline, signaling a possible break of structure. This level acts as immediate support, and a bearish wave could form if BTC closes below it, targeting the $101,880 demand zone.
The bearish outlook remains valid unless Bitcoin surpasses $108,215. If broken, price could rise toward $111,800.

2/2 Bitcoin looks similar to 2021Post 2 of 2
#Bitcoin is trading similarly to 2021.
Major difference? The move is more ORGANIZED today.
Volume is substantially more.
Did #BTC top, like really top?
We want to say no, but things can change!
Current:
$ Flow is much weaker vs December 24 top.
RSI is lower as well.
It looks like CRYPTOCAP:BTC will likely break 100k again, 95k IMO.
80k = IMPORTANT AREA!

Check support near 106775
Hello, traders.
If you "Follow", you can always get new information quickly.
Have a nice day today.
-------------------------------------
(MBT1! 1D chart)
The prerequisite for the previous ATH to rise above is that the OBV must rise above the High Line and remain there.
Accordingly, the key is whether it can be supported and rise near 106775.
If it fails to rise, it is likely to fall to the 96600-101495 area.
The 96600-101495 area is an important support and resistance area for continuing the uptrend.
Therefore, if it falls in the 96600-101495 area, it is likely to fall sharply.
If it falls,
1st: Around 89745
2nd: M-Signal indicator on the 1M chart or 74105-79025
You should check for support near the 1st and 2nd areas above.
Therefore, the 96600-101495 area can be seen as an important support and resistance area.
-
(30m chart)
It played the role of support and resistance by touching the area around 105385 several times.
It is expected to determine the trend again when it meets the M-Signal indicator on the 1D chart.
-
Thank you for reading to the end.
I hope you have a successful trade.
--------------------------------------------------
- Here is an explanation of the big picture.
(3-year bull market, 1-year bear market pattern)
I will explain the details again when the bear market starts.
------------------------------------------------------

BTC 2H#BTC
All Eyes on the CME Gap: $101,390 – $100,880 📉
Given the heightened geopolitical tensions between Iran and Israel, market volatility remains elevated.
🎯 There’s a strong probability this gap will be filled.
⚠️ Trade cautiously and always use a stop-loss to protect your capital.

Micro Bitcoin Futures-MBTCME:MBT1! I’ve entered a short position on Micro Bitcoin Futures (MBT1!) based on a potential mean reversion setup.
Price recently touched the upper Bollinger Band and met resistance near the 109–110 zone. Given the overextension and slowing momentum, I’m anticipating a pullback toward the lower band, aligning with previous support around 102.7.
Entry: 107,400
Target: 102,740 (+4.33%)
Stop-Loss: 109,255 (−1.73%)
Risk/Reward Ratio: 2.5
This setup is driven by the classic Bollinger Band strategy – shorting near the upper band with confirmation from resistance and aiming for a reversion to the mean. Let’s see how this plays out.

Bitcoin Update + Bitcoin CME Gap CONFLUENCE
POSTING FOR AWARENESS NOT TO PANIC Y'ALL, True trader will be optimistic as always and can play both sides of market. 💯
Just incase PBr1 won't hold as aggressive bounce base on my recent update, Since nandun ang possible aggressive volume sa short term PBr1 for possible breakout sa ATH i just want to tell you ahead if ever market will not respect short term PBr1 — Two Major Support are waiting below
— First, 94k range area
— Second, Base my own strat overall structure PBr1 support 88k - 89.5k range area
will just drop this idea just incase may possible waiting area na kayo for confluence sa possible DCA or if you have a decent short swing also pwede maging confluence for your exit points.
📍 PINNED, always remember BITCOIN is just one of our major coin confluence to our altcoins trades. Trade base price action not emotion.

1/2 Bitcoin call was good, so far, short term top in placeNot long after our post May 20th we began to sell some CRYPTOCAP:BTC ETF's. It was a good call, still have some, & we believe #Bitcoin still has consolidation in order.
We're waiting to see how the #BTC RSI reacts & wow it reacts to the Green Moving Avg.
Selling volume is light & this means that there is a LACK of BUYERS, at least for now.
#crypto
Please see our profile for more info on posts.

BTC Faces Critical Resistance—Breakout or Further Decline?FenzoFx—Bitcoin continues its bearish trend after hitting its 2025 all-time high at 113,165. BTC/USD is currently trading near $105,400, a high-volume area where price could either bounce or break lower.
The key resistance level rests at $103,170, supported by a bullish Fair Value Gap. If price holds above this zone, Bitcoin could rise toward $107,090.
However, a close below $103,170 would invalidate the bullish outlook, with the next bearish target at $99,435.

BTC short term I expect to see the retest of the highlighted area such as the 100k$ level, where we left the closest imbalance unfilled after taking the highs and not spooling higher, I assume we receive some kind of distribution during the summer in the range from ATH to the marked levels, after which we would have to see whether the structure will allow us for the continuation of the trend if it shows strong reaction and just wicks through the highlighted levels
Generally, I think we are close to the pivot point but still have some time for other assets to show if they want to perform, when everyone will be buying in the range which likely be part of the distribution for BTC, I refrain from any long term investments or long speculations. Might trade some swings though if the range offers such.
If we continue going higher conservatively looking I think 120-130 k will be the maximum we can spool towards

BULLISH BTC: MOVING AS EXPECTED!!!!Coming down to VWAP, will bounce back up @ 104K-105K . Next stop 120K!!!

Bitcoin to $115k or pullback to $91kGood Evening Traders,
First I would like to say, congratulations to all of you who have been in the game for the last 3 bitcoin halving cycles. Through all of the "You buy fake internet money" comments or the never ending explaining of the Tokenomics of different cryptocurrencies, I have to say KUDOS to all of us who saw the vision, stuck to your guns and intricately added to your bags over the years! We are finally here on the cusp of full regulation and a final hush of the naysayers!
Ok, now down to brass tax! On the chart I have Highlighted a few important details. Something I did not point out on the chart is the massive printing of USDT that has been happening over the past few days. It seems to me that we are on the cusp of a massive influx of capital into the alt coin markets. But, for now lets focus on Bitcoin! As stated, you can see multiple points that I have highlighted... These being mostly bearish for the big dog of market cap and the grandfather coins of crypto Bitcoin. The first few things to notice is the bearish divergence on the MACD histogram, the bearish down cross of the MACD line over the signal line on the MACD indicator. You can also note the overbought area on the RSI right above that. In addition to this we do have some gaps on CME:BTC1! Which generally get filled sooner than later on most charts.
With this in mind, it is possible that we could have some good news amongst the movers and shakers down at the Bitcoin conference this week. Yet, we could get some sell the news type events that could ease the price downward to fill in these gaps that we have below. In my experience at the beginning of each alt coin season Bitcoin generally leads the rally and can trade sideways to down during the upward movement of the majority of the altcoin market.
My personal thoughts on the chart currently is shown at the top of the chart. if we close the daily candle underneath the hyperlocal resistance shown on the red line at the top of the chart, then we will most likely start pulling back to fill the first gap that is shown on the chart below in yellow. Albeit, the MACD is a lagging indicator, we can gain a lot of insight using it and my favorite sign on the MACD is using the histogram to point out bearish and bullish divergences. This shows a lack in momentum in the current trend that is shown through the price action of the assets trend. Especially, after a straight run up like we have just experienced as of late.
In conclusion, you can make the assumption that if we close the current day under the red line above it is very possible that we begin what could turn out to be an ABC correction leading us down to fill in the gaps on BTC1! to the downside. If we hold the first support, BTC may show us a little more juice potentially reaching for just under $115k. This in my opinion would likely be a bull trap for the time being. Summers are not the best when it comes to crypto growth and it always seems like we are waiting for the Ground Hog to see its shadow to find out if we are to the moon or back to McDonalds with our friends!
I hope that this analysis has helped you gain some insight in your research. I have added supports to the chart to show you where we may turn around and start heading back into price discovery.
Stay Profitable,
Savvy

BTC: BULLISH RUN TO 120K HAS BEGUN!!!Using the prior periods triple bottoming tail pivots several months ago, you can visually see that the same pivots occurred several weeks ago and another pivot today confirms the upward trend to $120k.
The trend lines show that the VWAP and the EMA are not being violated in most cases. Candles touch the average, than bounce upwards.
Keep it simple, easier to see the upward/downward trend without Elliot Waves.

BTC CMA 92,000BTC CMA 92,000
We are currently at a temporary peak and strong, but not final, selling zone. We have a price gap reaching 92k, and a strong reversal to it is expected. Stay tuned for any new updates.

I had already taken this trade, just documenting itNothing significant to mention, just that it is a good opportunity of a bounce

CME Futures PREMIUM —Bitcoin Will Continue To GrowThe PREMIUM between Bitcoin's CME Futures and spot price is still on. This means that Bitcoin continues bullish.
In a previous article, I used this signal to predict a bullish breakout and bullish continuation. When there is a bullish bias Bitcoin becomes more expensive on CME vs spot, it means buy demand is very strong. With a strong demand for Bitcoin from the public, prices continue to grow.
There is a huge difference between the double top in 2021 and the chart structure in 2025.
The double top in 2021 came out of a 5-up waves pattern. The current top comes out of a 7 months long consolidation phase. Based on Elliotts law of alternation, the bull market will end in a blow off top in 2025 rather than a double top. This means that we will see one final and very strong move up followed by a crash, and that's how the bull market will end. Think of 2017/2018 and you can get a perfect picture of how the bull market will end. The only question that remains is about how far up prices will go, will the bullish wave end at $157,425 or will it go to $211,855?
Six months is enough to reach the second target.
This is a friendly reminder.
Bitcoin will continue to grow.
Namaste.

The Leap - June 2025 (Pre-Month Analysis)This is my analysis for the upcoming TradingView competition pairs for the month of June. I'll do a weekly analysis each week, starting at the beginning of the month and after each week.
Good luck to all who are joining!
- R2F Trading

Here's your chance to get in on the shortSo btc has failed auction and risen towards the structure POC
it is also the 0.75/0786
if this doesnt hold im looking at the 113,575 (1.25 fib)
and the 1.618 at 115430
i dont know which will hold i just know where i want to look for a hedge.
in order to do so i want a good high (long selling tail) and good oscilation data.
shorts are getting rekt and squeezed.
as we make new ath's
soon there wont be any more liquidity to grab

Short & Long Position on Bitcoin Futuredescription is explained on the chart for better understanding

Bitcoin levels to watchI'm Bullish on this asset, however I'd be interested to engage when the inefficiencies below the current market price has been mitigated. It'll get there sooner or later, and until it happens I'm just going to sit on my hands.