Pick up the peaces All ideas are strictly my interpretation of price action. I am not a professional trader nor is this
professional advice.
I will continually update all trades.
BTC1! trade ideas

🅱️ Bitcoin's Crash Starts Next Week (Weekly Chart)Are you a Bitcoin futures trader?
If you are, I am sure you will agree with what you are about to read:
👉 Bitcoin is set to crash next week.
Looking at this chart, we have:
➖ First, a top pattern in the form of a cap.
➖ Then, both the ATH and proceeding lower high sessions closed red; both below EMA10.
➖ We have two weeks of trading below EMA10; bearish bias confirmed.
Expect something like this:
👉 First a drop toward EMA50 (~46,000) that will surely produce a bounce and short-term lower high, followed by a test of MA200 around $34,000. This is based on the weekly timeframe.
Let me know if you agree in the comments.
Thanks a lot for your continued support.
Namaste.

75: Assessing Bitcoin's Weakening, Exploring Strategic OptionsAs we closely monitor the current trajectory of Bitcoin, it's evident that its strength is diminishing, prompting a thoughtful examination of our strategic options. In navigating this landscape, it's imperative to remain agile and responsive to market dynamics.
Should we witness a loss of the 65475 mark within the span of this week, the scenario of adopting short positions becomes a compelling consideration. This tactical move would capitalize on the prevailing bearish sentiment, potentially yielding favorable outcomes amidst downward price movements.
Conversely, if the aforementioned threshold remains unbreached, our focus shifts towards discerning signs of renewed bullish vigor within the market. We eagerly anticipate indications of resurgent momentum, signaling a favorable environment for reassessing and potentially bolstering our long positions.
In essence, our approach remains adaptive and nuanced, attuned to the ebb and flow of market dynamics. By remaining vigilant and responsive to emerging trends, we position ourselves to navigate the evolving landscape of Bitcoin trading with prudence and effectiveness.


$BTC map for the next few monthsCRYPTOCAP:BTC is in an obvious downtrend.
THE QUESTION is, "when will it reverse course"?
#BTC will most likely change course before the end of one of the phase that we posted.
#Bitcoin Phase 1 is a total of 3 months. Phase 2 is a total of 6 months.
Purple vertical lines.
We already hit oversold a few days ago.
IF we retest the lower range we want an RSI higher than where it is now.

BTC1!cautiously optimistic bc new moon now, but 62.5 may be our spot
fill of last friday's cme close and meme diag support confluence
BTC1!

HODL with a TwistCME: Micro BTC Futures ( CME:MBT1! )
Federal Reserve monetary policy is the dominant market mover across asset classes. Financial markets around the world rise and fall by any hint of the next policy move.
Last Friday, US stocks jumped after a weak April jobs report boosted hopes that the Fed could start cutting interest rates soon. The Dow Jones Industrial Average gained 450 points, or 1.18%, to 38,675. The S&P 500 surged 1.26% to 5,128, while the Nasdaq Composite rallied 1.99% to close at 16,156.
The nonfarm payrolls report, released by the Bureau of Labor Statistics, showed 175,000 jobs gain in April, below the 240,000 jobs expected by Dow Jones economist survey. The unemployment rate edged up to 3.9%, versus 3.8% in March.
After the jobs report, traders now price in a second rate cut by the end of 2024. Fed funds futures trading data suggests a 66% likelihood of a 25-basis-point rate cut in September, according to the CME Group’s FedWatch tracker of futures market pricing.
Don’t Pinch Your Hope on More Rate Cuts
Investors often attempt to front run the Fed’s decisions. Track records show that they are usually wagering the wrong bet. As recently as last December, they expected seven rate cuts in 2024 and pushed major stock indexes to a series of new record highs. Lately, the rebounding inflation ditched the hopes for early rate cuts. Before last week, market consensus was down to one rate cut in 2024, with talks of no cut and even a rate hike.
In my opinion, investors speculating on rate cuts overlooked a key factor, the 2024 US Presidential Election. With election day less than six months away, the Fed would be cautious with abrupt policy moves. They tend not to shift policy directions ahead of the election, just to stay clear of any accusation of influencing the result in any way.
Many investors pinch rate cut hopes on the assumption that the Fed would ease rates to help the current Administration get reelected. They failed to understand that the Fed Chair is not a cabinet member. He reports to the Congress, not the President. The Federal Open Market Committee, the rate-setting body, is not a department in the Executive Branch. It was founded by the Congress and will report to the Congress only.
The Fed has kept the rate higher for longer than many of us expected. Since the last rate hike in July 2023, they kept the Fed Funds rate unchanged in the past six meetings.
Borrowing costs, including mortgage rate, auto financing, credit card and business loan, have all been pushed up significantly in the last two years. One or two rate cuts would not materially lessen the cost burden incurred by households and businesses.
Despite headwinds and signs of the US economy cooling off, US stocks are currently priced near their all-time high levels. It is not a good time to jump in and chase the high prices. On the other hand, shorting the market now is a risky proposition. Investors exhibit strong tolerance for bad news. The best move is to wait. Outside of stocks, cryptocurrencies show upside potentials, particularly from a long-term perspective.
Investing in Bitcoin for the Long Haul
On February 14th, I posted this trade idea, “A Bitcoin Bull Run?”. At the time, spot Bitcoin was trading at around $50,000. Bitcoin reached a new all-time-high of $73,000 on May 3rd. It has since fallen to as low as $58,000 and is now trading at $64,125.
I identified three fundamental key drivers for a secular long-term bull market for cryptocurrencies, which is recapped below:
• Firstly, there is a limited supply of bitcoins with a total cap of 21 million.
• Secondly, the demand for crypto investment could increase substantially.
• Thirdly, an excessive dollar supply could help raise bitcoin prices.
Today, I would like to focus on the technical strength illustrated in Bitcoin price chart. In the past eight years, Bitcoin managed to reach a new high four times, after experiencing significant drawdown each time.
• After peaking at $20,089 in 2017, Bitcoin fell 84% to $3,191 by December 2018.
• The next bull run, starting in September 2020, pushed Bitcoin price to a new ATH at $58,777 in March 2021. This is a gain of 192% from the previous ATH, and up 1742% from the previous low.
• Bitcoin price was cut in half to $29,562 in July, before rising to another ATH of $69,000 in November 2021. This is a gain of 17% from the previous ATH, and up 133% from the previous low.
• In the next year, Bitcoin fell to $16,625, a drawdown of 76%. The SEC approval of Bitcoin ETF pushes the benchmark cryptocurrency to its new ATH of $73,000 in March 2024. This is a gain of 6% from the previous ATH, and up 339% from the previous low.
Bitcoin price trend shows that investing in Bitcoin in the long run has been profitable. However, timing makes a significant difference in investment returns.
Trading Bitcoin with Futures Rollover Strategy
While the view of holding on for dear life (HODL) is shared by many Bitcoin investors. There are several issues when it comes to investment strategies.
Firstly, with bitcoin trading over $64,000, future price increases do not offer the same level of return dollar for dollar. Hypothetically, if Bitcoin goes back up to its ATH of FWB:73K from GETTEX:64K , the $9,000 gain equals to 14% in return. For a comparison, if you bought Bitcoin for $17K in December 2022, the same $9,000 gain would be 53% in return. To counter the effect of higher prices, investors could consider using leverage.
CME Micro BTC futures ( LSE:MBT ) provide leverage and capital efficiency. The contract notional is 1/10 of 1 BTC. Initial margin is $1,515. The June contract (MBTM4) was last settled at $63,865. At current price there is a 4.2 times leverage built in the contract, which is the ratio of 6,386.5 (1/10 of 1 BTC) divided by 1,515. If the futures price touches the previous ATH, a long futures position would gain $913 (= 7,300-6,387), and the return would be a +60%, vs. +14% investing in spot Bitcoin, as we illustrated above.
Secondly, futures contracts have a limited lifespan that will influence the outcome of your trades and exit strategy. Micro Bitcoin trades actively in the nearby May and June contracts. Liquidity in the back-month contracts has yet to pick up. A trader may be right about the long-term rise in Bitcoin prices. However, this may not happen in the next two months before the nearby contracts expire.
To maintain a long position in Bitcoin over the long run, while enjoying capital efficiency through leverage, a trader may employ a futures rollover strategy.
Rollover is when a trader moves his position from the front month contract to another contract further in the future, prior to the expiration of his existing holding.
The title chart illustrate how to hold a long Micro Bitcoin Futures (MBT) position overtime:
• In April, a trader buys (going long) a June contract (MBTM4).
• Approximately two weeks before the contract expires on June 28th, the trader enter an offsetting trade, going short on MBTM4, to close his existing position. He would book a profit or loss, determined by the difference in selling and purchasing prices.
• Simultaneously, the trader would buy an August MBT contract (MBTQ4) and reestablish a long position in Bitcoin.
• In mid-August, the trader will close out MBTQ4 (going short), and buy an October contract (MBTV4), and continue to hold a long position on Bitcoin.
• The trader would repeat the above steps, so far as he holds a bullish view.
Finally, Bitcoin prices are extremely volatile. Holding spot Bitcoin with no leverage could face potential drawdown of 70%-80%. With leverage in futures, a sharp price move in the wrong direction could quickly deplete the available fund and trigger margin calls.
One advantage Micro Bitcoin has over the spot crypto is the daily price limit. If Bitcoin moves up or down 10% within the trading day, futures trading will be halted. This will give the market time to cool off and help investors avoid being blown out by short-term panic.
Experienced investors may consider using stop loss on futures or buying a protective put options to hedge such downside risks.
Happy Trading.
Disclaimers
*Trade ideas cited above are for illustration only, as an integral part of a case study to demonstrate the fundamental concepts in risk management under the market scenarios being discussed. They shall not be construed as investment recommendations or advice. Nor are they used to promote any specific products, or services.
CME Real-time Market Data help identify trading set-ups and express my market views. If you have futures in your trading portfolio, you can check out on CME Group data plans available that suit your trading needs www.tradingview.com

BITCOIN ROAD TO $42KCRYPTOCAP:BTC on the daily is creating a white swan pattern.The pattern completes around 42k zone.
For confluence the BTC chart is also creating a NAVARRO 200(1)harmonic pattern that completes around the same zone
To point out there is also a strong support zone around 53k-51k area where BTC might bounce up before continuing with the down trend.

Bitcoin5.1.24 I picked Bitcoin as an example of how I look at potential trades as a buyer or a seller using gaps the way I look for gaps and whether or not the market retest those gaps or not. I'm making my trade decisions by looking at bars on the chart not all the ancillary tools that you can put into your chart.... I don't use those tools because they cause conflict and they're not efficient in finding good trade locations. With that means is that you have to think on your own and count on your trade decisions in real time. if you know how to read a market you can set it up using the tools that I look at and they'll tell you ahead of time where you need to spend some time to take a trade or not.... and what the target could be and what the stop should be.... according to your decisions as a trader who knows how to read the market.

BTC at a critical Juncture REview 4-30-24Going over the BTC chart its at a critical juncture. looking for clues to what the market is telling us.

BTC Price action review 4-29-29going over the Price action BTC looking for clues from over the weekend. trying to see if any A+ setups.

Tesla Gold Silver Bitcoin4.29.24 I think the test was coming to an area where it's running into Sellers.... even though it's a bullish pattern... so I explain my thinking there. There's a little bit of a mixed message between the dollar which is going lower at the time I'm doing this video whether I would take a tradethe gold market. And I looked at the silver market... and I took a quick look at bitcoin which I think is in arranging market.

Bitcoin Bull FlagCME:BTC1!
Possible Bull Flag on CRYPTOCAP:BTC
Measured move approx 96400. Could we get a Fakeout as the ignition for this move.
Post Bitcoin Halving ... markets look just as exciting.
Aggressive entry on candlestick currently printing (not closed on D)
Always have Plan A and Plan B and manage Risk.
Always having Plan A and Plan B scenarios so we can react once the markets provide an opportunity to execute our edge.
If you liked this idea or if you have your own opinion about it, write in the comments.
The information and publications are not meant to be, and do not constitute, financial, investment, trading, or other types of advice or recommendations.

BTC longer term Analysis Going over the BTC chart longer Term looking for clues and how we could have traded it better.

bitcoin, 125k back on the table.. by late junethe cme chart shows a clearer picture.. hope it works out!

Decending Triangle FormationHello all,
I was quite bullish as of recent however this phase has shown some bearish activity. Stoch RSI has not reset as quickly as I would like to see and a Decending triangle formation is printing. Time will tell.

Bitcoin on the Brink: Bollinger Bands Hint at Potential Price BrBitcoin, the world's most popular cryptocurrency, has been exhibiting some intriguing technical signals lately. The cryptocurrency's volatility indicator, the Bollinger Bands, has narrowed significantly, reaching levels last seen in mid-February 2024. This development has sparked speculation among analysts about a potential price breakout for Bitcoin (BTC) in the near future.
Bollinger Bands Explained:
The Bollinger Bands is a technical analysis tool that measures price volatility. It consists of three lines: a simple moving average (SMA) in the center, and an upper and lower band plotted at a specific standard deviation distance above and below the SMA, respectively. The wider the bands, the higher the volatility; conversely, narrower bands suggest a period of compressed price movement.
What Does the Narrowing of Bands Indicate?
When the Bollinger Bands contract, it typically signifies a period of low volatility or consolidation. This can be interpreted in two ways. One possibility is that a breakout is imminent, with the price poised for a significant move in either direction – up or down. The other possibility is that the current price range may hold for a while longer, with continued consolidation.
The Mid-February Precedent:
The current narrowing of the Bollinger Bands is particularly interesting because it mirrors the situation observed in mid-February 2024. Back then, the bands contracted to a similar degree, and it was subsequently followed by a price surge that saw Bitcoin climb above $50,000. This has led some analysts to believe that history might repeat itself, with another price breakout on the horizon.
Is a Breakout Guaranteed?
However, it's crucial to remember that technical indicators, like Bollinger Bands, are not crystal balls. While they can provide valuable insights into potential price movements, they don't guarantee future outcomes. Several factors beyond technical analysis can influence the price of Bitcoin, including:
• Market sentiment: Overall investor confidence towards cryptocurrencies can significantly impact Bitcoin's price. Positive sentiment can fuel a breakout, while negative sentiment could lead to a downward price movement.
• Regulatory landscape: Government regulations and policies aimed at cryptocurrencies can create uncertainty and impact investor decisions.
• Major news events: Significant global events, such as economic downturns or geopolitical tensions, can influence the price of Bitcoin as investors seek alternative assets.
What to Watch Out For:
Given the inherent uncertainty, investors should closely monitor these additional factors to gauge the direction of a potential breakout. If positive market sentiment coincides with the Bollinger Band breakout, we could see a significant surge in Bitcoin's price. Conversely, if negative sentiment prevails, the breakout might be short-lived, or it could even lead to a price correction.
Conclusion:
The narrowing of the Bollinger Bands is a noteworthy development for Bitcoin, suggesting a potential breakout on the horizon. However, investors should exercise caution and consider broader market factors before making any investment decisions. By combining technical analysis with a well-rounded understanding of the cryptocurrency landscape, investors can position themselves to potentially capitalize on Bitcoin's next price move.

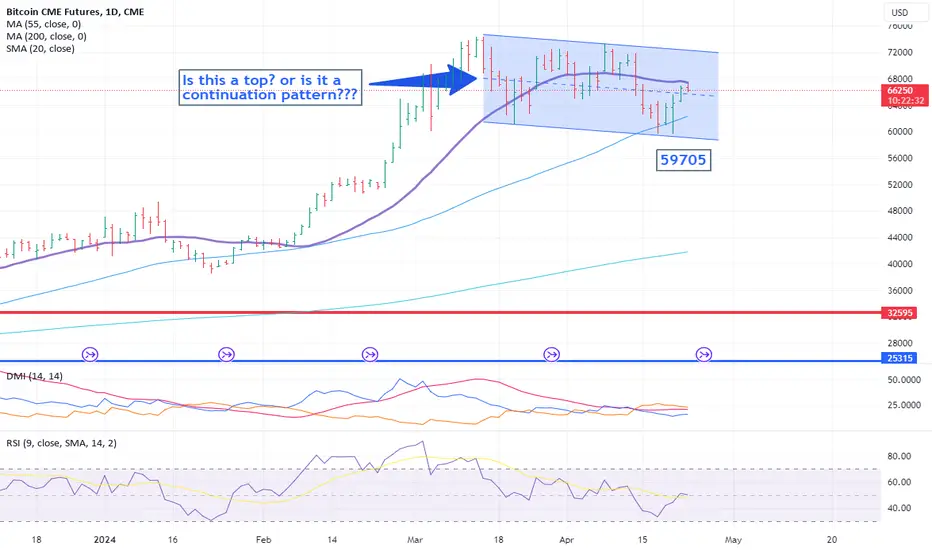
Bitcoin - Continuation pattern or a top?Bitcoin - continuation pattern or a top?
Determining whether the pattern is a continuation or a top pattern can be challenging. One signifies a bullish trend while the other indicates a bearish trend, and we find ourselves amidst a 4-week range on the bitcoin chart. So, how do you proceed?
To analyse the situation, I typically examine the chart across various time frames. In the case of Bitcoin, both the daily and weekly charts present a mixed picture, leaving room for either pattern interpretation. However, the monthly chart suggests we might be approaching the upper boundary of a 4-year channel (refer to the chart below), though it's not conclusive yet. Zooming back to the daily chart, we observe that the market is encountering the 20-day moving average at 67,414, while on the 4-hourly chart, it appears to be stalling near the top of the cloud.
This additional insight is beneficial. Considering the proximity to the upper boundary of the 4-year channel, the moving average, and the cloud, our inclination leans towards a downside bias, particularly if the market remains capped by the 20-day moving average.
To confirm a downward trend, we would need to breach the recent low at 59,705. However, if our assessment is incorrect, a key indicator to watch for would be a close above the 20-day moving average, redirecting focus towards the upper boundary of the 4-month range, currently around 72,200. A close above this level would bolster the case for a continuation pattern, with further confirmation above the March high of 74,415.
#bitcoin #patterns #technicalanalysis #lovecharts
Disclaimer:
The information posted on Trading View is for informative purposes and is not intended to constitute advice in any form, including but not limited to investment, accounting, tax, legal or regulatory advice. The information therefore has no regard to the specific investment objectives, financial situation or particular needs of any specific recipient. Opinions expressed are our current opinions as of the date appearing on Trading View only. All illustrations, forecasts or hypothetical data are for illustrative purposes only. The Society of Technical Analysts Ltd does not make representation that the information provided is appropriate for use in all jurisdictions or by all Investors or other potential Investors. Parties are therefore responsible for compliance with applicable local laws and regulations. The Society of Technical Analysts will not be held liable for any loss or damage resulting directly or indirectly from the use of any information on this site.
War and Your Wallet: Will Your Investments Buckle or Boom?Geopolitical tensions are on the rise, and it's natural to worry about the impact on your hard-earned investments. While war can be a scary prospect, history offers surprising insights into how traditional assets perform during such conflicts. But what about newer asset classes like cryptocurrency? Let's dive in.
The Stock Market Rollercoaster: Dips, Recoveries, and the "War Puzzle"
Brace for Impact: Wars often trigger initial stock market dips as investors grapple with uncertainty. World War I and II are prime examples. But here's the good news: these dips were usually temporary, followed by significant rebounds.
Seeking Shelter: When war clouds gather, investors often flock to "safe-haven assets" like gold, government bonds, and strong currencies. Gold, with its limited supply and historical value as a store of wealth, is a popular hedge against economic turmoil. Investors view it as a stable asset that retains its value even during times of crisis.
The "War Puzzle" Explained: Researchers have observed a fascinating phenomenon. Stock prices might decrease as war seems likely, but then paradoxically increase once war actually breaks out. This could be because pre-war uncertainty spooks the market, while the actual conflict provides a (grim) kind of clarity.
The Evolving Investor and the Market's Resilience:
Learning from the Past: With more experience dealing with geopolitical turmoil, investors are adopting a more measured approach. Lessons learned from recoveries like the post-9/11 one make investors more likely to hold their nerve during short-term dips.
Built to Withstand Shocks: The stock market has a long history of weathering storms, including wars. This resilience comes from a combination of factors:
The market's ability to absorb shocks.
Evolving investor psychology – becoming more accustomed to short-term volatility.
Changing market dynamics – reduced vulnerability to events like oil price swings.
World Wars: A Case Study in Stock Market Recovery
History provides concrete examples. Both World Wars saw initial market drops, but the Dow Jones Industrial Average (DJIA) displayed impressive resilience. After World War I, the DJIA rose a staggering 88% in 1915! World War II followed a similar pattern, with the DJIA recovering from initial losses and even experiencing a 50% surge over the course of the war.
Cryptocurrency: The Uncharted Territory
Unlike traditional assets, cryptocurrency is a relatively new asset class with no experience weathering a major war. Here's what we can consider:
Increased Volatility: War can lead to increased market volatility across all asset classes, and cryptocurrencies are known for their inherent volatility. This could lead to significant price swings in both directions.
Potential as a Hedge: Some believe cryptocurrencies, particularly those with limited supply like Bitcoin, could act as a hedge against inflation, which can rise during wartime. However, this theory remains untested in a large-scale war scenario.
Geopolitical Dependence: While cryptocurrencies operate on a decentralized network, their price can still be influenced by government regulations and global economic factors impacted by war.
The Bottom Line: Be Informed, Diversify, and Stay Calm
While war can cause temporary market volatility, history suggests a strong potential for recovery for traditional assets. For cryptocurrencies, the impact remains uncertain. Here are some key takeaways:
Stay informed: Keep an eye on the situation, but don't let fear cloud your judgment.
Diversify your portfolio: Don't put all your eggs in one basket. Spread your investments across different asset classes, including traditional assets like stocks and bonds, and potentially some crypto if your risk tolerance allows.
Consider your risk tolerance: How much volatility can you stomach? Adjust your investment strategy accordingly.
Don't panic sell: Remember, the market (both traditional and potentially crypto) has a history of bouncing back.
By staying informed, diversifying your portfolio, and maintaining a long-term perspective, you can navigate the uncertainty of war and position your investments for success, even in turbulent times. Remember, cryptocurrency is a high-risk, high-reward investment, and especially during a war, proceed with extra caution.


BITCOIN IS READY NOW ! I published a recommendation that the BTC fell, and today I post to you another one to confirm
CME:BTC1!

Possible Ending Diagonal BTC USDTEnding diagonal BTC v USDT lead into a Bull Trap. Probable build up to a bull trap and Elliott wave down trend, See previous post. Gartley = Positive but can only know when we have more data. Trade safely.

Potential Parabolic Expanding Megaphone with Trajectory.The analysis of the BTC/USD 3-hour chart highlights a possible parabolic expanding megaphone pattern. However, it's essential to approach this interpretation with caution due to the inherent limitations of such chart formations.
Understanding the Expanding Megaphone:
The expanding megaphone pattern is a technical indicator suggesting increasing volatility. It's characterized by higher highs and lower lows, with the trendlines diverging as the price fluctuates within the channel. While sometimes interpreted as a bullish continuation pattern, expanding megaphones can also precede price reversals due to the increasing volatility and potential exhaustion of the underlying trend.
Trajectory Target and Uncertainty:
The analysis suggests a potential trajectory target of $88,000-$97,000 based on the expanding megaphone pattern. It's important to remember that these targets are based on the upper trendline extension and shouldn't be considered guaranteed forecasts. Expanding megaphones are known for their inherent uncertainty due to the significant volatility they represent.
Cautious Interpretation and Additional Considerations:
Here's why caution is warranted when interpreting an expanding megaphone:
False Breakout Potential: Breakouts above the upper trendline don't necessarily translate to sustained price increases. The price may revisit the channel or even fall below the lower trendline.
Reversal Risk: The expanding pattern can indicate a buildup of buying pressure followed by exhaustion, potentially leading to a price reversal downwards.
For a more comprehensive analysis, consider these additional factors:
Volume Analysis: Monitor trading volume. Higher volume on breakouts strengthens their validity, while lower volume suggests weaker breakouts susceptible to reversal.
Technical Indicators: Utilize technical indicators like RSI (Relative Strength Index) or MACD (Moving Average Convergence Divergence) to assess momentum and identify overbought/oversold conditions. This can help pinpoint potential entry or exit points within the channel or during a breakout.
Fundamental News and Events: Stay informed about relevant news or events impacting Bitcoin's price. Regulatory changes, industry developments, or broader economic factors can influence price movements.
Conclusion:
The BTC/USD 3-hour chart exhibits a possible expanding megaphone pattern, suggesting heightened volatility. While a potential price target is mentioned, the inherent uncertainty of this pattern necessitates a cautious approach. By incorporating volume analysis, technical indicators, and fundamental analysis, you can gain a more complete understanding of the current market dynamics and make informed trading decisions. Remember, technical analysis is a tool to support your trading decisions, and past performance does not guarantee future results.
