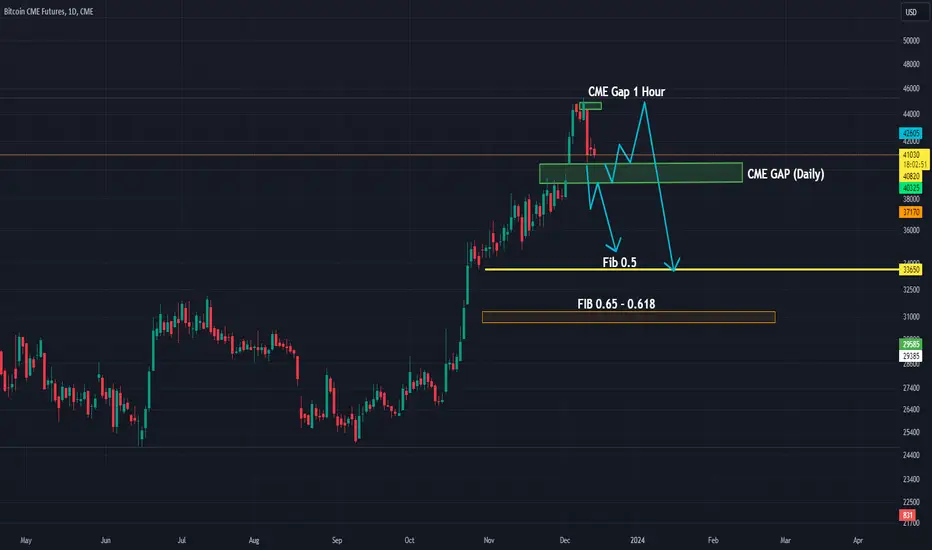
Bitcoin Has To Fill Some December GAPsA CME gap for bitcoin refers to a price discrepancy that occurs on the Chicago Mercantile Exchange bitcoin futures chart between the closing price of one trading day and the opening price of the next trading day.
Gaps occur because the bitcoin spot market trades 24/7 on various centralized exchanges, from which CME derives its Mark Price, while the futures market only trades Sunday through Friday, from 6:00 pm to 5:00 pm ET.
Some believe that gaps on the CME chart can act as significant support or resistance levels, as prices typically tend to fill the gap at a future date. Others argue that CME gaps are simply a technical phenomenon with no real predictive value.
Bitcon CME Futures chart made some GAPs in December, which can get filled in upcoming days/weeks and it can be very interesting to follow. We think that wave C can now fill the GAP from December 3rd and then when correction is completed and bulls back in play, then it can fill the GAPs from December 17 and December 10.
BTC1! trade ideas

$BTC weakening a bitCRYPTOCAP:BTC hasn't traded under the RED Moving avg much since breaking above it in Oct of 2023.
We did warn on weakening RSI a few times.
Weekly, #BTC looks very similar to #ethereum.
However, unlike #ETH, it's finally getting out of OVERBOUGHT territory.
Might get lil ugly before it gets better.
#bitcoin does have a history of falling big once leaving overbought territory.

BITCOIN"Bitcoin's journey to $45,330 could be a result of 'covering the CME gap'. The CME gap occurs due to the difference in Bitcoin's price when the CME closes on Friday and reopens on Sunday. Traders often observe these gaps getting filled, hence the potential rise to $45,330. Post covering the gap, a pump to $39,000 could be a bullish move indicating positive market sentiment. But remember, market factors are unpredictable. Always do your research! #Bitcoin #CMEGap #CryptoTrading"

BTC one last PUSH before the BEARS take back control?It seems that we could potentially see another wave to the upside before seeing some aggressive sellers stepping in.
This aggressive action should be very aggressive and also creates a break of the market structure.
Inverse V shape to be expected to see the SELLERS taking back control of the trend.
You also have a gap right below that break of market structure.
By the way, this is the CME chart and it gives much more clues in my opinion than the continuous usual BTC chart.
I also join my last Tweet analysis on the left of the illustration. Clock is ticking and we are right into my GREY BOX.
Tic Tac Tic Tac!
Probably also one my last analysis as the BTC Trading Lab.
Merry Xmas and Happy New Year to everyone.

BTC - Long Good luck to everyone! This analysis is for educational purposes only and does not constitute financial advice. Conduct your own analysis before making trading decisions.

BTC Dump Remaining....I believe, like many others, that we're still due a deeper drop. Here are my scenarios and likelihood, based on price levels.
We're going to fill the Gap: 90%
We'll drop to $35k: 65%
Drop to $32k: 50%

BTC1!As I ponder which gap will fill next, I'm noticing many seem to be thinking a 3xxxx bid is promised...
3xxxx bids are promised to no one.
Reclaim 42000 and I think odds shift dramatically in favor of 44910 next
It looks like an Adam and Eve bottom/ reversal forming just beneath mid, which should be enough to muster price back above 42000.
BTC1!

Here's My CME PA holes & 2018 Comparison Rally Just mapping and thinking
if the froth leaves & ETF stales
We attack parameter outlines lower
First would be CME gap under 40k
48k is still on the table but seems less likely
if the 44k gap down holds seems like USDT claims are rising
that MC add with ETF hype and CME premium came back the same one that was appearing
at 30k -32k first ETF hype cycle
35k retest
30-32k breakout support
hard too believe we see 24k break & 20420 USDC gap get filled
unless chaos happens
We never saw below old ATH till this cycle
Plan is too use this outline & trade price
if RSI weekly breaks down well see a sell off
if price keeps grinding higher with ETF we trade levels till price discovery
Halving in April
ETF TBD think March over JAN hard too know its a entity that can be manipulated & is controlled by a small group of loyal Central banking pawns

BTCUSD correctionSince in my previous post, Daily Renko already confirmed sell signal, I am more biased bearish price action for the short-term. The daily candle closing below 39k to 38k will trigger further downside.
Nothing to be greedy about, this type of correction is nothing in crypto.
#bitcoin may be visit hereThere' s a CME gap i showed in the chart. I expect to see #btc may move up to close this gap.
NOT FINANCIAL ADVICE.

BTC1!I believe this is shaping up as a deviation beneath MID (of the whole move).
It seems plausible that if we can reclaim MID then we likely revisit the inefficiency left behind by Monday's capitulatory price action in a flash, as well as inevitably hover above MID long enough for a formal gap fill of last Friday's 44910 close.

CME gaps a game of 2 post 3 See my last posts too get summery of PA on futures data and levels
This is just two lines witch one gets attacked first?

BTC and the market - If you missed it do not worry.
If you have missed the market uptrend so far, then do not worry.
I believe BTC fills all these CME gaps to give the last chance to enter and then BOOOM.

🅱️ Bitcoin CME Update | Correction Canceled?Since the last update we have a new gap and the last jump is the final "bull-trap".
Bitcoin produced a new high in the early days of December but there are some bearish signals mixed in-between the candles.
For example, the new high is immediately followed by the strongest bearish candle since March.
Sell volume is really high and the close happened below EMA10.
The RSI did not match the new high and ended up printing a bearish divergence; These signals together can start to build a strong case for more red.
It is still early of course, but we see green/buy volume dropping on a daily basis which is indicative that the bullish momentum is losing its force.
It might still be early because Bitcoin continues trading above 40K, but the crash can happen so fast that one is easily caught by surprise. By the time we realize it is already too late.
Regardless of how things go now, we know growth is scheduled for the long-term.
With a positive attitude we continue to wake up but keep in mind that a pre-halving correction is not the exception but the norm.
It is great to be part of this live... There is always something going on.
Namaste.

CME BTC heading down to Fill GapThe CME Futures chart has a gap fill that would line up with a test if bithebthe 21EMA and the 10 SMA, that's where it's headed and hopefully sooner than later, Last Bull run the was an unfilled gap for the entire bull run, but it did get filled when BTC came all they way back to 20K. Not a Gap Boy, but statistics show they do get filled.

price action at $BTC1 about to FILL the GAP!price action at $BTC1 about to FILL the GAP!
could we able to have a bounce at the spotted bullish divi?
Please everyone, help me boost reputation so I could join u in chat :) (:
#DYOR

IN A BITCOIN FRENZY; LONG BTC MINERS & SHORT BTCBitcoin ("BTC") prices are on a tear. It has rallied +57% since the start of September and is on course to clock fourth sequential month of rising prices. Four forces are driving a blistering rally. Euphoria linked to BTC spot ETF. Bullishness in all “Risk On” assets. Regulatory clarity. BTC halving.
In a BTC rally, portfolio managers can gain exposure to the sector in multiple ways. These include a long position in (a) BTC, (b) BTC Futures, (c) Listed BTC miners’ stocks, (d) Crypto Exchanges, or (e) ETF on Listed BTC Miners (“Miners ETF”).
Each of these presents its own benefits and challenges. This paper summarises the forces driving the bull run and analyses the price behaviour of Miners ETF (represented by Valkyrie Bitcoin Miners ETF “WGMI”) vis-a-vis BTC.
Since June when market caught on to the excitement of a BTC Spot ETF, BTC prices have rallied relative to WGMI.
In the near term, will the ETF catch up with the bull rally in BTC? Has the BTC price rally run ahead of itself?
UNPACKING WGMI ETF
WGMI is an actively managed ETF that invests in listed BTC miners. It is issued by Valkyrie Funds LLC.
The ETF objective is to invest >80% of its net assets in firms that derive >50% of their revenue or profits from BTC mining operations and/or from providing specialized chips, hardware and software or other services supporting BTC mining.
The Fund will not directly invest in BTC. Neither will it indirectly participate in BTC using derivatives or through investments in funds or trusts that hold BTC.
Source: ETFDB and data last updated 7th/December 2023
WGMI was launched in Feb 2022, it has net assets of USD 33 million and an expense ratio of 75 basis points.
In June, when regulatory approval discussions became louder, WGMI rallied relative to BTC. Net fund flows have been positive for much of the year with rising inflows since start of October.
However, since mid-July, while BTC remained resilient, WGMI came off precipitously. WGMI price meltdown stopped in early Oct and has since started rising. Meanwhile, BTC prices have rallied sharply resulting in a WGMI underperforming BTC by 30%.
BTC BULLS IN FULL FORCE
Four forces are driving BTC frenzy.
1. BTC Spot ETF Euphoria
ETF applications were delayed by the SEC and remain pending. Previously anticipated timeline of between 5th and 10th January 2024 remains the expected approval date.
Source: James Seyffart
2. Risk-on Asset Bull Run
When money flows, it flows everywhere. Equity markets have been on an upward trajectory over the past three months on Fed rate cut hopes. BTC is seen as the risk asset of choice rallying the most.
3. Regulatory Clarity
Recently, Sam Bankman-Fried (SBF), former CEO of FTX, and Binance, the world’s largest crypto exchange were both prosecuted. SBF was convicted of fraud and jailed.
Meanwhile, Binance was imposed USD 4.3 billion in penalties on criminal charges related to money laundering and breach of financial sanctions.
In reaction to these developments, JP Morgan's Nikolais Panigirtzoglou said that "We see the prospect of settlement as positive as uncertainty around Binance itself would subside and its trading and BNB Smart Chain business would benefit.
"For crypto investors the prospect of settlement would see the elimination of a potential systemic risk emanating from a hypothetical Binance collapse.", he added.
4. BTC Halving
BTC derives value from its limited supply. Every four years, the number of BTCs minted as a mining reward, halves and will eventually halt, leading to a fixed supply.
BTC halving occurs every 210,000 blocks. As the average block time is ~10 minutes this gives a ballpark range of four years. Next BTC halving is expected on 19th April 2024, with tiny likelihood that it could take place in March or May.
HYPOTHETICAL TRADE SET UP
BTC appreciation due to halving is well known but its effects on miners is counter intuitive. With halving, the block reward for mining BTC i.e. miner revenues are essentially slashed in half.
Although BTC price appreciation helps offset to some degree, it may not be enough if elevated prices cannot be sustained. Macro conditions have shifted. Energy prices are lower positively impacting the miners. Miner margins are likely to be wider.
Large miners are expanding their hash rate at record clip. This is supported by expansion of hash rate as well as consolidation.
Given the frenzied euphoric run up in BTC prices, BTC price may have run ahead of itself. In order to protect long position in Bitcoin miners against downside moves in volatile cryptocurrency prices, investors can hedge a long position in WGMI with a short position in CME Micro BTC futures.
This Relative Value trade captures the alpha from rising stock prices of miners, while remaining agnostic to the price action on BTC itself.
This paper argues for a hypothetical long position in WGMI ETF hedged by a short position using CME Micro Bitcoin Futures expiring in January 2024 (MBTF2024).
A long-short spread requires the notional of each trade leg to be identical. Each lot of Micro Bitcoin Futures provides exposure to 0.10 bitcoin equating to a notional value of USD 4,544. Given WGMI prices as of market close on 8th December was at USD 14.75 per ETF, 308 ETF units are required.
The hypothetical relative value trade then comprises of 308 WGMI units of ETF hedged by one lot of short position in CME Micro Bitcoin Futures with the following hypothetical trade set up:
• Entry: 0.03246% (USD 14.75 divided by USD 45,440)
• Target: 0.045%
• Stop Loss: 0.027%
• Profit at Target: USD 1,755
• Loss at Stop: USD 676
• Reward/Risk: 2.6x
Please note that the above hypothetical P&L doesn’t include transaction and capital costs.
MARKET DATA
CME Real-time Market Data helps identify trading set-ups and express market views better. If you have futures in your trading portfolio, you can check out on CME Group data plans available that suit your trading needs www.tradingview.com
DISCLAIMER
This case study is for educational purposes only and does not constitute investment recommendations or advice. Nor are they used to promote any specific products, or services.
Trading or investment ideas cited here are for illustration only, as an integral part of a case study to demonstrate the fundamental concepts in risk management or trading under the market scenarios being discussed. Please read the FULL DISCLAIMER the link to which is provided in our profile description.

$BTC dip on light volume, leveraged trades wiped out $150MWe mainly focus on the right side of the long vs shorts but let's look @ left side today, yes?
Longs were wiped out. Crumbled as can be seen by 1st pic.
In reality, who would leverage a BTC long here?
Back to the right side of the chart.
There's a tiny amount of shorts adding up.
#BTC volume is NOT heavy for such a dip, hmmm, curious.
Seems as if half that sell was gobbled up already.
Intraday #bitcoin = OVERSOLD

BTC1!Dips are for buying.
10% dip so far from last week's high to the intraday low.
If you've been sidelined and looking for an entry, this dip to backtest the mid of the whole move may be a good place to look for for a long entry into the ETF decision early January.

Bitcoin futures gapThe gap price of Bitcoin futures is between 40325 and 39640, waiting for the gap to be filled. According to market rules, this gap will be 100% filled.

BTCUSD - What If SEC Extends The ETF Decision For Another YearEveryone seems to be sure that the spot ETF will come soon, I don't like following sheep herds, so this analysis is taking in consideration a possible extension in the SEC decision.

UNpopular opinion $BTC down $CME WOuld pay to be contrarian here. all momentum indicators are very much over extended but can run a bit more but i feel time is running out. everyone and their moms are now calling for 40k where were they at 26??? we got a perfect CME gap fill, almost seems to easy to long here which is why we short. and fade the general public. I find it also very improbable on a new rally into the halvening. Imo we go tag the bottom gap at 20,300 to ill the final gap on daily. and chad after the halvening. all shorts got liq/d on the last move. i can see this slow bleed out down to the right before resetting and everyone calling crypto a scam. Holler if ya hear me.
