Bitcoin Bull Run Precedes Ethereum RallyDays of triple digit volatility and rampant amateur speculation are gone. Unlike the overblown enthusiasm which defined the peak of 2021, investors now are more measured and discerning.
2023 has been defined by (a) discrete and information fuelled rallies followed by unprecedented low volatility, and (b) rise of traditional finance entrants in digital assets.
Bitcoin (BTC) has rallied sharply relative to Ethereum (“ETH”), pushing BTC-ETH ratio to its highest level since 2021. Several factors point to a potential reversal in the ratio. Investors can deploy CME Micro BTC and Micro ETH Futures to harness gains from eventual reversion.
BTC surged 20% during the past week driven by excitement over the anticipated approval of a BTC Spot ETF. Large liquidations triggered as BTC prices rose on its re-emergence as a haven asset as discussed in a previous paper .
BITCOIN IS A HAVEN (AGAIN)
In October, BTC’s correlation with gold rose while correlation with Nasdaq-100 has inverted suggesting that investors consider BTC as a haven rather than a risk-on asset.
The case for BTC as a haven derives from its limited supply. Every four years, the number of BTCs minted as a mining reward, halves and will eventually halt, leading to a fixed supply.
BTC has played its role as a haven previously. In March this year, during the US regional banking crisis, BTC surged 40%. BTC also rallied 20% at the start of Russia-Ukraine conflict but soon pared those gains. Given the repeated pullback in its prices, question around BTC’s ability to deliver as a safe haven remains.
Assigning BTC a haven status could be a tad bit too early. It is a new asset. It faces regulatory ambiguity. It remains under-invested relative to traditional safe havens like gold and treasuries.
Notwithstanding that BTC is new, it is the most popular and widely tested cryptocurrency. Flow of assets from riskier crypto to the safety of BTC during rising uncertainty partly contributes to haven flows into BTC.
SHORT SQUEEZE ACCENTUATED BITCOIN’S RALLY
Recent rally was punctuated by heavy deleveraging in BTC derivatives. During the long squeeze in August, 64,000 BTCs were liquidated. In the following period, only half of these long positions returned.
These positions were not spared either as large liquidations occurred on October 17th and 23rd leading to unwinding of more than 60,000 BTC.
Source: Glassnode
The size of liquidation was like those in Jan 2023 when prices definitively broke above the $20k range, suggesting that this washout may be adequate to cement a major psychological price level.
AWAITING A BTC SPOT ETF
The latest development in the BTC spot ETF saga comes as an appeals court upheld the ruling against SEC’s rejection of Grayscale’s spot ETF application based on concerns that market manipulation is not addressed sufficiently.
The court held that SEC’s decision was arbitrary, capricious, and unenforceable. This time around, the SEC stated it will not be appealing any further.
The SEC’s easing stance is also echoed in the modest feedback response to other spot ETF applications. Many now believe that all spot BTC ETFs will be approved together and probably before the deadline of January 10th.
Approval of spot BTC ETFs is expected to make the asset available to a wider audience in a familiar Tradfi product structure making BTC go “mainstream.”
Spot ETFs will spur greater demand for spot BTC from ETF manufacturers. When gold ETF was first listed, incremental fund flows translated into higher demand for physical gold.
ETF listing and BTC price run is not a given as regulatory concerns remain. Prices have struggled to sustain ETF excitement driven rallies not once but thrice in 2023 due to slow developments compounded by a harsh macro backdrop.
The risk that the current rally will pullback persists. Earlier this week, price action was significantly influenced by investors speculating on the approval of Blackrock spot ETF (IBTC). The rumours have been spurred by the listing, delisting, and relisting of the ticker on Depository Trust and Clearing Corporation (DTCC) website.
BITCOIN BULL RUN PRECEDE ALTCOIN RALLIES
In stark contrast to BTC’s rally, other major cryptocurrencies have lagged pushing BTC dominance to its highest since 2021.
ETH has rallied 15% over the past week. ETH underperformance relative to BTC has pushed the ratio between them to levels unseen since 2021.
Altcoin underperformance is unusual. During past BTC rallies, ETH price tops lagged BTC tops by a month. This is a consequence of capital rotation within crypto.
In past rallies, asset rotation can be seen in three distinct waves starting with (1) increase in BTC capital, (2) ETH rotation, followed by (3) increasing stablecoin flows.
MARKET METRICS AND ON-CHAIN SIGNALS
A raft of market metrics points to bullish sentiment in crypto markets due to resilient Long-Term Holders (LTH), limited profits at current levels, and strained supply which is expected to be exacerbated by demand from spot ETFs.
More importantly, market metrics indicate a higher bullish sentiment for ETH.
FUTURES AND OPTIONS POSITIONING
Leveraged funds have built up net short positioning over the last few weeks in BTC futures. Contrastingly asset managers have setup net long positioning. In options, BTC full size options have a bullish P/C ratio of 0.51 and Micro BTC options have a P/C ratio of 0.76.
In contrast, leveraged funds bullish on ETH have switched from net short to net long positioning last week. Full size ETH options have bullish P/C ratio of 0.38 and Micro ETH options have P/C ratio of 0.38.
Overall, leveraged funds and option markets are more bullish on ETH compared to BTC.
TRADE SETUP
BTC prices may pullback relative to ETH in the short term given price divergence. CME’s suite of crypto futures can be deployed to harness gains from this trend reversal.
The hypothetical spread posited in this paper consists of two legs: (1) long position in Micro ETH futures expiring on November 24th ( METX3 ) and, (2) short position in Micro BTC futures expiring on the same date ( MBTX3 ).
Each lot of Micro ETH futures provide exposure to 0.1 ETH while each lot of Micro BTC futures provides exposure to 0.1 BTC. To balance notional values, nineteen lots of METX3 are required for each lot of MBTX3 at current prices
● Entry: 19.090
● Target: 17.58
● Stop Loss: 20.000
● Profit at Target: USD 276
● Loss at Stop: USD 169
● Reward to Risk: 1.6x
MARKET DATA
CME Real-time Market Data helps identify trading set-ups and express market views better. If you have futures in your trading portfolio, you can check out on CME Group data plans available that suit your trading needs www.tradingview.com
DISCLAIMER
This case study is for educational purposes only and does not constitute investment recommendations or advice. Nor are they used to promote any specific products, or services.
Trading or investment ideas cited here are for illustration only, as an integral part of a case study to demonstrate the fundamental concepts in risk management or trading under the market scenarios being discussed. Please read the FULL DISCLAIMER the link to which is provided in our profile description.
BTC1! trade ideas

🅱️ BTC CME Futures GAPs Points To $35K, Who's Selling? | Go UP!Looking at the Bitcoin CME Futures contracts we have to major gaps on the way down that are yet be filled.
These gaps can be found in the following ranges:
1) $34,445 - $35,775
2) $27,365 - $28,860
Now, let me ask you one question...
Who's selling?
Who is going to sell?
Who is selling now?
I ask this question because there is people around waiting for a "new low", "another leg down"... But who is going to sell?
Who will part with their bitcoins after Bitcoin hit a low back in June 2022?
The capitulation phase is where the masses sell.
The "sucker rally" is not.
The sucker rally, terrible name, happened in July/August 2022, then again months of red.
If you count from June '22 until January '23 you have more than six months.
That's the bottom pricing... The sellers had their time to sell from November 2021 until early this month...
New money is coming in not to sell but to hold long-term and profit as bitcoins price appreciates over the years.
Our billionaire friends gave the Go. ✔
The charts gave us the Go. ✔
Our third eye/intuition gave us the Go. ✔
Conventional markets gave us the Go. ✔
The FED gave us the Go. ✔
Even China, opening its country, gave us the Go. ✔
Astrology gave us the Go. ✔
Nothing is saying down now...
Everything is saying Go... UP!
Namaste.


BTC attempts to close the gap on weekly chartOnce the gap is closed I expect the price to consolidate for a while and then move down towards the unclosed gap on ~$21000

which strategy makes 100.000 $ per year?the supertrend strategy on Bitcoin or TSLA
simply apply this indicator to your 30 min chart
now is a time for long bitcoin but in the bear market the strategy also performed very well on short trades...

$BTC made big move, now what? $ETH should have more steam.In reference to CRYPTOCAP:BTC
Majority vs Row Partners, were:
Bullish mid April
We were sellers
Bearish mid June
We went TRADE long
Bullish July
We were cautious and turned bearish August
Extreme bear early September
We were cautiously bullish, turned bullish in October, ADDED LONGS
Hodl #BTC for the moment as it still looks good, but we may shave some off soon. CRYPTOCAP:ETH also looks decent, not trimming that.

CME gap filledThe first CME gap that wasn't filled yet, now has been filled.
We probably see a pause now in Bitcoins recent climb, before we rise further to around 40K (.618 retrace)
After that I expect a rather big drop... but not below 20K anymore.

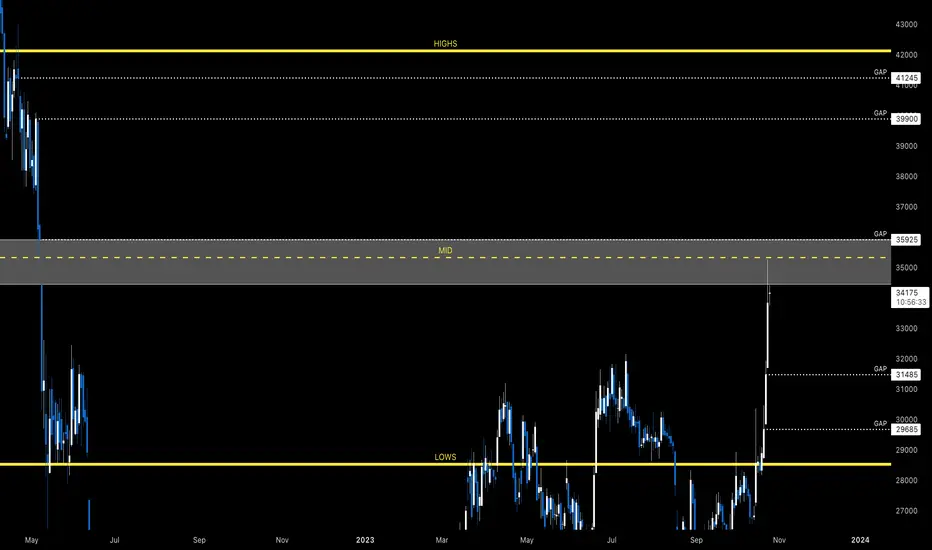
BTC1!Upthrust towards 35,925 gap, as foretold in earlier post this week, came sooner than anticipated.
This convincing move above previous 2023 highs has placed us in a new range, which is 28,535 to 42,140 (first quarter to mid of the entire move from peak to trough).
Mid for new range is 35,337.50.
CME gap immediately above remains unfilled until 35,925 prints.
Also, two additional gaps in new range that remain unfilled until 39,900 and 41,245 print respectively, which provide additional incentive for test of range highs in due time.
To be fair, there are also gaps to the downside that are also in range, which are at 31,485 and 29,685, which very well could incentivise test of range lows at 28,535.
Time will tell.
TL:DR anticipate giga bid around 28,535 to 29,685 (range lows), if it comes, for the inevitable move up to 42 (range highs).
Also, it's important to note, if we're done ranging, having had 18 months of rangebound accumulation from April 2022 through October 2023, and this is truly the start of an uptrend, a retest of 28 is unlikely. Simply because we'll be in an up-trending and not ranging environment.
This is what makes buying here and now, from this juncture, justified; in the event of a continuation of rangebound (28-42) then we're likely en route to 42, with the possibility of a retest of 28 before 42, and in the event that this is start of an uptrend we're in direct route to 42.
-jhonny
BITCOIN, Navigating Few setupsBTCUSD
Hello traders, welcome back to another market breakdown.
In this video I give my opinion about Bitcoin's chart.
Trade safely,
Trader Leo.


BTC goes to 17k!It seems that sardines never learn, unfortunately many will be stuck at the top again... BTC is clearly in a falling wedge and should return to the support line that has been coming since 2018, this will be the best time for you to fill your pockets and then Yes, think about the moon!
This is not investment advice!

$BTC keeps going & volume picking upAnother target hit as the CRYPTOCAP:BTC GAP was filled.
Not sure if we keep pumping now, but holding for now.
Still think that a low to mid 40k #BTC is a likely possibility. Maybe even this year IF the volume keeps picking up. IMO very likely.
Monthly #Bitcoin looks VERY GOOD. We see the RSI as healthy and is that a Bullish Crossover about to happen?

BTC CME Weekly Gaps All FilledGood Day,
Last nights Price Action saw the closure of the last weekly CME Gap left during the bear trend.
This opens the door to new price discovery.
Current price action is between fib retracement levels and it would seem probably that we see a move at least to the 0.618 over time.
I have also recognised BTC's previous 2 cycles finding high points at the 0.786 retracement point prior to the BTC Halving so that brings the 50k target into the realm of possibilities. My previous post outlies the major weekly signal that is now firing and confirmed with momentum and price action breaking above the major resistance area.
A retest of the major resistance turned to support would open the door to higher price targets into the end of Q4 and i am looking at January as a possible month for things to top out before a major retracement of BTC of (30%+)
Have a great day!!!

#bitcoin #btc has closed a historical #CME #GAPAs you see on the chart, there was very important #CMEFUTURES gap at 35 - 36K area which was opened in #luna collapse times. Now, #btcusdt price has CLOSED this historical gap and what now?
It' s too early to say #btcprice will go on through the #bullrun or " BTC will directly go to close the OTHER historical GAP at 20 - 21K region!.."
Now, just relax and watch the #market and especially #BTCdominance. #BTCD will reveal the direction of the market. I will update my thoughts.
As you see on the chart, there only 1 #CME #FUTURES #GAP left at 20 - 21K region. Don' t underestimate this and also don' t be pessimistic, just carefully watch #bitcoin moves.
NOT FINANCIAL ADVICE. Dyor.

BTCUSD - CME Gap Filled Down OnlyKuwa mwangalifu! Cuidado! Be careful! Pas op!
CME Gap has been filled!

BTC CMENow BTC CME Gap is filled.
This trading plan incorporates mechanical strategies along with smart money concepts.
Please be aware that investing in FX, Crypto, or any financial instrument carries inherent risks. It's advisable to consult a financial advisor or conduct thorough research before making any investment decisions.

CME gap filled on fake news. Headlines read Blackrock spot Bitcoin ETF lists… This application will not have an answer till after the new year…. DYOR for facts and don’t trade on headlines. Meanwhile the short liquidations are brutal beyond belief. I don’t believe the head and shoulders pattern is negated unless we close the week above the close at head. (32kish). My bet is that we will not close the week above. I entered a trade at CME gap and plan to ride the wave down. If I’m wrong then my stop is set just beyond. Good luck

Will Bitcoin do a repeat of 2019-2020?Banking Crisis and Technical Rallies
If there is one thing that is fundamentally bullish for crypto its bank failures. Crypto was built for this: banks becoming insolvent and the inability to trust the Fed or a third party to secure your wealth and value.
And we have gotten nothing short of a major rally over the past few weeks on the back of what has happened. With the Fed, Swiss, and ECB being forced to provide liquidity for failing banks, this rally in crypto could continue. Especially as a bunch of billionaires from Silicon Valley Bank need to store some of their wealth outside the banking system. Crypto is perfect for this.
From a technical perspective, we have had some key developments that line up and we can dive into some analysis to see where things may be headed.
I want to look at 2019 to early 2020 as I think this comparison is shaping up very closely.
Notice the orange triangle pattern - The last time we had this type of capitulation when Bitcoin fell to ~$3,000, it marked the bottom. At this juncture, a lot of people thought the end was nigh. We had a similar capitulation event occur which lead to the same triangle formation on the back of the failure of FTX. The capitulation event in 2019 marked the bottom. So far the failure of FTX, Celsius, 3AC, and others has marked the bottom of this cycle. The fractal is strikingly similar
2019 was followed by a massive multi-month rally which took Bitcoin back to its 50% retracement from its previous high. If we were to do something similar it would put us in the $40,000- $45,000 range or just shy of that in the 37-40k range.
Some technicals:
1. Weekly MACD is positive and sloping up.
2. Moving averages on the daily time frame are sloping positively.
3. The weekly 9 MA is crossing above the 200 MA.
4. RSI is showing strength.
Between technicals and Bank failures, we could see Bitcoin and the rest of crypto continue to run higher from here.

$BTC forms Head & Shoulder BUT has chance to rally hugeCRYPTOCAP:BTC must begin to break above this area in order to annul the ominous head & shoulder pattern that it is forming.
RSI looks pretty healthy at the moment.
Volume has been heavier than recent with slight buy bias.
CMF = $ Flow looks mediocre. However, there's a small increase.
Weekly, #BTC has not closed above 31100 for all of 2023. A close above could cause shorts to cover and fuel to rally more.
#Bitcoin

Bear or Bull next?... a detailed analysis Bullish:
1. W1 C&H, tgt 41,260
2. D1 gap ~35,500
3. Possible continued bullish action if DXY drops. (Looking soft the past few days, but has possible TA tgts up to $130-ish.)
Neutral:
1. USDT is in a symmetric triangle on HTF.
Bearish:
1. unable to break above Jul 19, 2021 low wick range 31,760 - 29,215 (yet)
2. poss H&S forming, tgt 21,455
3. D1 gaps below current price: (apx) 29,800, 27,150, 26,300, 20,700, 20,000
4. Below solid yellow TL and dotted yellow TL
5. PA currently in peak of shoulder wick zone (red)
6. candles & volume only appear to show mild strength thus far
Conclusion:
The next few days are "make or break". For bullish continuation PA needs to break above and hold 31,800 on a daily close. This will invalidate the HNS and simultaneously be a clearing of the Jul 19, 2021 wick zone.

BTC1!Previous two upthrusts this year, in April and July, have fallen short, but I believe this 3rd ETF hyped one is setting up to fill CME’s 35925 gap before end of year.

Bitcoin CME GapsThese CME gaps have a tendency to get "filled” – meaning that the market corrects back into the gap. While sources struggle to agree on the exact percentage, most of them agree that at least 65% of CME gaps are filled eventually.
..................................................................................................................
We are not registered or licensed in any jurisdiction whatsoever to provide investing advice or anything of an advisory or consultancy nature.
and are therefore are unqualified to give investment recommendations.
Always do your own research and consult with a licensed investment professional before investing.
This communication is never to be used as the basis of making investment decisions, and it is for entertainment purposes only.

BTC if grow up it wont across the level 48000 (shorting level)Hello kind traders
As I draw on my chart the best corredor of shorting is around the bleu lines ans specially 48000. then it can reach the TPs I mentionned on chart
Remeber that I do not have a cristal ball predicting markets move, but I try to be efficient and rational
Good luck
