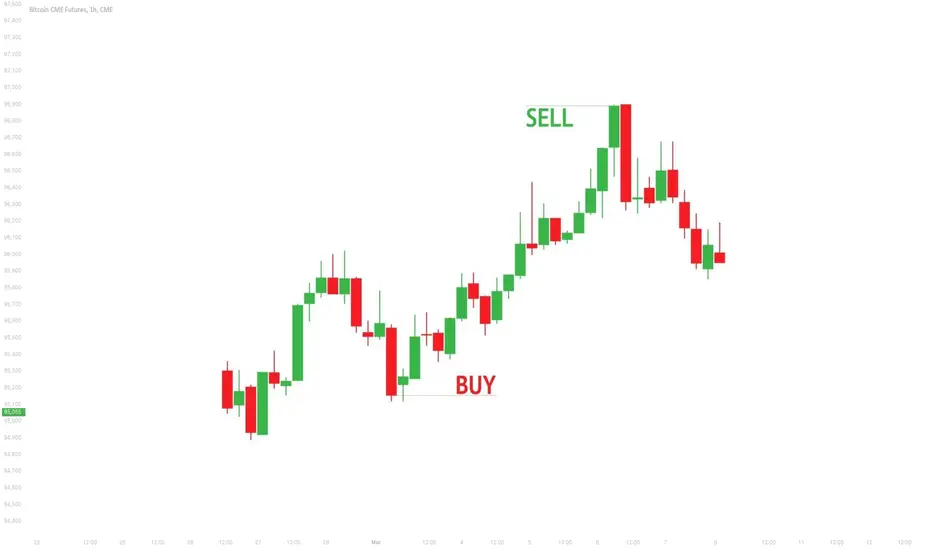
BTC start buying in the green zone been waiting Start Buying when price isn the green zone simple plan
BTC1! trade ideas

BTC CME MMBM is over If we use data like Market Maker for the purchase, then perhaps we have completed it, now MMSM has worked
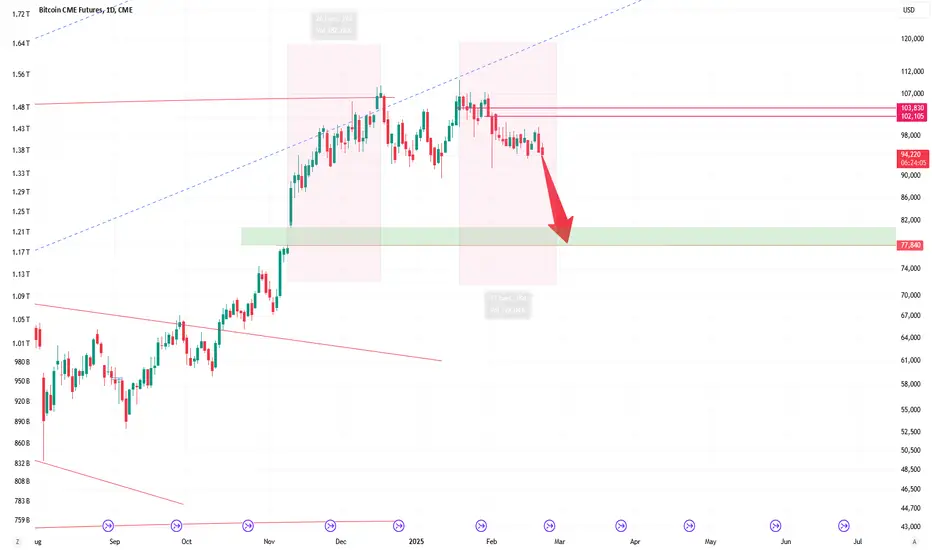
We see that December was aсamulation, January - manipulation and February - distribution with the completion and withdrawal of monthly liquidity for January, now we are in the zone of immediate inefficiency, 82-88k + emptiness at 77-80k
I will consider NWOG for 23 feb as resistance and a search for a short entry if the price goes there due to weekly inefficiency

Bitcoin is in precarious position below 92KCME:MBT1! is trying to hold on around 92K levels. If this is breached on the downside, it runs into the risk of falling much lower towards 74K levels.
Keep an eye HODLers!

BTC - Intraday Short.Just opened a short position on BTC, that was entered as the futures markets opened with a sudden influx of liquidity, moving into a 4H Bearish FVG, that should hold and price then turn to continue weekends bearish bias, and by extension, the overall bearish bias in play currently.
Target is the hourly TF's SwL, which would be a good reversal area for price to print a positive week in crypto, however, if price doesn't show any signs of a reversal and a change in bias, we should anticipate the unmitigated Weekly BaG as our HTF target/draw on liquidity.
Trade what we see, not what we think.

Predicting the behavior of cryptocurrency whales and price crashBitcoin price could fall to $77,000 in about a week.
Are you ready for this massive exit by crypto whales? They are trying to fill the gap, usually whales are unpredictable, but it seems like they are trying to show us how dangerous the situation is. I hope you profit from your short positions.
Understanding Volume In TradingVolume is one of the most crucial yet often overlooked aspects of trading. It represents the total number of shares, contracts, or lots traded in a given period and provides insight into the strength of price movements. By analyzing volume effectively, traders can identify trends, confirm breakouts, and detect potential reversals before they happen.
Unlike price action alone, volume adds a critical layer of confirmation. A price move supported by high volume is more likely to be sustainable, while a move on low volume may indicate weakness or manipulation. Institutions, hedge funds, and large market players leave footprints through volume, and understanding these patterns can give traders an edge.
Volume Types 🎯
Volume
Buy/Sell Volume
Delta Volume
Cumulative Delta Volume
Relative Volume
Cumulative Relative Volume
Open Interest
Volume Profile
01. Volume 🔥
In trading, volume refers to the total quantity of assets traded during a specific time frame, whether they are stocks, futures contracts, options, or currencies. It measures the activity level of a security and provides insights into the strength or weakness of price movements.
Key aspects:
Market sentiment: High volume often indicates strong interest in a security and can signal the strength of a price move. Conversely, low volume may suggest a lack of interest and can indicate that price movements may not be sustainable.
Liquidity: High volume generally indicates better liquidity, meaning it is easier to enter and exit positions without significantly impacting the asset’s price. Low volume may lead to higher slippage and greater price volatility.
Volume spikes: Extremely high volume after a prolonged trend may signal the end of that trend (blow-off tops or panic selling bottoms).
Market types: Volume can vary by market type. In stock markets, it is usually reported in shares. In futures and options, it is reported in contracts, while in Forex, it is often measured by tick volume (the number of price changes).
Impact on market orders & liquidity
High Volume = Lower Slippage: Large orders can be executed more efficiently in high-volume environments.
Low Volume = Higher Volatility: Thin order books in low-volume markets can lead to erratic price swings and wider bid-ask spreads.
02. Buy/Sell Volume 💹
Buy volume and sell volume are key metrics that indicate the level of buying and selling activity in a market. They help traders assess the strength of price movements and market sentiment.
Buy Volume
Buy volume represents the number of shares, contracts, or lots traded at the ask price (or higher). It occurs when buyers are willing to pay the seller’s asking price, indicating buying pressure and potential bullish sentiment.
How buy volume is measured:
Transactions that execute at the ask price are counted as buy volume.
In some cases, aggressive market orders (where buyers take liquidity) are considered buy volume.
Buy volume is often compared to total volume to determine demand strength.
Sell Volume
Sell volume represents the number of shares, contracts, or lots traded at the bid price (or lower). It occurs when sellers accept the buyer’s bid price, indicating selling pressure and potential bearish sentiment.
How sell volume is measured:
Transactions executed at the bid price are counted as sell volume.
Market sell orders (where sellers take liquidity) contribute to sell volume.
Higher sell volume relative to buy volume suggests downward price pressure.
03. Delta Volume ✨
Delta Volume (often referred to as Volume Delta) is a key order flow metric that measures the difference between buy volume and sell volume over a given period.
Calculation
Delta Volume is defined as: Delta Volume = Buy Volume − Sell Volume
Where:
Buy Volume is the total volume transacted at the ask price (aggressive buying).
Sell Volume is the total volume transacted at the bid price (aggressive selling).
Interpretation
Positive Delta (Buy Volume > Sell Volume): Indicates more aggressive buying, suggesting bullish momentum.
Negative Delta (Sell Volume > Buy Volume): Indicates more aggressive selling, suggesting bearish momentum.
Near Zero Delta: Indicates a balance between buyers and sellers, often seen in range-bound markets.
04. Cumulative Delta Volume ⚡
Cumulative Delta Volume (CVD) is an advanced order flow metric that tracks the cumulative sum of Delta Volume over time.
Calculation
CVD t =CVD t − 1 + (Buy Volume − Sell Volume)
Where:
Buy Volume = Volume transacted at the ask price (aggressive buying).
Sell Volume = Volume transacted at the bid price (aggressive selling).
CVD*t = Current cumulative delta value.
CVD\*{t-1} = Previous cumulative delta value.
Interpretation
Rising CVD (Positive Delta Accumulation): Buyers are dominating, indicating bullish momentum.
Falling CVD (Negative Delta Accumulation): Sellers are in control, signaling bearish momentum.
Flat or Divergent CVD: A divergence between price and CVD can indicate potential reversals or absorption by large traders.
05. Relative Volume 📉
Relative Volume (RVOL) is a key trading metric that measures current trading volume compared to its historical average over a specified period. It helps traders assess whether a security is experiencing unusual trading activity and provides insights into liquidity, volatility, and potential price movements.
Calculation
Relative Volume is typically expressed as a ratio:
RVOL = Current Volume / Average Volume Over A Given Period
Where:
Current Volume = The total shares/contracts traded in the current period (e.g., 1-minute, 5-minute, daily).
Average Volume = The average volume over a past period (e.g., 10-day average, 50-day average).
A higher RVOL (>1) means the security is trading at above-average volume, while a lower RVOL (<1) indicates below-average activity.
Interpretation
RVOL > 2: Indicates significantly higher-than-normal volume, often linked to news events, earnings reports, or breakout trends.
RVOL around 1: Suggests normal trading activity with no unusual volume spikes.
RVOL < 1: Indicates low trading activity, which may lead to weak price movements and lower liquidity.
06. Cumulative Relative Volume 💥
Cumulative Relative Volume (CRVOL) is an advanced volume metric that tracks the total volume traded throughout a session relative to its historical average at the same time of day.
Calculation
Cumulative Relative Volume compares the ongoing total volume at a given point in time to the average cumulative volume at that same time over a historical period.
CRVOL = Cumulative Volume at Time X / Average Cumulative Volume at Time X over N periods
Where:
Cumulative Volume at Time X = The total volume traded from market open up to time X.
Average Cumulative Volume at Time X = The average total volume at that point in time over a selected historical period (e.g., 10 days).
N periods = The number of historical sessions used for comparison.
A CRVOL > 1 indicates higher-than-normal trading activity, while CRVOL < 1 suggests lower-than-average activity.
Interpretation
CRVOL > 1.5: Significantly higher trading activity than usual, often linked to news events, earnings reports, or institutional participation.
CRVOL ≈ 1: Normal trading volume, suggesting typical market conditions.
CRVOL < 0.8: Below-average trading volume, often indicating low liquidity and reduced volatility.
07. Open Interest 📊
Open Interest (OI) is a key metric in derivatives markets (futures and options) that represents the total number of outstanding contracts that have not been settled or closed. It is an important indicator of market activity, liquidity, and trader commitment.
How it works?
Open Interest increases or decreases based on the interaction between buyers and sellers:
OI Increases: When a new buyer and a new seller enter the market, creating a fresh contract.
OI Decreases: When an existing buyer and seller close their positions (either by offsetting trades or expiration).
OI Unchanged: If an existing contract is transferred between traders (one trader closes, another opens an equal position).
Interpretation
Rising OI + Rising Price: Suggests strong buying interest, indicating a bullish trend with conviction.
Rising OI + Falling Price: Indicates strong selling pressure, confirming a bearish trend.
Falling OI + Rising Price: Signals a short-covering rally or weakening trend, as traders close positions.
Falling OI + Falling Price: Suggests a lack of commitment to further declines, indicating potential trend exhaustion.
08. Volume Profile 🎢
Volume Profile is a powerful market analysis tool that plots trading volume at different price levels over a specific period. Unlike traditional volume indicators, which show volume per time interval, Volume Profile reveals where the most buying and selling activity occurred, helping traders identify key support and resistance levels, market structure, and potential price reactions.
Components
Volume Profile is displayed as a histogram on the vertical axis, showing the amount of volume traded at each price level. It is built using tick data or intraday price action and is often calculated for different timeframes (daily, weekly, monthly, or custom sessions).
Key components of Volume Profile include:
Point of Control (POC): The price level where the highest volume was traded, acting as a major support/resistance zone.
High Volume Nodes (HVN): Price areas with heavy trading activity, indicating consolidation zones where price is likely to stabilize.
Low Volume Nodes (LVN): Price areas with little trading activity, often leading to fast price movements as there is little resistance or support.
Value Area (VA): The price range where 70% of the total volume was traded, representing the "fair value" zone of the market.
Value Area High (VAH) & Value Area Low (VAL): The upper and lower boundaries of the Value Area, acting as dynamic support and resistance levels.
Types
Session Volume Profile: Analyzes volume for a single trading session (daily or intraday).
Composite Volume Profile: Covers a longer period (weeks, months, or custom-defined ranges).
Fixed Range Volume Profile: Analyzes volume for a specific price range or custom-selected area.
Developing Volume Profile: Updates dynamically throughout the trading session to show real-time changes in volume distribution.
Interpretation
POC as a Magnet: Price tends to revisit the POC due to high liquidity and market agreement at that level.
Breakouts from Value Area: If price breaks above VAH with strong volume, it signals a bullish trend; if it breaks below VAL, it signals a bearish trend.
Reaction at LVN: Price moves quickly through LVN areas but may reverse or stall when approaching HVN.
Rejections at VAH/VAL: If price rejects VAH, it may return to POC or VAL, and vice versa.
09. Indicators 📦
Volume indicators help traders gauge market strength by analyzing the number of shares or contracts traded.
Volume (Default) – Displays the total volume traded per candle, often color-coded based on price movement.
Volume Profile (Fixed Range, Session, Visible Range) – Shows volume distribution across price levels to identify support and resistance zones.
Volume Weighted Average Price (VWAP) – A dynamic support/resistance line that calculates the average price based on volume.
On-Balance Volume (OBV) – Measures cumulative volume flow to detect price trends and confirm breakouts.
Money Flow Index (MFI) – A volume-weighted RSI-like oscillator that identifies overbought and oversold conditions.
Volume Delta – Measures the difference between buying (ask) and selling (bid) volume.
Cumulative Delta Volume – Tracks the cumulative sum of volume delta over time to assess buying/selling pressure.
Relative Volume (RVOL) – Compares current volume to historical averages to highlight unusual trading activity.
Key Takeaways 📋
Volume is a crucial market indicator that reflects trading activity and liquidity, often preceding price movements.
High volume confirms trends and breakouts, while low volume can signal weak or false moves.
Volume Profile identifies key support and resistance zones, with High Volume Nodes (HVNs) acting as strong barriers and Low Volume Nodes (LVNs) allowing fast price movement.
Relative Volume (RVOL) highlights unusual market activity, while Delta Volume and Cumulative Delta reveal buying and selling pressure.
VWAP serves as a dynamic support/resistance tool commonly used by institutional traders.
Is Bitcoin Now Set Up to Rally?Large Speculators are now net-short Bitcoin futures (red circle, bottom right) according to COT positioning data. As previously published, Bitcoin has never rallied when LG Specs were net-long, but that does not mean BTC is going to instantly start going up with the turn to net-short.
From an overall positioning standpoint, Bitcoin is neutral since non of the trader types are at a max position, so reward/risk from a CMR process type trade is not there, but it is interesting to see how Bitcoin now reacts to news (whether bullish or bearish) and see of market tone changes with positioning data changing. I think one week is not enough to confirm so this Friday will be telling to see if LG Specs continue to short BTC or flip back to net-long.

CME BTC Futures Weekly Plan analysis
In this tradingview blog, we will refer to our February 10, 2025, weekly trade plan for CME BTC futures . We highlighted three potential scenarios last week. Our main scenario 1 played out. It did not reach the high we expected in our plan, however, BTC futures consolidated further around the mCVPOC, i.e., our Anchored Volume Profile from November 10th, 2024.
We highlighted the following key levels:
Yearly Hi:110,920
mCVAH: 104,400
Dec 2024 mid-range: 101,570
Jan 2025 mid-range: 100,610
mCVPOC: 98,075
mCVAL: 93,730
Key Bull Support: 92,505 - 90,000
Scenario 1 stated Further chop and acceptance. We noted the following:
“In this scenario, we may see price action remain range bound. Traders look for clarity on how policy may affect market sentiment before further committing capital”.
Also, as acceptance (balance) builds, mCVPOC has also shifted. You can see that mcVPOC is currently sitting at 97,965 (when posting this recap). Market was choppy as expected, although it did not reach December 2024 or January 2025 mid-range. Markets chopped below mCVPOC, touching mCVAL.
This is a time where patience is required and it is better to sit on your hands rather than engaging with markets in choppy conditions.
Although we are wary of news and that it may impact prices. Our main portion of analysis and plan is founded upon Volume Profile, multiple time-frame analysis as mentioned in our recap from February 6, 2025.
This is just one of many ways to look at the markets. We provide these recaps on our thoughts on markets to help you understand and incorporate these into your own style of viewing and analyzing the markets.

Probabilistic thinking. Using Technical logic to get odds.Markets are simple if you think about it.
moderate and long range resistance -- is the best odds for rally.
"horizontal" or 50-50 supports -- risky.
steep supports mean high demand, strong trends. Buying at such supports, at worst it bounces to the upside. (High market with strong trend can mean reversals)
rule: break outs always must coincide with 200dma rallies.
Bonus.
High market, strong trend -- best odds for reversal .
50-50 resistance, with weak support --> trickster market. (trap)
strong trend but no flying 200dma --> trap.
50-50 resistance with strong trend, high market, but weak 200dma ---> good odds for reversal.
keeping it simple.
P.S. this method shows why odds favor BTC reversal . Or why 110/120k had to be peak point. for now.

MBT1 BULISH (THE LEAP BITCOIN)MBT1, the Bitcoin leaps asset, is showing a slight bullish movement. The targets, danger zone, and stop loss levels are marked on the chart. The zigzag movement indicates that if MBT1 breaks through this area, it could reach upper targets up to 100K.
Please pay close attention to the danger zone and stop loss.
Note: My ideas are not intended for any type of scalping or scalpers!
You can find the full list of my ideas here: www.tradingview.com
Here are some of my ideas:

TL;DR: Big money is betting hard on BTC going upAlright, so basically, this chart is showing BTC futures price action along with COT (Commitments of Traders) data, which tells us how big players like fund managers are positioned.
What’s Going On?
BTC Price Action (Candlesticks at the top)
BTC has been in a strong uptrend, making higher highs.
There are two key points where fund managers were loading up on longs (expecting price to go up).
Right after both points, BTC ripped higher.
COT Data (The lines below the chart)
This tracks how different types of traders are positioned in the futures market.
Fund managers (big institutional players) were super long at both points marked.
These guys don’t mess around with short-term trades. They position big when they expect a massive move up.
Why This Is Bullish AF
Institutions don’t throw money around for no reason. When they load up on longs, it means they’re confident BTC is gonna pump.
They have access to better research, inside info, and way more capital than retail traders.
Both times they went heavy long, BTC skyrocketed shortly after
TL;DR:
Big money is betting hard on BTC going up, just like they did before previous pumps. If history repeats, this could mean another huge leg up is coming.

#TheFuturesLeapBitcoin has been on the forefront of traders minds over the past few months with the strong move to the upside over the $100,000 mark analysts have been looking for for some time. Since the January Highs, prices have come down and been bouncing back and forth, and now traders are asking “what’s next?”
TradingView’s “The Leap” Trading Competition presents a unique opportunity for traders to put their futures trading skills to the test. This competition allows participants to trade select CME Group futures contracts giving traders access to some of the most actively traded commodities in the world.
Register and compete in "The Leap" here: TradingView Competition Registration .
As for prizes, there’s something for everyone
250 awards, including cash and plan extensions.
1st place — $3,000
2nd place — $1,500
3rd place — $1,200
4th place — $1,000
5th place — $800
Places from 6th to 25th — $500
Places from 26th to 50th — $300
Places from 51st to 250th — 6 more months of your current plan
Symbols for trading:
Ten futures are available, representing the most popular CME Group contracts: E-Mini Nasdaq-100, Micro E-Mini S&P, Micro Bitcoin, gold, and more.
CL1! MES1! NQ1! MBT1! MCL1! M6E1! MGC1! GC1! ES1! MNQ1!
If you have futures in your trading portfolio, you can check out on CME Group data plans available that suit your trading needs tradingview.com/cme/
*CME Group futures are not suitable for all investors and involve the risk of loss. Copyright © 2023 CME Group Inc.
**All examples in this report are hypothetical interpretations of situations and are used for explanation purposes only. The views in this report reflect solely those of the author and not necessarily those of CME Group or its affiliated institutions. This report and the information herein should not be considered investment advice or the results of actual market experience.

The key is whether it can be supported near 98105
Hello, traders.
If you "Follow", you can always get new information quickly.
Please also click "Boost".
Have a nice day today.
-------------------------------------
(MBT1! 1D chart)
There are many indicators formed over the 96600-102095 section.
Therefore, the key is whether it can break through this section upward.
In particular, we need to look at whether it can be supported and rise in the 98105-100700 section.
-
In order to turn into an uptrend, the price must rise above the Trend Cloud indicator and maintain it.
The Trend Cloud indicator is a combination of the existing 5EMA+StErr indicator and the MS-Signal indicator to increase intuitiveness.
Since it is currently below the Trend Cloud indicator, if it fails to rise above 98105, there is a possibility that the downtrend will continue, so caution is required.
If the downtrend continues, the key is whether there is support near 91435, which was the previous low point.
Therefore, in order to trade with a long position, it is recommended to check that the price is maintained above the Trend Cloud indicator and proceed.
-
(30m chart)
-
Thank you for reading to the end.
I hope you have a successful trade.
--------------------------------------------------

Bitcoin Continues to Trade in a RangeA few weeks back we published the Bitcoin chart and highlighted how in the history of Bitcoin Futures, whenever Large Speculators were net-long, Bitcoin did not rally. Well, here we are and still it trades in a range as Large Speculators are net-long. The amount in positioning has fluctuated but as of Last week, they remain bullish. Historically, Large Speculators are hedge funds who trade the markets with enough size that they have to report to the CFTC.
It will be interesting to see what Bitcoin does from here, especially if there is a significant move in net positioning either way. Whether Large Specs increase their position or become net-short, tracking this data weekly may provide more insight on the price of Bitcoin, especially in this new political environment, and administration that is bullish Crypto so far.

BTC CRab to fill the 77k CME GAPFlipping bearish, btc to fill the 77k cme gap March/April, then we will take it from there

MBTC1!/BTC1! Day Trade Plan for 02/10/25MBTC1!/BTC1! Day Trade Plan for 02/10/25
📈 99590
📉 93365
Like and share for more daily ES/NQ levels 🤓📈📉🎯💰
(💎: IF THERE IS NOT MUCH VOLATILITY; FOCUS ON ZONES VERSES INDIVIDUAL PRICE LEVELS)
*These levels are derived from comprehensive backtesting and research, demonstrating over 90% accuracy. This statistical foundation suggests that price movements are likely to exceed initial estimates.*

Market Update: Tariffs, Trade Shifts & Bitcoin's Next MoveCME:BTC1!
News and Economic Calendar Update
President Trump announced 25% tariffs on all steel and aluminum imports, effective Monday, with reciprocal tariffs to follow on Tuesday or Wednesday. As Trump has shared, “if they tax us, we tax them the same amount.” This move is expected to reshape global trade relations, with China reportedly considering probes into U.S. tech firms such as Broadcom (AVGO) and Synopsys (SNPS), according to WSJ. Japan's PM Ishiba remains optimistic about avoiding higher U.S. tariffs, while Australia and India are negotiating exemptions and trade concessions. Meanwhile, the EU has hinted at retaliatory measures should new tariffs be imposed.
The U.S. dollar strengthened following Friday’s jobs report and fresh tariff announcements, while the Japanese yen under-performed. The EUR/USD briefly dipped below 1.03 before rebounding, and the British pound remained stable ahead of comments from BoE’s Mann. U.S. Treasury yields were unchanged, while European bunds edged higher amid rising trade concerns.
Gold surged to an all-time high above $2,900/oz, reflecting increased demand for safe-haven assets due to tariff uncertainty. Meanwhile, crude oil reached session highs, and European natural gas prices climbed to a two-year peak due to colder temperatures and tight storage.
Looking Ahead
Key upcoming data releases include Fed Chair Powell’s testimony, U.S. CPI data, Chinese M2 Money Supply, and U.S. retail sales. Additionally, multiple central bank officials are scheduled to speak throughout the week, providing further insights into monetary policy direction.
Macro Update: Trade War 2.0 and Tariff Shifts Impact Markets.
The latest reciprocal tariff announcements from Trump, in our view, presents a strategic opportunity for the U.S. This approach enables negotiations for lower tariffs on U.S. exports with individual trading partners, fostering a more flexible and targeted trade policy. This shift aligns more with global trade integration and could provide a more balanced framework for U.S. exporters.
Gold continues to exhibit renewed strength as a safe-haven asset, marking fresh all-time highs amid market uncertainty. Meanwhile, Bitcoin—often referred to as "digital gold"—has lagged behind, struggling in a climate of risk-off sentiment. However, it remains within its post-election trading range, signaling resilience despite broader market volatility.
At the fiscal level, U.S. House Republican leaders are proposing federal spending cuts ranging between $2 trillion to $2.5 trillion, according to Punchbowl sources. These cuts are expected to focus heavily on Medicaid spending. However, the effectiveness of government spending adjustments remains in question—whether such measures will enhance efficiency or simply reduce overall spending is yet to be seen. In addition, extending President Trump’s tax proposals could cut revenue by $5-11T over a decade, potentially pushing U.S. debt to 132-149% of GDP by 2035. Senate Republicans propose $342B in border and defense spending, with offsetting cuts. Meanwhile, Musk’s DOGE Service aims to automate government functions, reduce the federal workforce, and slash spending.
Bitcoin Big Picture:
Bitcoin has been consolidating after making new all time highs post US elections. Although price action and consolidation points towards further bullishness. We remain cautious and prepared for any of the scenarios that may happen as a result of many different factors influencing risk assets and market sentiment.
To better manage your exposure to Bitcoin, consider using CME’s Micro Bitcoin and Bitcoin Friday Futures . Additionally, you can take part in the CME and TradingView paper trading competition, allowing you to showcase your Micro Bitcoin trading skills in The Leap —risk-free.
Key Levels to Watch
Key levels represent areas of interest and zones of active market participation. The more significant a key level, the closer we monitor it for potential reactions and trade setups in alignment with our trading plan.
Yearly Hi: 110,920
mCVAH: 104,400
Dec 2024 mid range: 101,570
Jan 2025 mid range: 100,610
mCVPOC: 98,075
mCVAL: 93,730
Key Bull Support: 92,505 - 90,000
Scenario 1: Further chop and acceptance
In this scenario, we may see price action remain range bound. Traders look for clarity on how policy may affect market sentiment before further committing capital.
Scenario 2: New ATHs
Price attempts to create new ATHs which marks a significant move. Although bitcoin created new all time highs in January 2025, these were rejected and price action pointed towards market top.
Scenario 3: Souring market sentiment
Scenario 2 and 3 requires remaining alert to all developments as fundamental and macro news is turning ever so significant in driving short-term volatility and price action.
Any further hint towards tighter monetary policy and tighter fiscal policy may send BTC prices lower very quickly.

BTC CME Short For three months the price accumulated positions, in January, after touching the short-term FVG, liquidity for December was removed, the high of the year was updated, and now the price is looking for inefficiencies and goes to fill the November week of FVG + liquidity January

BTC (Bullish Scenario)Bullish Crab Pattern BTC. Possible gap fill and even wick down the VG area around 71k before bouncing back temporarily to the upside. This is good for swing trade.

Bitcoin CME GapsThis chart shows the CME Gaps Bitcoin has left over the past few years and when they were filled as well as the one that remains unfilled.

bTC TO 68K FINAL RETRACEMENT BEFORE EARTHQUAKE BULL RUN.To reach ATH , the momentum needed has to come from beneath. At the moment the bull run is sytruggling. So, need to drop to 68k or to 55k then wick upto 68k. king"s ideas

Short BitcoinHere's a short trade idea for Bitcoin on the 4-hour chart. Based on location analysis, the price appears expensive on the daily chart. We need more price action to determine the optimal profit-taking point, but for now, the risk-to-reward ratio is 1:3.

