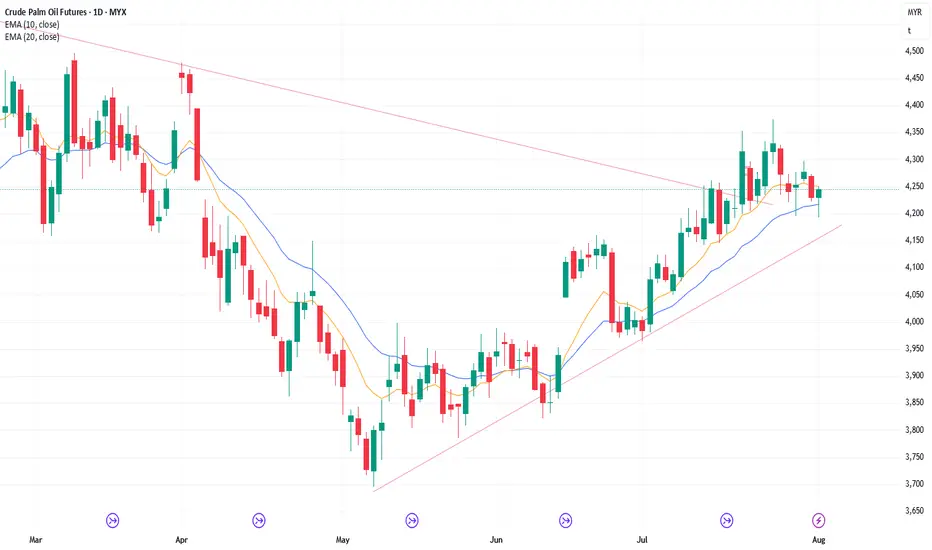
4/8/25 Can Bears Create FT Selling or Not?
Friday’s candlestick (Aug 1) was a bull bar closing bear its high with a long tail below.
In our last report, we said traders would see if the bears could create a strong follow-through bear bar closing near its low, or if the market would trade lower, but close with a long tail below or a bull
Related commodities
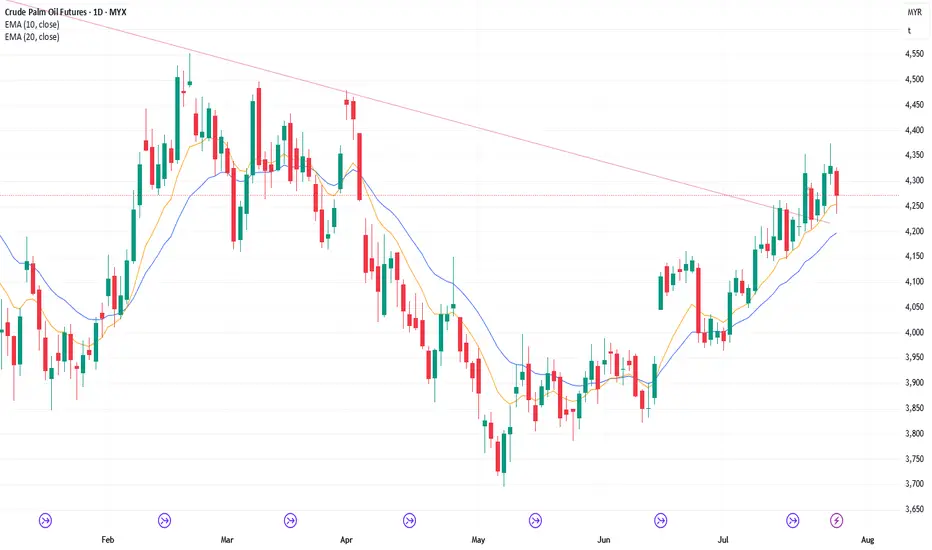
5/8/25 Can Bulls Get A Bull Bar Above 20-Day EMA?
Monday’s candlestick (Aug 4) was a bull doji closing around the middle of its range with prominent tails.
In our last report, we said the market may gap down at the open. Traders would see if the bears could create follow-through selling, closing the day near its low, or if the market would lac

28/7/25 Minor Pullback or Something Stronger?
Friday’s candlestick (Jul 25) was a bear bar closing slightly below the middle of its range with a long tail below.
In our last report, we stated that traders would assess whether the bulls could generate follow-through buying or if the bears would create a strong pullback, which would close th
25/7/25 Follow-through Buying or Pullback Instead?
Thursday’s candlestick (Jul 24) was a bull doji closing slightly below the middle of its range with a long tail above.
In our last report, we said the odds slightly favor sideways to up. Traders would see if the bulls could create follow-through buying, breaking above the July 18 high, or if th
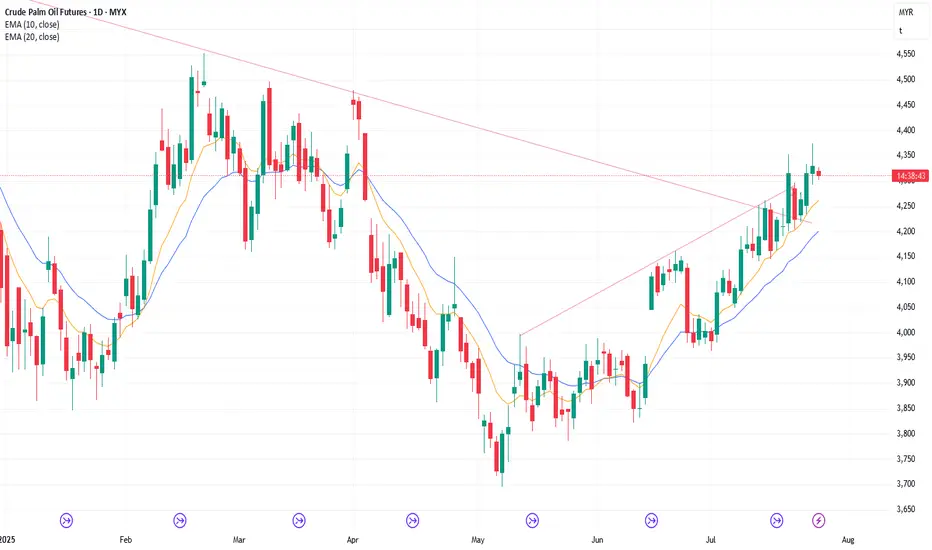
6/8/25 Follow-through Buying or Reverse Down?
Tuesday’s candlestick (Aug 5) was a big bull bar closing near its high and far above the 20-day EMA.
In our last report, we said traders would see if the bulls could create a strong bull bar closing above the 20-day EMA, or if the market would trade higher but close with a long tail above and b
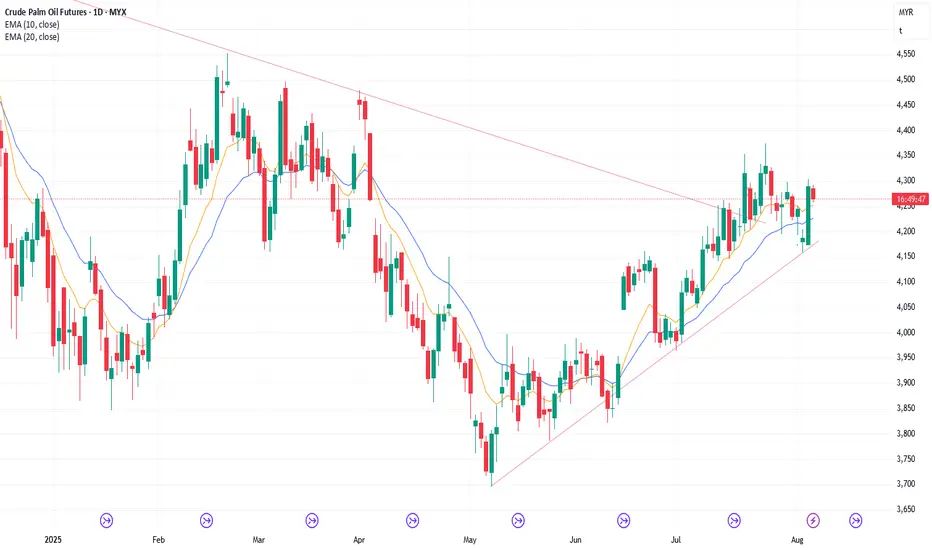
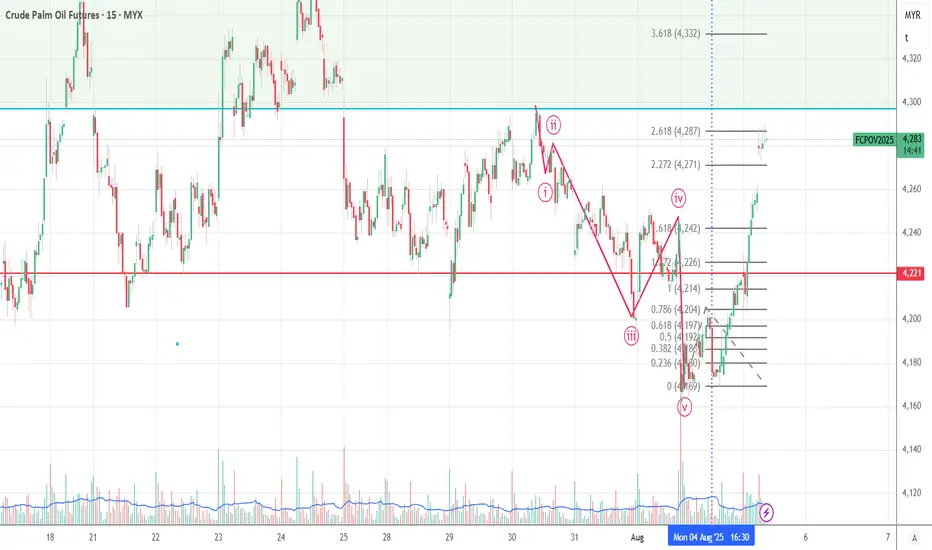
FCPO should reverse as it reached 2.618
### **1. Overall Market Context**
* Current price: **4,285 MYR**
* Recent high: **4,286 MYR**
* Market shows a **sharp rebound** after a 5-wave downward Elliott sequence.
* Current trend: **Short-term bullish reversal** after completing a possible Elliott Wave 5 down.
---
### **2. Elliott Wave
1/8/25 Will Weekly Candlestick Close Near Low or Long Tail Below
Thursday’s candlestick (Jul 31) was a bear bar closing near its low.
In our last report, we said traders would see if the bears could create a strong retest of the July 29 low, or if the market would trade slightly lower, but find support around the 20-day EMA instead.
The market traded lower
31/7/25 Still Sideways to Down Pullback Phase
Wednesday’s candlestick (Jul 30) was a small bull bar with a prominent tail above.
In our last report, we said traders would see if the bulls could create a retest of the July 24 high and a breakout above, or if the market would trade slightly higher but stall around or below the July 24 high,

30/7/25 Weak Selling Pressure So Far
Tuesday’s candlestick (Jul 29) was a bull doji bar closing in its upper half with a long tail below.
In our last report, we stated traders would see if the bears could create follow-through selling, or if the pullback phase would be weak and sideways, holding above or around the 20-day EMA inst
29/7/25 Pullback Underway, Minor or Something More?
Monday’s candlestick (Jul 28) was a bear doji bar closing around the middle of its range with prominent tails.
In our last report, we stated traders would see if the bears could create follow-through selling, or if the pullback phase would be weak and sideways instead.
The market traded slight
See all ideas
Summarizing what the indicators are suggesting.
Neutral
SellBuy
Strong sellStrong buy
Strong sellSellNeutralBuyStrong buy
Neutral
SellBuy
Strong sellStrong buy
Strong sellSellNeutralBuyStrong buy
Neutral
SellBuy
Strong sellStrong buy
Strong sellSellNeutralBuyStrong buy
A representation of what an asset is worth today and what the market thinks it will be worth in the future.
Displays a symbol's price movements over previous years to identify recurring trends.
Frequently Asked Questions
The current price of USD Malaysian Crude Palm Oil Calendar Futures (Jan 2027) is 1,008.00 USD — it has fallen −0.78% in the past 24 hours. Watch USD Malaysian Crude Palm Oil Calendar Futures (Jan 2027) price in more detail on the chart.
Track more important stats on the USD Malaysian Crude Palm Oil Calendar Futures (Jan 2027) chart.
The nearest expiration date for USD Malaysian Crude Palm Oil Calendar Futures (Jan 2027) is Jan 29, 2027.
Traders prefer to sell futures contracts when they've already made money on the investment, but still have plenty of time left before the expiration date. Thus, many consider it a good option to sell USD Malaysian Crude Palm Oil Calendar Futures (Jan 2027) before Jan 29, 2027.
Buying or selling futures contracts depends on many factors: season, underlying commodity, your own trading strategy. So mostly it's up to you, but if you look for some certain calculations to take into account, you can study technical analysis for USD Malaysian Crude Palm Oil Calendar Futures (Jan 2027). Today its technical rating is buy, but remember that market conditions change all the time, so it's always crucial to do your own research. See more of USD Malaysian Crude Palm Oil Calendar Futures (Jan 2027) technicals for a more comprehensive analysis.