Dairy Market Challenges: Lower Prices and Higher Milk ProductionThe US dairy market is entering a challenging phase, marked by rising milk production and declining prices. The USDA’s April 2025 World Agricultural Supply and Demand Estimates (WASDE) report projects US milk production at 226.9 billion pounds, an increase from the prior estimate, while prices for key dairy products like butter, cheese, nonfat dry milk (NDM), and whey are expected to fall, dragging the all-milk price down to $21.10 per cwt.
Rising Production Meets Falling Prices
The WASDE report highlights a notable increase in US milk production for 2025, now forecasted at 226.9 billion pounds, up from the previous estimate of 226.2 billion pounds. This rise is driven by larger cow inventories and a slight increase in milk yield per cow, reflecting improved productivity in the dairy sector. However, this supply growth comes at a cost: prices for dairy products are projected to decline across the board. Cheese prices CME:CSC1! are lowered to $1.79 per pound (down from $1.81), butter NZX:BTR1! to $2.445 per pound (down from $2.515), NDM to $1.22 per pound (down from $1.255), and dry whey CME:DY1! to $0.51 per pound (down from $0.525). As a result, the Class III milk price CME:DC1! , tied to cheese and whey, is reduced to $17.60 per cwt, while the Class IV price CME:GDK1! , linked to butter and NDM, falls to $18.20 per cwt. The all-milk price, a key indicator for dairy farmers, is now projected at $21.10 per cwt, down from $21.60.
This price decline reflects not only the increased domestic supply but also broader market dynamics. The WASDE report notes that higher milk production is putting downward pressure on prices, as supply outpaces demand growth. Additionally, the dairy market is grappling with weaker demand for certain products, particularly in export markets, which further exacerbates the price squeeze.
Trade Barriers and Export Challenges
Trade dynamics are adding to the dairy sector’s challenges. The WASDE report indicates that imports on both a fat and skim-solids basis are lower, primarily due to additional duties on imported dairy products like butter fats and milk protein products. For example, fat basis imports are down to 8.5 billion pounds (from 8.9 billion), and skim-solids imports are reduced to 6.7 billion pounds (from 7.0 billion). These tariffs, a byproduct of the ongoing US-China trade war and broader protectionist policies, are limiting the availability of imported dairy products, which could otherwise offset domestic oversupply.
On the export side, the outlook is mixed. Exports on a skim-solids basis are reduced to 44.6 billion pounds (down from 47.5 billion), driven by lower shipments of dried skim milk products and whey products, which face weaker global demand and competition from other dairy-producing regions. However, fat basis exports are slightly up at 11.8 billion pounds (from 11.7 billion), supported by higher shipments of butter. Despite this uptick, the overall export picture remains challenging, as global trade tensions-such as tariffs on US pork and beef exports to China-indirectly impact dairy by slowing economic growth in key markets, reducing demand for dairy products.
Domestic Demand and Market Implications
While export markets pose challenges, domestic demand for dairy products in the US remains relatively stable. The WASDE report projects fat basis domestic use at 223.1 billion pounds, unchanged from the prior estimate, and skim-solids domestic use at 187.3 billion pounds, up from 184.3 billion. This stability in domestic consumption provides a buffer against export declines, but it’s not enough to offset the oversupply-driven price drop. Dairy farmers, facing an all-milk price of $21.10 per cwt, may see compressed margins, particularly as input costs like feed remain elevated amid broader inflationary pressures.
For investors, this environment signals caution in the dairy sector. The lower all-milk price could pressure the profitability of dairy producers, especially smaller operations that lack the scale to absorb cost increases. However, larger, vertically integrated dairy companies with diversified product lines-such as those producing cheese, butter, and yogurt-may be better positioned to weather the downturn by leveraging economies of scale and tapping into stable domestic demand.
Investment Strategies in a Challenging Dairy Market
Despite the challenges, the dairy market offers selective opportunities for long-term investors willing to navigate the current headwinds. The stability of domestic demand, coupled with the potential for export recovery if trade tensions ease, provides a foundation for strategic investments. Larger dairy companies with strong balance sheets, such as Dairy Farmers of America (DFA), which reported $2.8 billion in revenue in 2024, could benefit from their scale and ability to manage costs effectively. DFA’s cooperative model, serving over 12,500 farmers, positions it to maintain stability even as prices fall to $21.10 per cwt.
Another avenue for investment lies in dairy-focused ETFs, which offer diversified exposure to the sector. The Invesco DB Agriculture Fund (DBA), with 10% of its portfolio allocated to dairy futures, provides a way to gain exposure to the broader agricultural market while mitigating the risks of individual dairy stocks. DBA’s assets under management grew to $800 million in 2024, reflecting investor interest in agriculture as a hedge against inflation, despite dairy’s current price challenges.
Investors might also consider companies in the dairy processing and consumer goods space, where innovation and branding can drive growth. For example, Danone North America, known for its yogurt and plant-based dairy alternatives, reported a 6% sales increase in 2024, driven by consumer demand for healthier options. Danone’s ability to adapt to shifting consumer preferences-such as the growing popularity of low-fat dairy products-makes it a resilient player in a price-constrained market.
Risks to Monitor
The dairy market’s challenges come with notable risks. Persistent trade barriers, such as the tariffs on butter fats and milk protein products, could further limit export recovery, with skim-solids exports already down to 44.6 billion pounds. Additionally, the projected increase in milk production to 226.9 billion pounds may exacerbate oversupply if domestic demand growth stalls, potentially pushing prices even lower than the current $21.10 per cwt forecast. Inflationary pressures on input costs, such as feed and labor, also pose a risk to dairy producers’ margins, particularly for smaller firms.
The US dairy market faces a challenging landscape with milk production rising to 226.9 billion pounds and the all-milk price falling to $21.10 per cwt amid trade barriers and export declines. While these dynamics pressure dairy producers, they also create selective opportunities for investors. Larger firms like Dairy Farmers of America, ETFs like the Invesco DB Agriculture Fund AMEX:DBA , and innovative consumer goods companies like Danone ICEEUR:DAO1! offer pathways to navigate the downturn. By focusing on resilient players and monitoring trade developments, investors can position themselves for long-term growth in the dairy sector, even as it grapples with oversupply and price challenges in a volatile global market.
ECONOMICS:WWDRPI
DCN2025 trade ideas

Dairy Market Update (2.21.25)U.S. Milk Production and Supply Adjustments
The USDA has revised its U.S. milk production forecast for 2025 downward to 229.2 billion pounds, reflecting a 0.5-billion-pound reduction from previous estimates. This adjustment is due to a slower-than-expected increase in milk output per cow and ongoing reductions in the national dairy herd. Rising feed costs and tight margins have contributed to a more cautious expansion strategy among dairy producers.
Cheese and Butter Price Forecasts
The updated WASDE report projects mixed price movements across major dairy products:
Cheese prices CME:CSC1! are expected to average $1.79 per pound, down slightly due to softer domestic demand and increased competition from imports.
Butter prices NZX:BTR1! are forecasted at $2.54 per pound, reflecting strong consumer demand and tighter domestic inventories.
Nonfat dry milk (NFDM) and whey prices remain stable, with minor adjustments driven by export trends and global production levels.
U.S. Dairy Exports and Global Trade Trends
The U.S. dairy export outlook has softened slightly, with total dairy exports projected at 4.9 billion pounds in 2025, reflecting weaker demand from key international markets. China’s dairy imports are expected to remain subdued due to high domestic milk powder inventories and slower economic growth. Mexico continues to be a strong buyer of U.S. dairy products, particularly cheese and NFDM, supporting export stability. The European Union and New Zealand remain competitive in global dairy markets, challenging U.S. pricing power in certain categories.
Price Outlook and Market Implications
The all-milk price forecast for 2025 has been adjusted to $19.85 per hundredweight (cwt), reflecting a $0.25 decline from prior estimates. Global dairy market volatility, particularly in trade-sensitive products like whey and NFDM, could influence price movements in the coming months. Potential shifts in U.S. farm policy and trade agreements may also impact dairy market dynamics, as discussions on export incentives and tariff adjustments continue.
Investment Considerations
For traders and investors, the dairy market presents multiple areas of interest:
• Futures and Options Trading: The volatility in milk and butter prices could create opportunities in dairy futures markets.
• Agribusiness and Processing Stocks: Companies involved in dairy production, processing, and exports may see earnings fluctuations based on price and trade developments.
• Feed and Input Costs: Rising feed costs could pressure dairy farm margins, affecting profitability and long-term supply trends.
ECONOMICS:WWDRPI

Milk and Dairy Prices: Rising Costs Amid Declining ProductionDecline in U.S. Milk Production and Its Drivers
In recent months, milk production in the United States has declined significantly. These changes comes to us as result of rising feed costs, adverse weather and a lack of farm labour. With input prices rising sharply due to disruptions in the global supply chain and the volatility of energy prices, many dairy farmers are finding it increasingly difficult to maintain profitability. As a result, some farmers have reduced the size of their farms or left the industry altogether, further contributing to the contraction in supply.
This trend is particularly concerning, given that the U.S. remains one of the largest dairy producers globally, accounting for approximately 20% of total world milk output. The decline in domestic production not only affects local markets, but also reverberates through international trade channels, where the U.S. plays a crucial role as both an exporter and importer of dairy products.
Upward Pressure on Cheese, Butter, and Whey Prices
As milk production decreases, downstream dairy products such as cheese CME:CSC1! , butter NZX:BTR1! , and whey CME:DY1! are experiencing upward pressure on prices. According to USDA forecasts, cheese prices are expected to rise by 8–10% year-over-year, while butter prices could increase by up to 15% during the same period. These increases reflect tighter supplies and heightened demand from both domestic consumers and export markets.
Whey, a byproduct of cheese production widely used in nutritional supplements and animal feed, is also seeing significant price appreciation. Global demand for whey protein concentrates (WPC) continues to grow, driven by expanding fitness and health-conscious consumer segments in Asia and Europe. However, constrained milk availability limits the ability of manufacturers to meet this growing appetite, exacerbating price inflation.
Implications for Global Dairy Trade
The reduction in U.S. milk production has far-reaching implications for global dairy trade dynamics. Historically, the U.S. has been a reliable supplier of dairy commodities to countries like Mexico, China, and Southeast Asian nations. As domestic output shrinks, however, these regions may seek alternative sources to fulfill their needs. Key competitors such as New Zealand, Australia, and the European Union stand poised to capitalize on this opportunity, potentially altering long-standing trade relationships.
For instance, Mexico, the largest importer of U.S. dairy products, relies heavily on American cheese and milk powders to support its burgeoning food processing sector. A sustained decline in U.S. exports could force Mexican buyers to diversify their supplier base, leading to shifts in market share among major players. Similarly, China's increasing self-sufficiency efforts in agriculture may accelerate if imports from the U.S. become less dependable.
Looking Ahead: Challenges and Opportunities
The current state of the U.S. dairy industry underscores the need for strategic adaptation to address structural challenges. Producers must explore ways to optimize resource utilization, adopt advanced technologies, and secure sustainable financing options to remain competitive in a volatile environment. Policymakers, meanwhile, face the task of balancing producer support programs with broader economic goals, ensuring equitable access to subsidies without distorting market mechanisms.
On the global stage, emerging economies present promising opportunities for expansion, provided they can overcome logistical hurdles and regulatory barriers. By fostering partnerships with international stakeholders and investing in value-added product development, the U.S. dairy sector can position itself for resilience in an ever-changing landscape.
ECONOMICS:WWDRPI

Coffee and Dairy Futures: Commodities in a new lightCoffee, Sugar, Cocoa, and all 5 milk futures are listed in this layout.
People buy a lot of coffee and milk which is why this chart is of importance. The Sugar, Coffee, and Cocoa are obviously used to make the caffeinated drink.

Coffee and Dairy Futures: Commodities in a new lightCoffee, Sugar, Cocoa, and all 5 milk futures are listed in this layout.
People buy a lot of coffee and milk which is why this chart is of importance. The Sugar, Coffee, and Cocoa are obviously used to make the caffeinated drink.

Short positions - Milk Class IIIOur Manual Systematic Program is opening short positions in Milk Class III with managed futures.
1st sell stop: 17.5
1st guaranteed trailing stop: 17.8 (0.3% of portfolio)
Take profit: Guaranteed trailing stop


Sellers Just 'Cut The Cheese' In Half $CSC_FI think the collapse in Cheese futures is being under-covered here. Prices were just cut in half and momentum registered a sub-3 reading on the daily RSI-14. Not something you see every day. No wonder Domino's Pizza is doing so well $DPZ $CSC_F

The “real” Price of a Gallon of Milk? (Farm Bankruptcies)
What is the “real” price of a gallon of milk?
Why are we seeing one of the largest milk companies in the world file a REAL bankruptcies… Whats going on in the foods industry?
For one gallon of milk, (most people) in the United States think of the “national weighted average” price. The price for milk and in “most cities” according to the USDA is $3.50 to $4.00, compared to about $6.00 to 8.00+ for organic milk. (USDA Retail Milk Price Index 2020)
Unfortunately milk on the commodities market isn’t traded it “gallons”. So its difficult to understand the “price”. Class Grade “A” Milk futures are typically traded under the symbol “DA” and in a contract sizes of 200,000 lbs of Grade “A” cow's milk. The contracts are traded on something very similar to the “normal stock market” but are traded as “futures” in ticks of $.01 per “cwt”. worth $20 per contract. In North America, a “cwt” is equal to about 100 pounds or 112 pounds in the Europe (UK). So the “price” of milk to a stock broker is about $20 for 100 gallons. However, the price has CRASHED to about $10 or less (lowest in 10+ to 20 years!?)
The price of milk has crashed! What about the health of the animals? What about the farms?
We have all been hearing these quotes in the news. That “the current prices” are maybe some of the “lowest we will see in our lifetime?” But Milk!?!? and certainly the lowest in 10 years and including inflation of about 250% since the same gallon of milk in the 1970’s shouldn’t be the same price as one today? So we have to divide the prices by 2.5!
I happen to live in one of the 3 largest “milk producing” states in the United States (Idaho!). The largest “milk producing” states are California, Wisconsin, and Idaho. Idaho actually produces more milk then New York, Texas, Michigan, Pennsylvania, Minnesota, New Mexico, or Washington. However, they all produce a LOT of milk! Each of these states produce about 10 BILLION pounds of milk EACH… with states like California and Wisconsin producing more then 30 to 40 billion pounds of milk? This is a LOT of milk! a billion is a thousand million! (1,000,000,000) and its 30 to 10 times even this number and globally the estimates are in the trillions of pounds of milk each year!?!
The United States is the largest milk producer in the world?! Here are the “weight” totals for milk globally are measured in Kilograms not Pounds. So these numbers are multiplied by x2.2 to get “pounds”. Keep in mind that one of the largest producers of Milk is filing for Bankrupt in the United States.
USA (91.3 billion kilograms)
India (60.6 billion kilograms) …
China (35.7 billion kilograms) ...
Brazil (34.3 billion kilograms) …
Germany (31.1 billion kilograms) ...
Russia (30.3 billion kilograms) ...
France (23.7 billion kilograms) ...
New Zealand (18.9 billion kilograms) ..
How are we treating the “big” animals? Is this a different bankruptcy because its with “real live animals?”
Many cows are treated HORRIBLY! It is actually totally terrifying to see videos of how cows are actually treated on farms today! Its TERRIFYING. I was totally shocked at the videos its almost impossible to describe how horrible some of the things done to cows are in these milking videos.
Today’s average dairy cow produces six to seven times as much milk as she did a century ago. With the rise of factory farming, milk is now a totally unnatural operation. Videos on the internet show cows latterly being dumped using tractors, electrocuted, shot in the head, burned on the head while still alive, many many cows barely able to walk, having their font lags not able to stand and being dragged across the floor while their knee caps bleed.
This month one of the largest dairy company in the world and in the United States if finishing up and “filing” new paperwork for Bankruptcy and to “fire sale” everything all of their assets. We need someone to work on helping these farms! This cow milk company has been around for 94 years!? And is now in the final stages of their bankruptcy? They have made almost 7 billion dollars a year from cows milk? And had more than 50 national, regional and local dairy brands as well as private labels will all be “bankrupt” giving many dairy farmers “90 days” (from what you hear on the videos posted on the internet about farm closures). (Dean Foods, Organic Valley, Land-o-Lakes sound familiar?)
Cows in the dairy industry spend their lives in a constant cycle of “antibiotics to cure infections”... (chicken farmers are not legally allowed to give chickens hormone treatments anymore) however, cows seem to be injected with hormones to increase milk production (as long as they are not “traceable” by the USDA blood screening? and I personally live on a University Farm in Idaho where they actually cut holes it appears on “live cows” and attach “strange devices” that look like they are giving vitamins “for quick injection of experimental hormones” to the cows directly into these patches on their stomachs? The cows do NOT look happy! Imagine a field of cows all with “frisbees” disks surgically on their stomachs so that they “grow faster?” and injections can be make “easily”? This is maybe for real? And it looks like that from the roadside of the University Farms?
What is the price of milk?

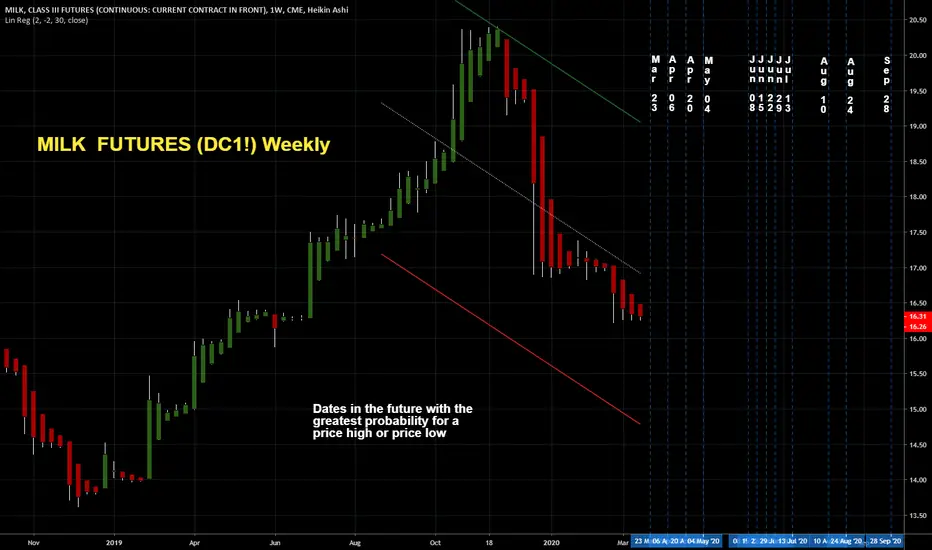
MILK FUTURES (DC1!) WeeklyDates in the future with the greatest probability for a price high or price low
SMS Trade Entry - Short March MilkFridays move in Class 3 Milk Futures confirm a dowside breakout and potential new downtrend. SMS Strategy enters short at 17.14 with a stop at 17.48. Risk $680.

Eat your curds and WHEY!!!Extremely weak. Weakest one of the bunch. Have downside target on. Volume sloping but market is still short.


June Milk Bear GartleyJune Milk Bear Gartley. Retrace possibly back to pivot. Milk is still bullish as summer approaches.

May Milk Bear ButterflyMilk is creeping towards a Bear Butterfly at 15.95. Milk should continue bullish after a retrace. This could then turn into an Elliot Wave above 16.

April Milk Bear CypherApril Milk formed a bearish Cypher last week. Higher prices were rejected on Thursday. Target maybe the 20 day Moving Average for another rise further up. Pivot at 14.92 would be first target before MA. If it falls through the MA then S1 would be the next available target at 14.55. If we get a rise on MA then we might be moving towards an Elliot Wave upwards. Prices have been in decline for a couple of months now. USDA price average is the yellow box, 14.70 - 15.40.

Bear Bat on MilkMarch Milk looks to be setting up a bear bat to R1 at 14.95. Milk has been in a tail spin downward for a long while and don't see any reprieve just yet. Milk may go to R2 as this would produce a double top. Rise in prices have been due to good sales in Pizzerias for Super Bowl and now for NBA all star week today. Inventories still high for cheese so would expect chop to lower prices after this surge.

January Milk Bearish BatMilk found a bottom two days ago and is now in retracement heading for pivot at 15.32. Hit the 20 day MA and will need to advance past this to achieve pivot. RSI is pushing upwards and trend is up. Believe double bottom needs to be achieved before significant headway can be made. This is still a bearish market.

December Milk Head and ShouldersDec Milk creating a H&S. Fell today laying out last shoulder. S1 15.93 target for bears. Breaching this and staying under would put Milk target at S2 15.77 and shoulder height coming around S3 15.60 to 15.51. Milk is also under the 20 day MA supporting this outlook.

October Milk Resistance at 16.96Milk fell from a Bat two weeks ago and looking like it may topple more. Has broke the RSI trend and the 20 day MA. S1 at 16.11 next target for bears. Uptrend must be broken before this can take place. Suggesting a bull Bat next pattern. If milk pushes off the uptrend then we might see a triple top and upside to R3 at 17.28.

September Milk Possible Bull RunMilk looking like it may make a run to R2 at 16.24. Right now caught in channel. Waiting for confirmation out of channel and move to R1 at 15.96. Bear Gartley would be the pattern. Market rising above the 20 day MA which is a good sign. Lots of potential RSI to run.
