ETH/USD Breaking Higher, Can Fill The Gap? Hey traders,
Some of the altcoins are recovering very nicely today, with Ethereum being no exception. In fact, we’ve seen a pretty nice consolidation on ETH over the last three weeks, and it looks like it’s breaking to the upside right now. I wouldn’t be surprised to see more gains unfolding into wave five of a five-wave advance away from the April lows.
Targets around 3000 and even 3300 could be quite interesting, especially if we consider the big gap that dates back to February.
GH
ETHQ2025 trade ideas

Ethereum's Downtrend Pauses—Reversal or Further Drop?FenzoFx—ETH/USD currently trades around $2,480, ranging between $2,336.0 support and $2,797.0 resistance. Given the recent break of structure, the bearish trend may resume, targeting $2,336 as the next liquidity trap.
This level may offer a discounted entry for long positions. Traders should watch for bullish signals like candlestick patterns and fair value gaps on lower timeframes (M5, M15) during the NY session.

Ethereum Rejected By Strong Resistance, A Bearish OutlookFenzoFx—Ethereum is consolidating around $2,525 after being rejected by the $2,813.0 resistance, a strong supply zone. Immediate support lies at $2,446.0. If ETH closes below this level, a move toward $2,080 is likely.
The bearish outlook is invalidated if ETH stabilizes above $2,813.0.

SHORT IDEAHere we see two weekly bearish candles below the triangle resistance, following the recent geopolitical developments in the Middle East I predict a decline and have set a target of $999.

Ethereum Consolidates: A New Bearish Target Could Be on the HoriFenzoFx—Ethereum faced rejection at $2,813, triggering a downtrend before stabilizing near the bullish FVG. ETH/USD now trades at $2,566, recovering some losses.
Immediate resistance is at $2,395, but liquidity sweeps make it fragile. A rise toward $2,700 could precede another bearish wave.
If selling pressure persists, ETH may drop to $2,395 or further to $1,910.

Ethereum's Monthly High Rejection: Is a Bearish Wave Coming?FenzoFx—Ethereum tested and swept the monthly highs at $2,813 but failed to sustain its bullish momentum. The 1-hour chart formed a bearish fair value gap, signaling increasing selling pressure.
Currently, Ethereum trades slightly below the monthly high at approximately $2,806, with immediate resistance at $2,813. If this level holds, ETH/USD could target the 50.0% retracement zone near $2,640.

Just some "random" analysis...Here is some analysis on certain pairs, which I haven't done in awhile.
Enjoy!
- R2F Trading

MET1! Sets Up for Continuation Rally After Strong Reversal
Price is now trading above the 20-day and 50-day SMAs, which suggests bullish momentum continuation.
Immediate support lies around $2,400–$2,500, near the 20-SMA and recent swing lows.
Resistance is near the $2,800–$2,850 zone, which is a previous high from the current range.
The recent candles are small-bodied, suggesting low volatility and indecision, typical before a breakout.

Important Support and Resistance Area: 2572.5-2783.5
Hello, traders.
Please "Follow" to get the latest information quickly.
Have a nice day today.
-------------------------------------
(MET1! 1D chart)
The current price range of 2572.5-2783.5 is an important support and resistance area.
If it falls in this section, it is likely to fall to the support section of 1693.5-1933.0.
If it rises,
1st: 3293.0-3448.0
2nd: 3902.0-4141.5
You need to respond depending on whether there is support near the 1st and 2nd above.
-
I think that in order to rise above 2783.5, OBV needs to rise above the High Line and remain there.
Therefore, you need to have a relaxed mind and check whether there is support.
-
Thank you for reading to the end.
I hope you have a successful trade.
--------------------------------------------------
- This is an explanation of the big picture.
(3-year bull market, 1-year bear market pattern)
I will explain more details when the bear market starts.
------------------------------------------------------

Ethereum is on Bullish TrackFenzoFx—Ethereum resumed its bullish trend after testing last week's low at 2,340. Price action and candlestick patterns support the current momentum.
The Stochastic Oscillator at 65.0 suggests the market is not overbought, indicating a likely continuation of the uptrend. The next bullish target is last week's high at 2,755.
Bearish Scenario : If ETHUSD falls and holds below 2,340.0, the downtrend from 2,755 may extend to 2,130.0.
Trade ETH/USD at F enzo F x

Ethereum: 96% of Hedge Funders Were Short on Monday!FenzoFx—Ethereum is trading bearishly, having broken below the 50-SMA. Currently, 96.0% of hedge funders are short, while 52.0 percent of institutional traders were long at the beginning of the week.
If ETHUSD remains under the 50-period moving average, the downtrend may persist, with a potential dip toward the 2,420-dollar support. Retail traders should watch for bullish signals, such as a candlestick pattern, near this level.

Ethereum has exploded, we called this moveFound the article speaking about a coming move in $ETH.
CRYPTOCAP:BTC was the largest position in the account until we increased our CRYPTOCAP:ETH position. We made it the largest position in the account a few days ago.
We had also increased our Crypto holdings, we added CRYPTOCAP:SOL & CRYPTOCAP:XRP , leveraged ETFs.
We stated, not long ago, that ALTCOINS were waking up! Ethereum has moved November lately.

$ETH has woken up!Usually very busy on Thursday, volunteer work, & didn't find the post on us being bullish on CRYPTOCAP:ETH while many have soured on it.
Targets? Purple Arrows!
We bought leveraged ETF AMEX:ETHT CBOE:ETHU very close to the recent lows.

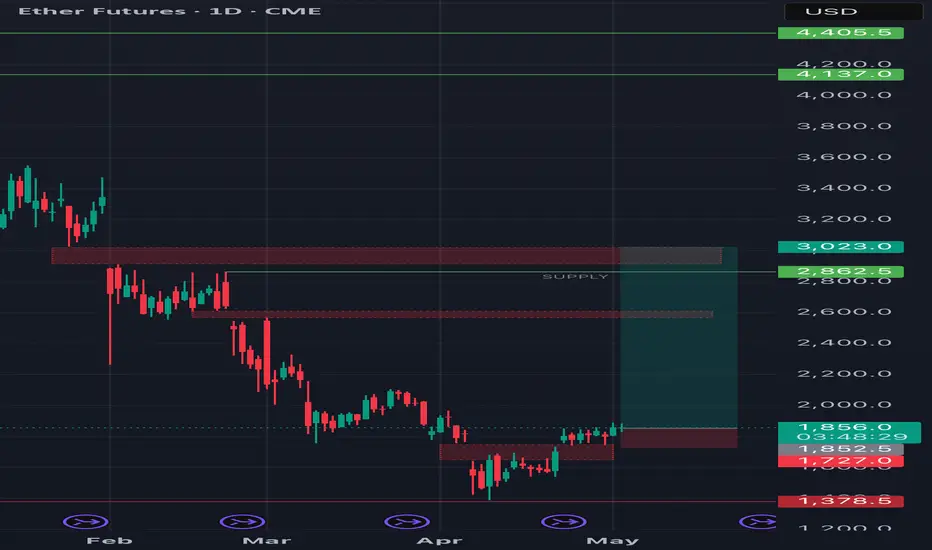
ETH/USDT - Daily Analysis Position: Long | Entry: 1850 | Target:Price has reclaimed the 1800–1850 demand zone with strength after multiple rejections, and is now aiming higher. If the breakout above 1900 sustains, momentum could drive price towards the next key supply zone around 2860–3020, with intermediate resistance near 2600.
I’m currently holding a long from 1850 with a high-leverage setup (50x), targeting 2600.
Risk is elevated due to leverage, but the structure supports bullish continuation as long as we stay above 1800.
A daily close below 1800 would invalidate the setup and trigger stop reassessment.
Watch levels:
• Support: 1800 – 1850
• Resistance: 2600 / 2860 / 3020
• Invalid if closes below: 1700
Ethereum CME Gaps: Inevitable Fill Zones Ahead Chart shows the daily Ethereum (ETH) futures on CME, highlighting three significant CME futures gaps—areas where price jumped due to the weekend market closure. These gaps are key zones where price has historically returned to “fill” the missing trading activity.
Gap 1 at $1,770 is the most recent and closest to the current price of $1,477, suggesting a possible short-term bullish move.
Gap 2 at $2,630 and
Gap 3 at $3,290 are higher up and reflect unfilled areas from previous market drops.
ETH is currently trading below all three gaps, creating a strong technical case for future upward movement. Sooner or later, these gaps will get filled. 🧘♀️

ETH - Possible AccumulationPossible Accumulation structure in ETH.
Need to see a strong break above to confirm LPS.

Ethereum - CME Gap fill before going up ?Ethereum has formed a classic CME Gap between $1,707 and $1,765, following a strong breakout. CME gaps, especially over the weekend, are statistically likely to be filled before the next major move.
We’re watching for a retest of this gap zone with a potential bounce at the lower boundary, creating a solid long entry opportunity.
Entry: 1,710–1,725 (inside the CME gap)
TP1: 1760
TP2: 1800
TP3: 1900
SL: 1,667 (below gap & invalidation of bullish structure)
Like and support us for more such idea.
Cheers
GreenCrypto

ETH good time for move upHERE IS MY SYSTEM:
1. momentum - rsi breaking to upside
2. volume inc - on the W chart, eth had the largest spike ever
3. price action - is it near a support/resistance zone; is there a base or a top, etc
I like that it’s a catchy name - MVP!!! Helps me stick to the rules! 📝
💡in one do the Minervini books, he mentions David Ryan’s mvp indicator. please do not confuse my system w that. that is for stocks and lists specific moves & percentages


ETH1! (Ethereum Futures - CME) Analysis Based on Gap Filling📉📈 ETH1! (Ethereum Futures - CME) Analysis Based on Gap Filling
On the daily chart of Ethereum Futures (ETH1!) on the CME, three significant price gaps can be observed. Historically, these gaps tend to get filled over time. Based on market cycles, we estimate that around 200 days remain until the end of the crypto bull cycle, after which the bear cycle may begin.
🔹 Key CME Gap Levels:
🔸 Lower Gap: $1450 - $1550 (Largest Gap)
🔸 Mid Gap: $2550 - $2625
🔸 Upper Gap: $2900 - $3200
📌 Trade Setup Suggestion:
✅ Entry: $1480
⛔ Stop Loss: $1300
🎯 Target: $3200
🔥 Risk management and confirmation signals using price action are recommended. If the price reacts at the $2550 - $2625 level, partial profit-taking could be a good strategy.
🧐 What do you think about this analysis? Do you also expect these gaps to be filled? 🤔👇
#Ethereum #ETH #CME #Crypto #Futures #TechnicalAnalysis #TradingView

ETH has two pending CME Gaps#ETH #Analysis
Description
---------------------------------------------------------------
+ ETH has two pending CME future gaps to filled.
+ First gap is around 2900-3400 range and second gap is around 2500-2600 range.
+ Sooner or later these CME gaps will get filled. I'm expecting Gap2 get filled in this or next month and Gap 1 in the second or third quarter.
---------------------------------------------------------------
Enhance, Trade, Grow
---------------------------------------------------------------
Feel free to share your thoughts and insights. Don't forget to like and follow us for more trading ideas and discussions.
Best Regards,
VectorAlgo

ETH CMEThere are three gaps on the ETH's CME chart:
-Gap 1 : $2250
-Gap 2 : $2600
-Gap 3 : $3200
The current ETH price is $2355, High possibility of filling all gaps,especially the $3200 gap in March.

ETH update#ETH made 2 gaps in its chart , the small one and the big one , i think that these two should be filled as soon as possible so the small one can be filled easily but the bigger one can remain unfilled untill another big down spike and a big rising spike after that !
