ETHEREUM FUTURES The CME GAP is finally filled, but I am still concerned about the RSI hidden bearish divergence on the weekly chart.
ETH1! trade ideas

$ETH holding better than $BTC but for how long?One of our #ETH TARGETS has been hit. The Gap is FILLED!
CRYPTOCAP:ETH doesn't look as bad as CRYPTOCAP:BTC but it is weakening.
Keep an eye on #Ethereum volume. Very important short term.
As we've been saying for some time now, #ETF , or institutions, are NOT what #crypto is about & makes it easier to manipulate #crypto. It is what it is now.
On ETF news, this might be built in already.

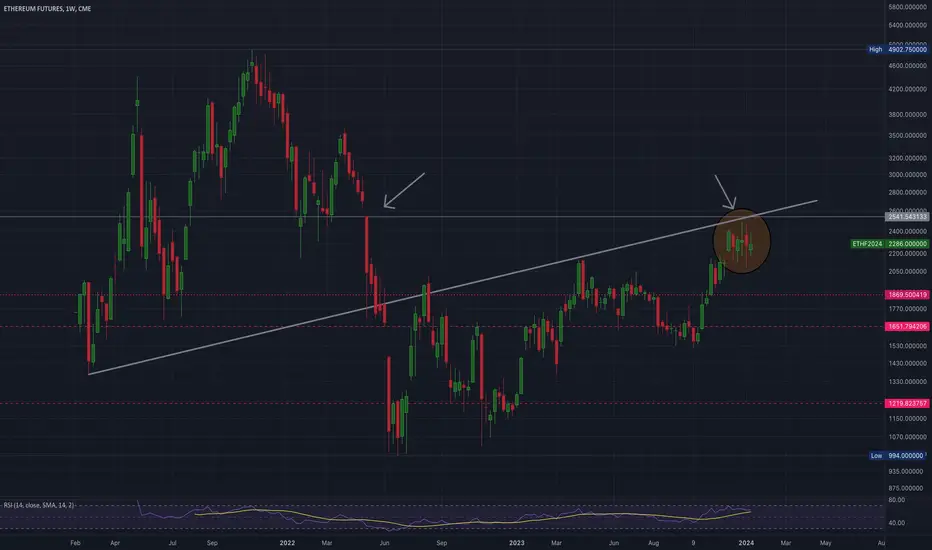
$ETH ETF news but it has held well regardlessCRYPTOCAP:ETH has been hovering around Major Resistance for some time and it has certainly held well.
There's a tiny downtrend but this can easily be broken today & on HEAVY VOLUME.
#ETH RSI & $ Flow are looking petty good, not bad at all.
1st target called long ago was 2300.
Next target is the Gap fill and that sits around 25-2600.
Then the final target would be 50% Fib level, putting #ethereum at 3000. Might pause around there for a bit again.
#crypto #ETF

Major Consolidation I am leaning more toward the idea that it is a bearish consolidation because we just closed the gap. Since things are likely more apparent with ETH, we can correlate it to Bitcoin when bullish ETF hype is still kicking.
ETH I will be a buyer at 1700K$ levels
Right now, my position with ETH and BTC is derisked.
ETH forming bearish engulfing on weekly and more...Battle happening with CRYPTOCAP:ETH at the moment.
#ETH pumps but it cannot hold them.
CRYPTOCAP:ETH is really struggling @ major resistance.
Recently it did break the uptrend and bounced back above.
As of now it's under it again and in the middle of an intraday downtrend.
#ETH RSI & $ FLOW peaked in mid November & have formed negative divergence since then this means it is weakening.
Volume is also lessening with some selling showing up.
CHART SHOWN IS WEEKLY
Weekly #Ethereum forms a bearish engulfing but it lacks volume
Arrows show previous instances.

MMBM for January.I'm not sure about what the first quarter of the year will bring, but I would like to see a bullish response towards the weekly gap. If I'm correct, we are in the 2nd re-accumulation stage of a Market Maker model on the 1D timeframe, so the price should make a strong upward move. In case the idea is invalidated, I'll be looking at the sell-side liquidity below 2144.5.
See weekly chart for context:

$ETH looking yucky atmCRYPTOCAP:ETH is breaking down at the moment.
Currently, it is testing the Green Moving Avg support area.
#ETH has NOT traded under the Green average since Oct 23.
RSI doesn't look very good but it also looked strong before & didn't pump much. So it may weaken but reverse. We'll see.
Weekly does show hope HOWEVER, #Ethereum may get a lil ugly before it gets better.

Have you seen the gaps on ETH chart?
In my opinion we fill all these gaps before we go up.
Make sure you have enough cash to buy Eth at 1100 USD.
Do not get trapped in the market's sentiment.
Buy the fear sell the greed.
Cheers

Time for ETH to Outperform BTC? Ethereum futures (ETH) have showcased robust performance this year, marking an impressive gain of over 80% year-to-date, albeit trailing behind Bitcoin (BTC) with its remarkable surge of over 130%. However, this lag may present a compelling opportunity for ETH as a catch-up trade.
In the realm of cryptocurrency fundamentals, Ethereum distinguishes itself with a broader array of applications compared to Bitcoin. While BTC is often likened to digital gold, Ethereum functions as a decentralized platform facilitating the creation and execution of smart contracts and decentralized applications (DApps).
Ethereum's Performance
Despite its stellar performance, ETH prices remain more than 55% below their peak, in contrast to BTC's 42% decline. Similar to the relationship between gold and silver, the trading dynamics between BTC and ETH reflect their unique roles in the cryptocurrency landscape.
ETH, despite sharing the spotlight with its more prominent sibling BTC, has demonstrated remarkable strength, outperforming traditional stock indices year to date. Notably, the crossing of the 21-day EMA above the 50-day EMA on October 30th, triggered by CPI and PPI numbers for October indicating no increase in inflation, fueled a notable rally in ETH prices, aligning with the broader trend in risk assets.
Major Headwinds for Ethereum:
As the year draws to a close, the prospect of easier financial conditions bodes well for Ethereum, especially as retail traders may increasingly engage in transactions using cryptocurrencies. However, potential headwinds loom with the Federal Reserve's summary of Economic Projections and crucial job-related data releases, including ADP Non-Farm, JOLTs, Unit Labor Cost, Avg Hourly Earnings, and Nonfarm Payrolls.
From a technical standpoint, major support rests at the psychologically significant 2000 level, and the recent break above 2150-2200 has instilled greater confidence in the upside potential of the ETH currency. The interplay of fundamental factors, market dynamics, and technical indicators will continue to shape the trajectory of Ethereum futures.
Check out CME Group real-time data plans available on TradingView here: www.tradingview.com
Disclaimers:
CME Real-time Market Data help identify trading set-ups and express my market views. If you have futures in your trading portfolio, you can check out on CME Group data plans available that suit your trading needs www.tradingview.com
*Trade ideas cited above are for illustration only, as an integral part of a case study to demonstrate the fundamental concepts in risk management under the market scenarios being discussed. They shall not be construed as investment recommendations or advice. Nor are they used to promote any specific products, or services.
Futures trading involves substantial risk of loss and may not be suitable for all investors. Trading advice is based on information taken from trade and statistical services and other sources Blue Line Futures, LLC believes are reliable. We do not guarantee that such information is accurate or complete and it should not be relied upon as such. Trading advice reflects our good faith judgment at a specific time and is subject to change without notice. There is no guarantee that the advice we give will result in profitable trades. All trading decisions will be made by the account holder. Past performance is not necessarily indicative of future results.

ETH False Breakout forming, likely down to late 1800s rangeFalse breakout to above 2100, likely to revisit previous key zone to test support

$ETH lowest amount of shorts & trying to climb higherCRYPTOCAP:ETH on the other hand has the LOWEST amount of shorts in a LONG TIME!!!
Daily it looks like $BTC. At least in the sense that it wants to push a little bit higher.
#ETH targets are in the 2500-2600 & 3k area.
IF #ethereum can break above the Major Resistance right above, 2300ish area, it's off to the races!!
#crypto

buy ETHR futures ( ehtrium ) at 17770, stop 16280buy ETHR futures ( ehtrium ) at 17770, stop 16280
Entered yesterday.

Cryptos: Great Hedge Against the Stock Market DeclineCME: Micro ETH Futures ( CME:MET1! ), Micro BTC Futures ( CME:MBT1! )
On March 29th, I published this trade idea: “Crypto Staged a Strong Comeback in Q1.” At the time, bitcoin was quoted $28,348, up $11,800 or +71.3% year-to-date. The main driver was flight-to-safety when a series of US bank failures shocked the financial markets.
On July 17th, I published a follow-up idea, “Crypto Bull Market Appears to Take Hold.” Bitcoin was closed at $30,146, up 1,798 or +6.3% since the first report.
While the 80%+ gain in the First Half had been remarkable, bitcoin was still 56.2% off its record high of $68,789. As price remerged above the critical $30K mark, investor confidence returned. I suggested that bitcoin would continue to rise.
Last Saturday, spot bitcoin price was settled at $34,090. The leading cryptocurrency is up $17,542, or +106.0% YTD in 2023. Current price is 20.3% higher since I wrote the first idea, and up 13.1% further since I published the 2nd report.
Ethereum, the other leading crypto currency, closed at 1,801 on Sunday, up 50.5% YTD.
Key Drivers for Crypto’s Recent Rises
In my opinion, the rising bitcoin prices could be attributed to the following:
Firstly, strong law enforcement helps investor regain trust in cryptocurrencies.
For a long time, bad actors found ways to steal investor’s money, even though the sector was built on blockchain technologies designed to safeguard crypto assets. This year, the SEC fined Binance, the largest crypto Exchange. Public trial of the founder of FTX, the defunct second largest Exchange, sent strong signals of investor protection.
Secondly, crypto market benefits from investors rotating assets out of stocks.
In the First Half, the S&P 500 was up 15% while the Nasdaq rose 38%. However, the boom in market indexes was a mirage, rather than a real broad-based bull market.
The S&P did not behave like a well-diversified stock market index. The “Magnificent Seven”, which include Nvidia, Apple, Tesla, Microsoft, Google, Meta, and Amazon, represent 30% of the entire index and were up 60%, driven largely by the AI hype. At the same time, the remaining 493 companies were up only 3%. Altogether, the S&P 500 was up 15.8% as of June 15th. Similar phenomenon occurred at the Nasdaq index.
In previously writings, I reasoned with my readers that the US stock indexes could no longer carry the heavy weight of hundreds of mediocre stocks. Rising interest rates eventually caught up with them. An average company saw its market value decline as prescribed by the Discounted Cash Flow stock valuation method.
Since the Federal Reserve turned hawkish in recent weeks, investors became more pessimistic and began taking out stock market profits. On October 27th, the S&P closed at 4,117, a 10.3% drawdown from its yearly high of 4,589. The Nasdaq, at 12,643, was down 11.9% from 14,358. Both indexes are officially in the bear market territory.
Meanwhile, bitcoin was up 16.6% in the last three months. Trade volume data suggests that investors are putting money into cryptos.
• Coinbase market data shows that its bitcoin trading volume in October averaged $15.2 billion, up 35% from September and up 21% from Q3 average.
• The S&P 500 traded 3.8 billion shares per day in October, up only 2.8% from September and up just 1.1% from Q3 average.
Thirdly, the Israeli-Hamas conflict triggers a flight to safety. Investors moved money out of risky assets and into relatively safe assets, including gold, US dollar, and cryptos.
• Since October 6th, COMEX gold futures were up 10.2%. At $2,016 per troy ounce, this is the first market close above $2K in over five months.
• Dollar Index was last closed at 106.58, up 0.5% for the same period and up 3.0% YTD.
• Bitcoin was up 24.2% while Ether rose 9.4% since the Gaza War broke out.
Finally, growing expectations that the SEC will authorize exchange-traded funds investing directly in bitcoin pushed it up by more than 25% over the past two weeks. If materialized, this momentum could form the biggest price breakout in years for cryptos.
Trading with Micro BTC and ETH Futures
In my opinion, the above price drivers will run their courses in coming months, giving solid support for the crypto market. However, having a bullish view is easy, putting money on something already doubling in price is quite hard. In crypto investment, choosing the right instrument will make a big difference.
Neither the physical bitcoin nor the bitcoin ETFs offer any leverage. When price goes up, it will take a larger dollar increase to get the same investment return. For example, when bitcoin was trading at $20,000, a price hike of $10,000 represents a 50% return. When bitcoin rose to $40K, a 50% return will require $20K in price increase.
CME Micro BTC futures ( LSE:MBT ) provide leverage and capital efficiency. Contract notional is 1/10 of 1 BTC. Initial margin is $750. November contract was last settled on $3,409.5. At current price there is a 4.5 times leverage built in the contract, which is the ratio of 3,409.5 divided by 750. If futures price goes up 10% to 3,750.45, the price gain of 340.95 would be a 45.5% return, using the $750 initial margin as a cost base.
In my view, Ether has more room to grow comparing to Bitcoin. In the past five years, Ether price closely tracked that of Bitcoin. In 2023, Ether lagged Bitcoin performance. Its 50% YTD gain, while extraordinary, is just half the return Bitcoin managed to gain.
The ETF fund expectation has a direct impact on bitcoin, but also helps pull the entire crypto market up as it inspires investor enthusiasm. Ether’s lower price, at about 1/19th of a bitcoin, would be more attractive to value investors. At the end, if one crypto ETF is approved, there will be more. ETF funds on Ether could be next.
CME Micro Ether futures ( NYSE:MET ) provide leverage and capital efficiency. Contract notional is 1/10 of 1 ETH. Initial margin is $49. November contract was last settled on $179. At current price there is a 3.6 times leverage built in the contract, which is the ratio of 179 divided by 49. If futures price goes up 10% to 196.9, the price gain of 17.9 would be a 36.5% return, using the $49 initial margin as a cost base.
Warning: Cryptocurrencies and all financial instruments based on the value of cryptos are highly risky investment.
Happy Trading.
Disclaimers
*Trade ideas cited above are for illustration only, as an integral part of a case study to demonstrate the fundamental concepts in risk management under the market scenarios being discussed. They shall not be construed as investment recommendations or advice. Nor are they used to promote any specific products, or services.
CME Real-time Market Data help identify trading set-ups and express my market views. If you have futures in your trading portfolio, you can check out on CME Group data plans available that suit your trading needs www.tradingview.com


#ETHUSD Trading The CorrectionIn this update we review the recent price action in the Ethereum futures contract and identify the next high probability trading opportunity and price objectives to target
PAST PERFORMANCE NOT INDICATIVE OF FUTURE RESULTS

CME GAP RANGEEth is now trending in a new range. This range is created from the 2 CME gaps.
An extreme PvP market. All later positions get squeezed out by 5 to 10% rips and dips.
Retail trading volume is low compared to last 2 years.
Low liquidity means more hunting for exchanges.

Unfilled CME gaps on ETHWill be looking for the RSI MA to trend towards 30.
Timeline maybe off,
Setup does not account for black swan event.

#ETHUSD Bull Flag Breakout PlayIn this update we review the recent price action in ETHUSD and identify the next high probability trading opportunity and price objectives to target
•Past performance not indicative of future results

Ordinals Revive Bitcoin's Builder CultureVitalik Buterin, co-founder of Ethereum, said in the Twitter space that Ordinals marks the return of the builder culture. The Ordinals are bringing back a culture of actually doing things, and it feels like the Retineye movement is really hindered, which is good. Buterin also praised Ordinals and the BRC-20 token standard, which he sees as a rejection of stagnant politics in the bitcoin ecosystem.

Abstracted accounts will drive 1 billion users in Asia to Web3Abstract accounts, also known as "smart accounts," could eventually move 1 billion users in the Asian region to Web3, according to an executive at ethereum software solutions provider ConsenSys. Laura Shi, director of strategic initiatives at ConsenSys, said that the Ethereum and Web3 ecosystems have seen strong expansion in Asia this year. More dApps are improving user experience in Asian markets, including introducing Asian language support. This expansion is largely driven by the launch of the Zero-Knowledge Ethereum Virtual Machine (zkEVM) and the mass adoption of Optimistic rollups.

A giant whale proposed 8166 ETH from Binance, and the winning raAccording to the monitoring of Ember, an analyst on the chain, the giant whale address with a 100% winning rate in swing trading ETH in the previous two months once again raised 8,166 ETH ($15.69 million) from Binance today.
Adding the 8,188 ETH ($15.26 million) raised yesterday, after transferring 31.89 million USDT to Binance, he has withdrawn 16,354 ETH ($30.96 million) from Binance, with an average cost price of $1,893.

Liquidity staking protocol Diva launches Diva DAO with initial dDecentralized liquidity staking protocol Diva launches Diva DAO with an initial distribution to approximately 15,000 unique Ethereum stakers and ecosystem participants. Diva DAO allows DIVA token holders to exercise their voting rights through entrustment and make on-chain decisions about the launch of the Diva protocol, including deploying Diva smart contracts, planning the Diva protocol by adjusting network parameters (if any), and promoting the Diva protocol. Currently, Diva's protocol design is still in progress, and Diva DAO aims to allow the community to participate in shaping Diva's operating framework.
As previously reported, Diva completed a $3.5 million seed round of financing in January this year, led by A&T Capital.

Lookonchain: Giant whales have recently increased their holdingsCoinworld reported that, according to Lookonchain monitoring, the whale 0xb28f spent 200 ETH (approximately $375,000) to buy 321,934 ARBs at a price of $1.16 two hours ago.
0xb28f once spent 300 ETH ($525,000) to buy 538,558 ARBs at $0.98 on June 10.
About 10 hours ago, another whale 0x79cc spent 1,058,665 USDC to buy 937,176 ARB at an average price of $1.13.
