Feb Lean Hogs Bullish FlagsFeb Lean Hog has created a series of bullish flags but hasn't produce much results as of late. Still in the 1/1 Gann Fan. Look for continued sideways action and breakouts unless bears can trade this lower.
HE1! trade ideas

Feb Lean Hog Finish ButterflyLean Hog finished it's butterfly today. Possible run through the XA leg extension and run to top of hogs. Sell back this morning was short lived as bulls are still in command.

Lean Hog Rise out of FlagLike Cattle, Lean Hog broke out of its flag and produced another high, almost reaching the Butterfly 126.2% of the XA leg. If Hogs continues then could enter into the Butterfly extension to 70 and above. Top for hogs is a high made back in 2016-06-15. Could it reach that? Maybe. 61.95 could become support.

Lean Hogs Produces FlagFeb Lean hogs created a bullish flag today and tried several times to exit, or you could also say it did exit depending on your point of view. Potential upside to 66.75 is possible with a follow through to 71 of the Butterfly extension.Being overbought isn't slowing this market down, allow bears did try several times throughout the trading session.

Lean Hogs Stays StrongFeb Lean Hogs did not crumble today. Created a cross of continuation. Still looking for a possible small downturn. With Fed rising interest rates we may see a topple tomorrow. Time will tell.

Lean Hogs Retract OverboughtFeb Lean Hogs hit the ceiling today with a double top pull back. Looking for another day of down getting rid of the overbought market. 59 may be a target. Not sure it will fall that much. Open interest was low so not that many bulls bailed. Will still look for hogs to climb to 64 at some point. There still seems to be plenty of bull power behind this market.

Feb Lean Hogs coming to completionFeb Lean hogs was up today but created a double top. Worked hard all day to clear 62.35 but ran into head way. This market is way over bought and will be seeing collapse soon. Not certain it will achieve the minimal Butterfly. If bulls can muster another push Lean Hogs may close in on 63.75. Market remains in Gann Fan 1/1 which is still indication of a strong market, however hogs have run to far too fast to last.

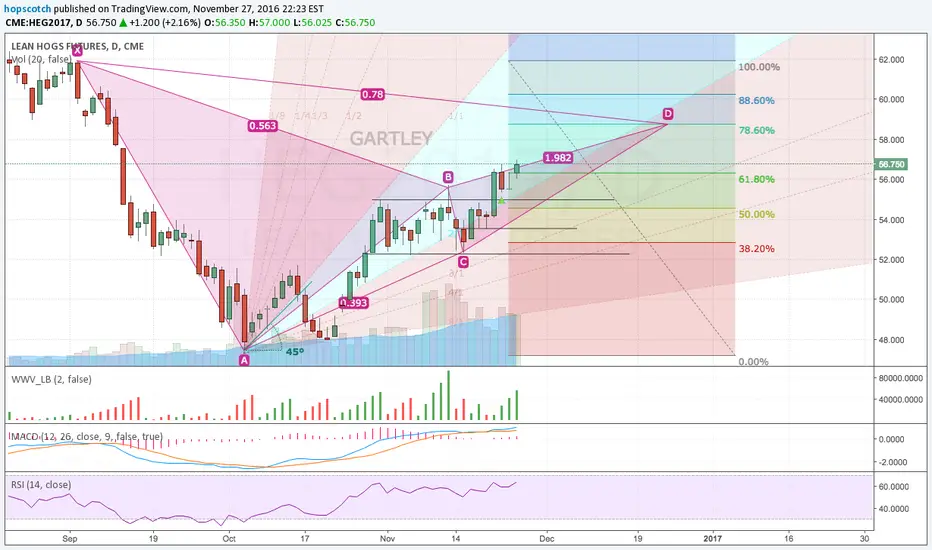
Feb Lean Hogs Rally UpLean Hogs rallied higher today looking to complete the Gartley. Look for Double top if prices don't continue to progress today, although double top is slightly eclipsed. 78.6% is set at 58.775 of the Gartley pattern. If Double top look for price drop Wednesday, but be causes. Could turn into chop. If bulls pressure could see uptrend continue. Watch corn progression.

Strong uptrend for Lean HogsFebruary 2017 Lean Hogs continuing an uptrend. Is contained within the 1/1 Gann Fan and making its way to complete a Gartley pattern.
Feb Lean Hogs breaks through for more upsideFeb 2017 Lean Hogs breaks through its channel at 55.00 to show more upside. Potential continuation of the BAT pattern to 60.00

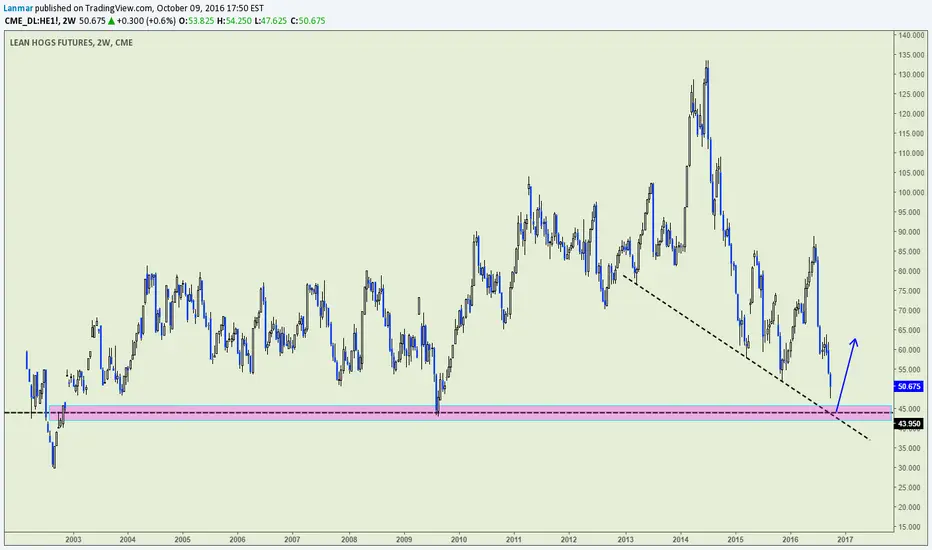


Hogs: Dealing with a logarithmic vs. arithmetic discrepancy My long trade is the assumption that the breakdown on the log chart is a false breakout. I trade based on LOG almost entirely, but there is a mixed bag of data here that leads me to believe it is worth considering both metrics (log vs arithmetic). Many traders dislike trend lines - this is just one of those reasons among many. The way I deal with these situations is to analyze them horizontally and see which levels are violated from there.
From the horizontal perspective price is at an attractive symmetrical level as shown in purple. I am a cautious buyer here. My stop is relatively wide because $5.4 per pound ($54 per 100 weight) would still register as a buy.


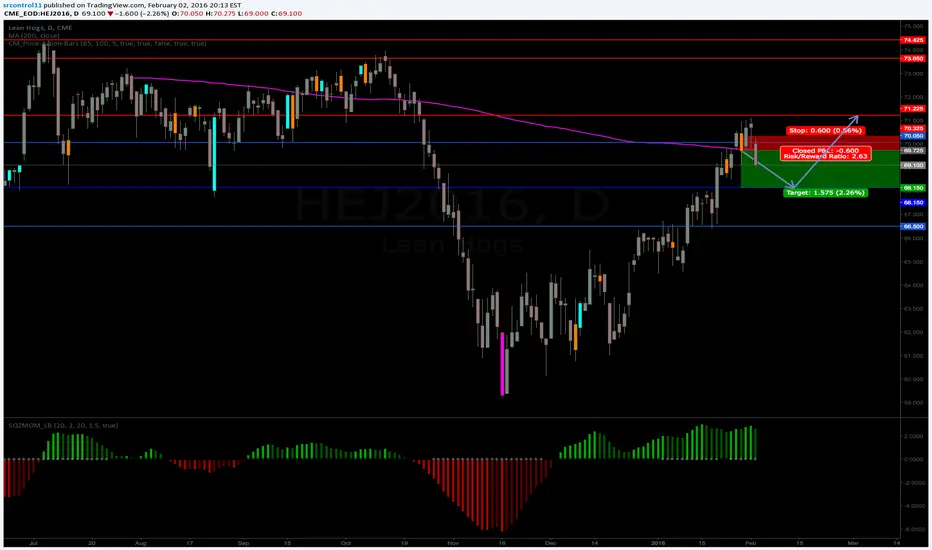
HEJ16Break above Friday"s high for a "short" long trade to the upside. This is a momentum play. Tight stops; one day play for Monday.

Manieri's "Getting Piggy with it"Bearish Cypher pattern @ $77.90
Stops at $89.60
Target 1 @ $67.825
Target 2 @ $61.575

HEJ16Countertrend trade off of price action to the downside. Two days of sweating almost getting filled but today was the day. Locked in to break even and looking for price to retest support. Long term is still long with a buy setup at the test of support.
Hogs reach needs a breath...time for a quick shortHere is a nice cypher pattern for a short at the D point. Look to take profits at the .382 retracement

