**Long Nikkei Short DAXPost BOJ decision which is USDJPY supportive, we could expect the Nikkei to recover from recent weakness.
Since it remains a choppy Equity Environment, selling DAX against it (delta hedge) makes sense from a relative price perspective and looking at technical levels, along with oscilators.
Another way would be to buy Upside calls on Nikkei (cheap in Impiled volatilities) and selling upside on DAX (call vs. Calls strategy)
I will keep it plain vanilla though
ENY1! trade ideas

NIKKEI M30 VOLUME PROFILE
Long Intraday trade NIKKEI based on volume profile & VWAP analisys with estimated SP & TP.

Making Hay in the Land of the Rising SunLong Japan; Short US. Market conditions exist for Nikkei-225 index (“Nikkei”) to remain resilient over the next quarter relative to S&P 500
(“S&P”).
BoJ's unflinching commitment to negative rates benefits Japanese firms with a weak Yen. Meanwhile, worsening economic conditions in the US with feeble growth outlook and likely recession could send S&P lower.
This case study illustrates a spread trade between Nikkei and S&P to extract positive yield with compelling upside and limited downside. Entry at 7.011 with target at 7.402 and stop-loss at 6.787.
TAILWINDS SUPPORTING NIKKEI
In a year of crumbling global markets, Nikkei has shown remarkable resilience. YTD Nikkei is down 6% relative to 18% decline in the S&P. Three reasons why:
1. Consistent low interest rates in Japan: Loose monetary policies inflate asset prices. Thanks to a benign monetary stance from the Bank of Japan (BoJ), Nikkei has been and continues to benefit. The BoJ has set its short-term rates at -0.1% and long-term rates at 0%.
2. Weak and weakening Yen: YTD 2022, the Yen is down 20% relative to USD. This helps boost profits for Japanese firms. While most central banks have gone hawkish, the BoJ is resolute in keeping its monetary policy loose. A weak yen makes Japanese assets cheaper. Rising demand for real estate, and a policy framework that incentivises foreign investment boost capital inflow into Japan (e.g.: TSMC new plant in Japan).
3. Pent-up tourism demand boosting travel industry and local spending: Easing pandemic restrictions and opening of borders unlocking pent-up tourism demand is turning the outlook of tourism industry bright.
NIKKEI TECHNICALS
Since October, Nikkei has rallied 11% to its peak on November 25th and 6.5% to its current levels post correction.
The index sits gently above its 200-day moving average which perhaps serves as a support. The stochastic indicator is at 7.4 suggesting that Nikkei may be oversold and positioning for an upward correction.
HEADWINDS FACING S&P 500
While Nikkei sets to soar, S&P appears feeble. US outlook is bleak with structural shifts pointing to slowing demand and job losses. Hawkish Fed with its stance on raising rates to fend off still hot inflation is likely to tip US economy into recession.
a. Growing Recession Fears
Recession looks likely after FOMC rate hike last week. As Chair Powell remarked, while a soft landing was still possible (skirting a recession), the runway for that was becoming shorter.
Fed's stance remains firm and rightfully so. In the last eight (8) rate hike cycles, not once has the Fed eased until inflation print came lower to Fed funds rate. Expecting more rate hikes in 2023 creates downward pressure on the broader economy and the S&P.
US growth outlook for the next year is a mere 0.5%. About 1.6m more could go jobless. In a sign of growing weakness, last Friday, Goldman announced 8,000 staff retrenchment comprising 8% of its workforce.
b. Shrinking Consumer Spending
Uncertain outlook makes consumers wary. Wary consumers spend less. Forecast by Walmart point to structural weaknesses. Weak retail sales are starting to show with no relief signs in sight.
c. While King Dollar has lost some shine, it remains strong
The US Dollar is enjoying a solid performance in decades. Flight to safety amid a world faced with poly-crisis and compounded by a hawkish fed committed to controlling inflation, the dollar remains king.
A strong dollar is not necessarily good news. Rapid dollar ascent has made US goods & services less attractive hurting offshore earnings for the US firms.
TECHNICALS FAVOR NIKKEI OVER S&P
Notwithstanding the above, S&P is up since October rising nearly 20% to its peak on December 13th and 11% to current levels. However, unlike the Nikkei, the S&P is trading below its 200-day moving average which seemingly is impeding as resistance. S&P fell below its ascending channel suggesting that the rally might have lost steam.
INSIGHTS FROM COMMITMENT OF TRADERS REPORT
As seen in the CME Commitment of Traders Report, Hedge Fund positions vindicates our outlook for Nikkei and S&P. Over the last 12 weeks, hedge funds have increased their net short positions by 34% in the CME's E-mini Futures and Micro E-mini futures .
In sharp contrast, during the same period, these participants have increased their net long positions by 18% in CME Nikkei USD and Yen Futures combined.
TRADE CONSTRUCTION
Spread trades using futures require equal notional exposures across both legs.
With S&P at $3,852, one lot of CME's Micro E-Mini contract provides $19,260 in notional exposure while each CME's Nikkei USD futures contract gives $136,160 exposure.
At current levels, equalising notional value requires 7 lots of Micro E-Mini S&P futures for each lot of CME Nikkei Dollar Index Futures .
One (1) lot of long Nikkei 225 futures is required to offset against Seven (7) lots of short Micro E-Mini S&P500 futures .
Entry: 7.013
Target: 7.402, Potential Profit: $7,783
Stop Loss: 6.776, Potential Loss: $4,177
Reward/Risk Ratio: 1.86
When Nikkei outperforms S&P500, the spread trade delivers positive returns.
Outperformance could manifest in one of three ways: (a) Nikkei rises while S&P falls, or (b) Both Nikkei and S&P rise but Nikkei rises more than S&P, or (c) Both Nikkei and S&P fall but Nikkei falls lesser than S&P. If the reverse of these three scenarios occurs, then the spread trade loses money.
MARKET DATA
CME Real-time Market Data help identify trading set-ups and express market views better. If you have futures in your trading portfolio, you can check out on CME Group data plans available that suit your trading needs www.tradingview.com
DISCLAIMER
Trade ideas cited above are for illustration only, as an integral part of a case study to demonstrate the fundamental concepts in risk management under the market scenarios being discussed. They shall not be construed as investment recommendations or advice. Nor are they used to promote any specific products, or services.
This material has been published for general education and circulation only. It does not offer or solicit to buy or sell and does not address specific investment or risk management objectives, financial situation, or particular needs of any person.
Advice should be sought from a financial advisor regarding the suitability of any investment or risk management product before investing or adopting any investment or hedging strategies. Past performance is not indicative of the future performance.
All examples used in this workshop are hypothetical and are used for explanation purposes only. Contents in this material is not investment advice and/or may or may not be the results of actual market experience.
Mint Finance does not endorse or shall not be liable for the content of information provided by third parties. Use of and/or reliance on such information is entirely at the reader’s own risk.
These materials are not intended for distribution to, or for use by or to be acted on by any person or entity located in any jurisdiction where such distribution, use or action would be contrary to applicable laws or regulations or would subject Mint Finance to any registration or licensing requirement.

Nikkei Futures ( NKD1!), H4 Potential for Bearish continuationTitle: Nikkei Futures ( NKD1!), H4 Potential for Bearish continuation
Type: Bearish continuation
Resistance: 26555
Pivot: 25960
Support: 25610
Preferred case: Looking at the H4 chart, my overall bias for NKD1! is bearish due to the current price being below the Ichimoku cloud, indicating a bearish market. If this bearish momentum continues, expect price to continue heading towards the support at 25610, where the previous swing low is.
Alternative scenario: Price may head back up to retest the pivot at 25960, where the 61.8% Fibonacci line is.
Fundamentals: There are no major news.

GBPJPY....SELL (270 PIPS)With an RR of 1:5.
Prior to 8th November's unveil of $200 bn supplementary budget, there's a huge supply for the Japanese yen....technically, the Nikkei 225 futures is expected to close this week below last week's low.
Looking for a strong rally in the yen.

NIKKEI 225 FUTURES.....LONG (1.65%)After NIKKEI 225, rejected last months high on wednesday, i'm looking for a new high on NIKKEI Futures......
I believe we are in a good bull trend for NIKKEI

NIKKEI 225 FUTURES.....LONG (1.54%)After NIKKEI index rejected the 27850 mark with a bear spike from the previous three lows as shown.....i expect a correction of last week's sell for a new high.

Nikkei225 27635 Target Achieved, What Next?Technical & Trade View
Nikkei225 (emini futures continuous contract)
Bias: Bullish Above Bearish below 27000
Option Expiry:
27635 Target Achieved…New Pattern Emerging
Technicals
27000 is primary support
Primary pattern objective is 27900
Acceptance above 27635 next pattern confirmation
Failure below 26950 opens a test of 26750
20 Day VWAP bullish, 5 Day VWAP bullish

Nikkei225 Rinse & Repeat SetupIn this update we review recent price action in the Nikkei225 futures contract and identify the next high probability trading pattern and price objectives to target

Nikkei225 Target The Equality ObjectiveIN this update we review the recent price action in the Nikkei225 futures contract and identify the next high probability trading opportunities and price objectives to target

Nikkei225 Trading The Bullish SequenceIn this update we review the recent price action in the Nikkei225 futures contract and identify the next high probability trading opportunity and price objectives to target

Nikkei 225 Potential Bullish ContinuationPreference:
On the H4, with price bouncing off the ichimoku cloud and moving in an ascending trend channel, we have a bullish bias that price will continue to rise from the pivot at 26880 in line with the pullback support and 50% fibonacci retracement to the 1st resistance at 28410 in line with the multiple swing high and 100% fibonacci projection .
Alternative Scenario:
Alternatively, price may reverse off the pivot and drop to the 1st support at 26000 in line with the pullback support .
Any opinions, news, research, analyses, prices, other information, or links to third-party sites contained on this website are provided on an "as-is" basis, as general market commentary, and do not constitute investment advice. The market commentary has not been prepared in accordance with legal requirements designed to promote the independence of investment research, and it is therefore not subject to any prohibition on dealing ahead of dissemination. Although this commentary is not produced by an independent source, FXCM takes all sufficient steps to eliminate or prevent any conflicts of interest arising out of the production and dissemination of this communication. The employees of FXCM commit to acting in the clients' best interests and represent their views without misleading, deceiving, or otherwise impairing the clients' ability to make informed investment decisions. For more information about the FXCM's internal organizational and administrative arrangements for the prevention of conflicts, please refer to the Firms' Managing Conflicts Policy. Please ensure that you read and understand our Full Disclaimer and Liability provision concerning the foregoing Information, which can be accessed on the website.

Potential Bullish ContinuationPreference:
On the H4, with price bouncing off the ichimoku cloud and moving in an ascending trend channel, we have a bullish bias that price will continue to rise from the pivot at 26880 in line with the pullback support and 50% fibonacci retracement to the 1st resistance at 28410 in line with the multiple swing high and 100% fibonacci projection.
Alternative Scenario:
Alternatively, price may reverse off the pivot and drop to the 1st support at 26000 in line with the pullback support .
Any opinions, news, research, analyses, prices, other information, or links to third-party sites contained on this website are provided on an "as-is" basis, as general market commentary, and do not constitute investment advice. The market commentary has not been prepared in accordance with legal requirements designed to promote the independence of investment research, and it is therefore not subject to any prohibition on dealing ahead of dissemination. Although this commentary is not produced by an independent source, FXCM takes all sufficient steps to eliminate or prevent any conflicts of interest arising out of the production and dissemination of this communication. The employees of FXCM commit to acting in the clients' best interests and represent their views without misleading, deceiving, or otherwise impairing the clients' ability to make informed investment decisions. For more information about the FXCM's internal organizational and administrative arrangements for the prevention of conflicts, please refer to the Firms' Managing Conflicts Policy. Please ensure that you read and understand our Full Disclaimer and Liability provision concerning the foregoing Information, which can be accessed on the website.

Elliott Wave View: Nikkei Zigzag Rally Approaching TargetShort term Elliott Wave view in Nikkei suggests the decline from 3/29/2022 peak is unfolding as a zigzag Elliott Wave structure. A Zigzag is a corrective structure labelled as ABC with 5-3-5 subdivision. Down from 3/29/2022 peak, wave A ended at 25555 and rally in wave B ended at 28401. Wave C lower is in progress as a 5 waves impulse. Down from wave B, wave (i) ended at 26195 and rally in wave (ii) ended at 26960. Index then resumes lower in wave (iii) towards 25615, wave (iv) ended at 26235 and final wave (v) ended at 25525. This completed wave ((i)) of C. Wave ((ii)) of C is now in progress to correct cycle from 6/9/2022 high before the decline resumes.
Internal subdivision of wave ((ii)) is unfolding as a zigzag structure in lesser degree. Up from wave ((i)), wave (a) ended at 26555 and dips in wave (b) ended at 26005. Wave (c) higher is in progress to complete wave ((ii)) before the decline resumes. Potential target for wave ((ii)) is 100% – 161.8% fibonacci extension of wave (a) which comes at 27040 – 27675 area. Index should then resume lower or pullback in 3 waves at least. Near term, as far as pivot at 28401 high remains intact, expect rally to fail in 3, 7, or 11 swing for further downside.

Nikkei225 +415points, What Next?In this update we review the recent price action in the Nikkei225 futures contract and update the trade strategy and price objectives to target

Potential Bullish BounceOn the H4, with price recently breaking the descending trendline and price ascending on the RSI, we have a bullish bias that price will rise from the buy entry at 26100 in line with the 38.2% fibonacci retracement to the 1st pullback resistance at 27130 in line with the 78.6% fibonacci projection and 61.8% fibonacci retracement. Alternatively, price may break the support at entry and drop to the 2nd support at 25550 in line with the 61.8% fibonacci projection amd horizontal multiple swing lows.
Any opinions, news, research, analyses, prices, other information, or links to third-party sites contained on this website are provided on an "as-is" basis, as general market commentary, and do not constitute investment advice. The market commentary has not been prepared in accordance with legal requirements designed to promote the independence of investment research, and it is therefore not subject to any prohibition on dealing ahead of dissemination. Although this commentary is not produced by an independent source, FXCM takes all sufficient steps to eliminate or prevent any conflicts of interest arising out of the production and dissemination of this communication. The employees of FXCM commit to acting in the clients' best interests and represent their views without misleading, deceiving, or otherwise impairing the clients' ability to make informed investment decisions. For more information about the FXCM's internal organizational and administrative arrangements for the prevention of conflicts, please refer to the Firms' Managing Conflicts Policy. Please ensure that you read and understand our Full Disclaimer and Liability provision concerning the foregoing Information, which can be accessed on the website.

Potential Bearish Continuationon the H4, with price moving below the ichimoku cloud, we have a bearish bias that price will drop from the pivot at 26110 in line with the 100% fibonacci projection and overlap support to the 1st support at 24830 in line with the horizontal swing low.
alternatively, price may rise from the pivot to the 1st pullback resistance at 26900 in line with 78.6% fibonacci projection and 50% fibonacci retracement.

Nikkei Pivotal Trend TestIn this update we review the recent price action in the Japanese Nikkei futures contract and identify the high probability trading opportunity and price objectives to target

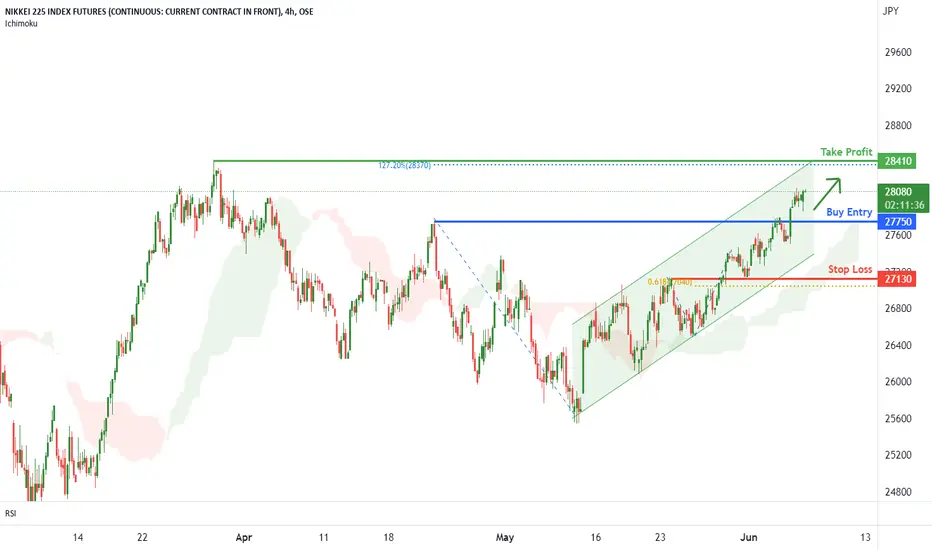
Nikkei 225 Potential Bullish ContinuationOn the H4, with price moving above the ichimoku cloud and within the ascending trend channel, we have a bullish bias that price will continue to rise from our entry at 27760 in line with the overlap swing high to our take profit at 28410 in line with the 127.20% fibonacci expansion at the swing high. Alternatively, price may reverse and break the support level at our entry and drop to our stop loss at 27130 in line with the 61.8% fibonacci projection .
Any opinions, news, research, analyses, prices, other information, or links to third-party sites contained on this website are provided on an "as-is" basis, as general market commentary, and do not constitute investment advice. The market commentary has not been prepared in accordance with legal requirements designed to promote the independence of investment research, and it is therefore not subject to any prohibition on dealing ahead of dissemination. Although this commentary is not produced by an independent source, FXCM takes all sufficient steps to eliminate or prevent any conflicts of interest arising out of the production and dissemination of this communication. The employees of FXCM commit to acting in the clients' best interests and represent their views without misleading, deceiving, or otherwise impairing the clients' ability to make informed investment decisions. For more information about the FXCM's internal organizational and administrative arrangements for the prevention of conflicts, please refer to the Firms' Managing Conflicts Policy. Please ensure that you read and understand our Full Disclaimer and Liability provision concerning the foregoing Information, which can be accessed on the website.

Potential Bullish ContinuationOn the H4, with price moving above the ichimoku cloud and within the ascending trend channel, we have a bullish bias that price will continue to rise from our entry at 27760 in line with the overlap swing high to our take profit at 28410 in line with the 127.20% fibonacci expansion at the swing high. Alternatively, price may reverse and break the support level at our entry and drop to our stop loss at 27130 in line with the 61.8% fibonacci projection.
Any opinions, news, research, analyses, prices, other information, or links to third-party sites contained on this website are provided on an "as-is" basis, as general market commentary, and do not constitute investment advice. The market commentary has not been prepared in accordance with legal requirements designed to promote the independence of investment research, and it is therefore not subject to any prohibition on dealing ahead of dissemination. Although this commentary is not produced by an independent source, FXCM takes all sufficient steps to eliminate or prevent any conflicts of interest arising out of the production and dissemination of this communication. The employees of FXCM commit to acting in the clients' best interests and represent their views without misleading, deceiving, or otherwise impairing the clients' ability to make informed investment decisions. For more information about the FXCM's internal organizational and administrative arrangements for the prevention of conflicts, please refer to the Firms' Managing Conflicts Policy. Please ensure that you read and understand our Full Disclaimer and Liability provision concerning the foregoing Information, which can be accessed on the website.
Potential Bullish Momentum On the H4, with price moving above the ichimoku cloud , we have a bullish bias that price will; rise from pivot at 27370 in line with the overlap support to the 1st resistance at 27740 in line with the 127.2% fibonacci extension and horizontal swing high.
Alternatively, price may break the pivot and support structure and drop to the 1st support at 27140 in line with the 78.6% fibonacci projection .

Potential for Bullish ContinuationOn the H4, price is moving above the ichimoku cloud and within the ascending trendline which supports bullish bias that price will rise from our pivot at 26610 in line with the 38.2% fibonacci retracement to the resistance at 27740 in line with the 78.6% fibonacci retracement and swing high. Additionally, the presence of bullish pressure shown on the MACD indicator further supports our bullish bias.
alternatively, price may reverse and break the pivot and drop to our support level at 25660 in line with the 78.6% fibonacci projection.

E-Mini Nickel Commodity USA Sun Storm Investment Trading Desk & NexGen Wealth Management Service Present's: SSITD & NexGen Portfolio of the Week Series
Focus: Worldwide
By Sun Storm Investment Research & NexGen Wealth Management Service
A Profit & Solutions Strategy & Research
Trading | Investment | Stocks | ETF | Mutual Funds | Crypto | Bonds | Options | Dividend | Futures |
USA | Canada | UK | Germany | France | Italy | Rest of Europe | Mexico | India
Disclaimer: Sun Storm Investment and NexGen are not registered financial advisors, so please do your own research before trading & investing anything. This is information is for only research purposes not for actual trading & investing decision.
#debadipb #profitsolutions
