Using 1 min time frame for entries on VX algo & day tradingwhat time frames do you use to confirm entries outside of a buy signal?
If I am day trading, I will mainly use the 1 minute time frame to look for moving average support and resistance, and read the candle stick patterns as well from that chart.
However, there are times I'll switch to a 5 minute a
About S&P 500 E-mini Futures
S&P 500 — short for Standard and Poor's 500, is a United States stock market index based on the market capitalizations of the top 500 companies that have common stock listed on the New York Stock Exchange or NASDAQ. With its headquarters in New York City and dating back to 1860, Standard and Poor's has offices in 23 countries and maintains the SP 500 index. Over $1.25 trillion USD is indexed to Standard and Poor's portfolio of indices, which includes the S&P 500. The S&P 500 index seeks to reflect the status of the whole stock market by tracking the return and volatility of the 500 most commonly held large cap company stocks on the NYSE, capturing approximately 80% of total market capitalization. The 500 companies comprising the SP500 span all major industries and are selected based on their market capitalization, liquidity, ability to be traded, as well as other factors. Additionally, the importance of the SP500 is highlighted by its use as an economic indicator of the health of the United States economy.
Related futures

DIYWallSt Trade Journal: How I Navigated Powell Firing Rumors & 07/16/25 Trade Journal, and ES_F Stock Market analysis
EOD accountability report: +428.75
Sleep: 7 hours
Overall health: Good
VX Algo System Signals from (9:30am to 2pm)
— 4:17 AM Market Structure flipped bullish
— 9:50 AM Market Structure flipped bearish
— 12:00 PM VXAlgo NQ X3 Buy Signal
—

Trade Journal: Missed Morning Move & Trading Into New Highs07/17/25 Trade Journal, and ES_F Stock Market analysis
EOD accountability report: +447.50
Sleep: 5 hours
Overall health: My health ring is signaling that my body isn't well the last few days.
VX Algo System Signals from (9:30am to 2pm)
— 8:53 AM Market Structure flipped bullish on VX Algo X3!

DIYWallSt Trade Journal:$238 Lessons From Monthly Expiration07/18/25 Trade Journal, and ES_F Stock Market analysis
EOD accountability report: +238.75
Sleep: 5. hours
Overall health: Was working late last night and didn't get much sleep.
VX Algo System Signals from (9:30am to 2pm)
— 8:30 AM Market Structure flipped bullish on VX Algo X3!
— 10:30 AM Ma

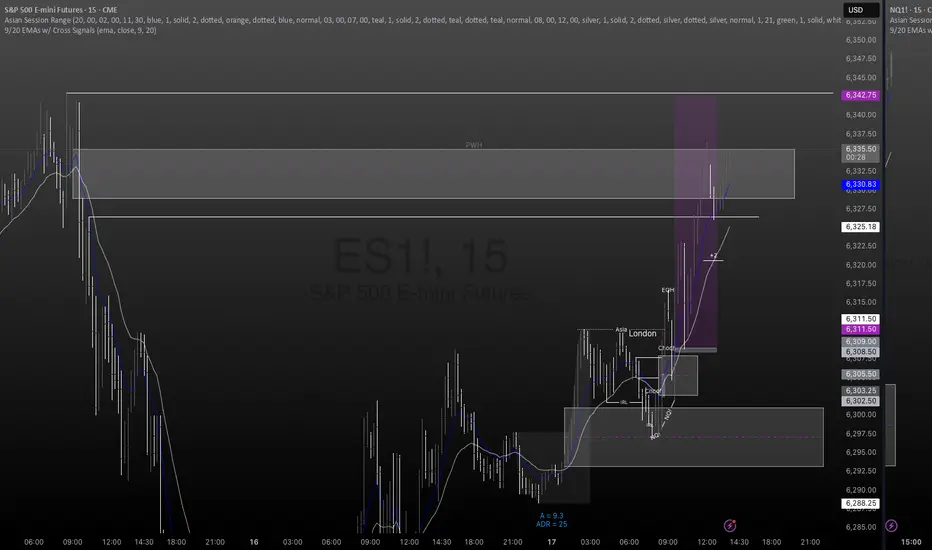
ES! Longs 7RRCRT for Bullish Daily bias
9.30 Sweep on NQ, ES failed to take lows but reacted from 15m FVG
Targets Daily CRT candle high for 7RR clean trade
Tap In!!
#EUBOOGIE
NASDAQ: Still Bullish! Look For Valid Buys!Welcome back to the Weekly Forex Forecast for the week of July 21-25th.
In this video, we will analyze the following FX market:
NASDAQ (NQ1!) NAS100
The Stock Indices are strong, and showing no signs of selling off. Buy it until there is a bearish BOS.
Enjoy!
May profits be upon you.
Leave an

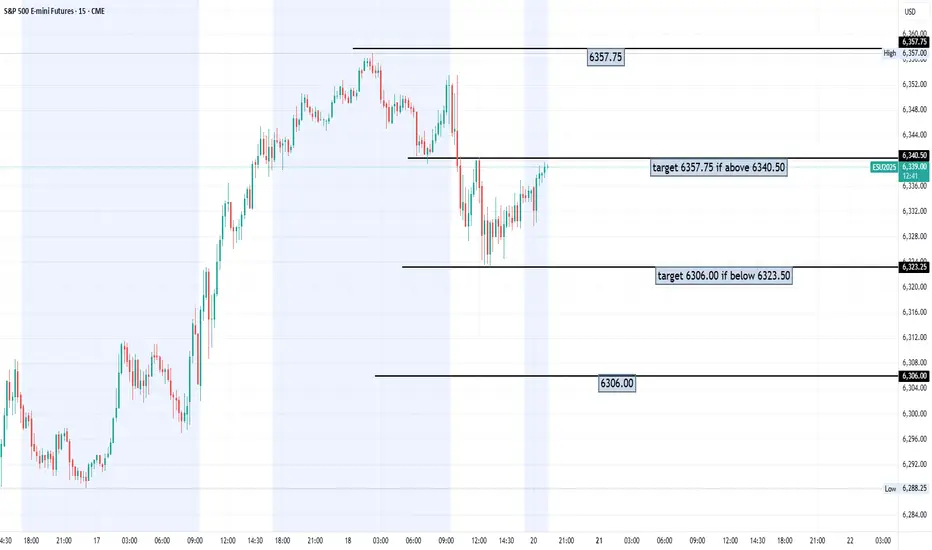
S&P 500: Buyers Are Still In Control! Continue To Look For LongsWelcome back to the Weekly Forex Forecast for the week of July 21-25th.
In this video, we will analyze the following FX market:
S&P 500 (ES1!)
The Stock Indices are strong, and showing no signs of selling off. Buy it until there is a bearish BOS.
Enjoy!
May profits be upon you.
Leave any quest

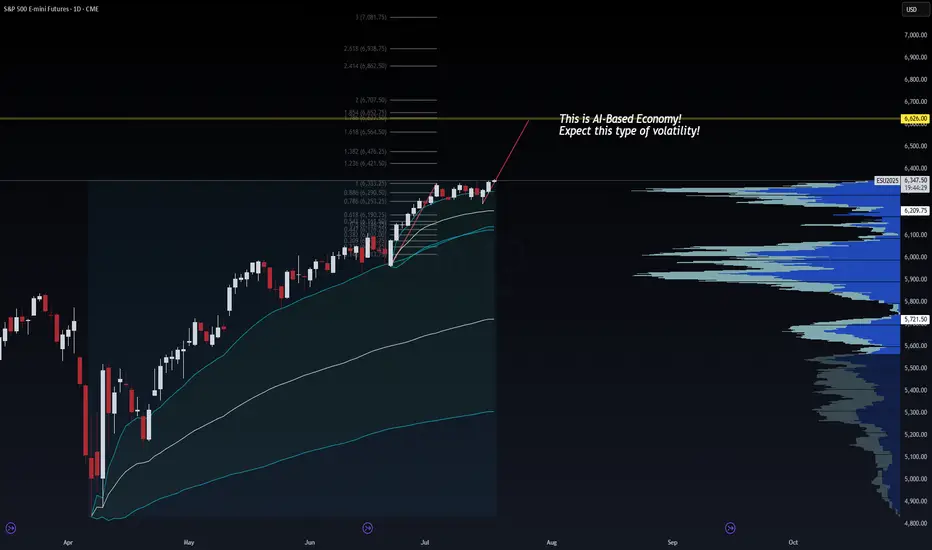
AI Economy Surge: ES Heading to 6626? | VolanX Protocol in Actio🧠 AI Economy Surge: ES Heading to 6626? | VolanX Protocol in Action
📅 Date: July 17, 2025
📈 Instrument: ESU2025 – S&P 500 E-mini Futures
🔍 Timeframe: Daily
🔗 Powered by: WaverVanir DSS | VolanX Protocol
🌐 Macro Backdrop:
📉 Fed on Pause: Market pricing implies a 70% probability of a rate cut in Se
Positioning itselfThe structure in the S&P 500 daily chart implies a market with a bias to the upside positioning itself for the release of fundamental information this week.

See all ideas
Summarizing what the indicators are suggesting.
Neutral
SellBuy
Strong sellStrong buy
Strong sellSellNeutralBuyStrong buy
Neutral
SellBuy
Strong sellStrong buy
Strong sellSellNeutralBuyStrong buy
Neutral
SellBuy
Strong sellStrong buy
Strong sellSellNeutralBuyStrong buy
A representation of what an asset is worth today and what the market thinks it will be worth in the future.
Displays a symbol's price movements over previous years to identify recurring trends.
Frequently Asked Questions
The current price of S&P 500 E-mini Futures is 6,368.00 USD — it has risen 0.04% in the past 24 hours. Watch S&P 500 E-mini Futures price in more detail on the chart.
The volume of S&P 500 E-mini Futures is 568.12 K. Track more important stats on the S&P 500 E-mini Futures chart.
Open interest is the number of contracts held by traders in active positions — they're not closed or expired. For S&P 500 E-mini Futures this number is 1.91 M. You can use it to track a prevailing market trend and adjust your own strategy: declining open interest for S&P 500 E-mini Futures shows that traders are closing their positions, which means a weakening trend.
Buying or selling futures contracts depends on many factors: season, underlying commodity, your own trading strategy. So mostly it's up to you, but if you look for some certain calculations to take into account, you can study technical analysis for S&P 500 E-mini Futures. Today its technical rating is strong buy, but remember that market conditions change all the time, so it's always crucial to do your own research. See more of S&P 500 E-mini Futures technicals for a more comprehensive analysis.