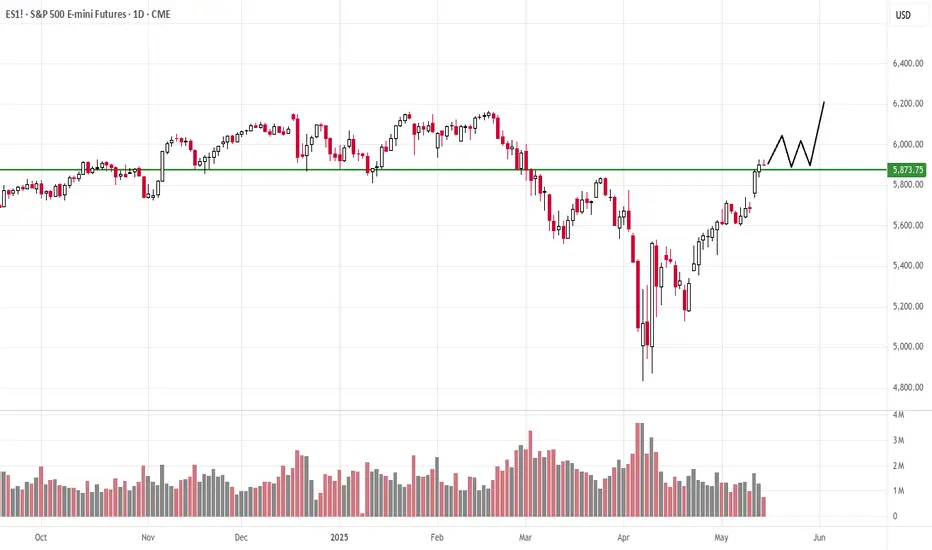
Bearish Divergence. Pullback Pending Bullish long term on S&P of course. This idea is shorter term only and I am not even taking a position. Developed bear div on a full week scale. I think a decent pullback will happen over the next week or couple weeks. Then we resume bigger picture upward movement
ESZ2018 trade ideas

Intraday Playbook ES Futures: Trade Setup & Context CME_MINI:ES1!
Big Picture Context
Please see related trade idea.
In this analysis, we refine our intraday levels to identify potential trade setups. We also review recent price action and present a high-probability long trade example that frequently offers favorable risk-reward dynamics when it plays out successfully.
See chart image below reviewing yesterday’s long trade opportunity.
Example Trade Setup: SFP Long
Time frame: 1 hour or 30 mins
• Entry: 5612
• Stop: 5595.50 (below SFP candle)
• Target: 5682 (mCVAH — confluence with recent highs)
• Risk: 66 ticks
• Reward: 280 ticks
• Risk/Reward Ratio: 4.2 R
Note: Past performance is not indicative of future results.
________________________________________
Intraday Market Structure Review
What has the market done?
• ES Futures have rallied and reclaimed a key technical level.
• Currently trading above:
o March 2025 low
o 2025 mid-year level
o Developing Value Area Low (VAL) for the 2025 Volume Profile
What is the market trying to do?
• Recover prior months' losses.
• Price action is climbing steadily, establishing higher lows.
How well is it doing?
• Despite headline risks, ES futures show resilience.
• Price has painted green candles in the full session for the past 10 consecutive days—a strong bullish structure.
________________________________________
What Is More Likely to Happen from Here?
Scenario 1: Pullback and Continuation Higher
A pullback toward the 0.618 Fib retracement and mCVAH confluence could offer another long setup, targeting the April 2nd high. This is further supported by NQ already reclaiming those highs, with ES still lagging but showing strength.
Example Trade Idea:
Time frame: 1 hour or 30 mins
• Entry: 5688
• Stop: 5680
• Target: 5724 (May 2 High)
• Risk: 32 ticks
• Reward: 144 ticks
• Risk/Reward Ratio: 4.5 R
Target may be adjusted if relative volume and delta support strong momentum toward April 2nd highs.
________________________________________
Scenario 2: Further Consolidation
• Sellers push prices back into last week's balance/value area.
• Market consolidates and builds energy for a likely next leg higher.
• No short setup is presented, as current risk and stop placement do not justify initiating short positions.
Important Notes:
• These are example trade ideas not intended to be a recommendation to trade, and traders are encouraged to do their own analysis and preparation before entering any positions.
• Stop losses are not guaranteed to trigger at specified levels, and actual losses may exceed predetermined stop levels.

How to Manage Slippage on TradingViewThis tutorial explains what slippage is and how it relates to market and limit orders as well as times when you might expect higher than normal slippage.
Disclaimer:
There is a substantial risk of loss in futures trading. Past performance is not indicative of future results. Please trade only with risk capital. We are not responsible for any third-party links, comments, or content shared on TradingView. Any opinions, links, or messages posted by users on TradingView do not represent our views or recommendations. Please exercise your own judgment and due diligence when engaging with any external content or user commentary.
Stop-loss orders are submitted as market orders and may be executed at prices significantly different from the intended stop level, particularly during periods of high volatility or limited liquidity. Stop-limit orders carry the risk of not being executed at all if the market does not reach the limit price. It is important to understand that neither type of order guarantees execution at a specific price. Market conditions can change rapidly due to scheduled or unexpected news events, and even quiet markets may experience sudden disruptions. These factors can affect trade execution in ways that may not be predictable or controllable.

ES - Day Trading Analysis With Volume ProfileOn ES , it's nice to see a strong buying reaction at the price of 5684.
There's a significant accumulation of contracts in this area, indicating strong buyer interest. I believe that buyers who entered at this level will defend their long positions. If the price returns to this area, strong buyers will likely push the market up again.
(FVG) - Fair Value GAP and high volume cluster are the main reasons for my decision to go long on this trade.
Happy trading
Dale

S&P 500 | Blue Box as Margin of SafetyWhen the index returns to the blue box, it reaches a zone forged by genuine buying interest and technical alignment. In a disciplined, data‑driven approach, this area serves as our first line of defense.
Why It Matters
• Past reactions show price pauses and reversals here, revealing real demand.
• It coincides with key footprint volume clusters where buyers have stepped in.
Entry Criteria
Higher‑Time‑Frame Stability
Confirm price holds within or above the blue box before considering a position.
Lower‑Time‑Frame Confirmation
Wait for clear breakouts or higher‑lows on short‑term charts backed by rising footprint volume.
Strict Risk Control
If price breaks through without retest or volume support, stand aside and seek a clearer setup.
By treating the blue box as our margin of safety and relying on actual volume footprint data, we trade with prudence and let the market’s real signals guide our decisions.
📌I keep my charts clean and simple because I believe clarity leads to better decisions.
📌My approach is built on years of experience and a solid track record. I don’t claim to know it all but I’m confident in my ability to spot high-probability setups.
📌If you would like to learn how to use the heatmap, cumulative volume delta and volume footprint techniques that I use below to determine very accurate demand regions, you can send me a private message. I help anyone who wants it completely free of charge.
🔑I have a long list of my proven technique below:
🎯 ZENUSDT.P: Patience & Profitability | %230 Reaction from the Sniper Entry
🐶 DOGEUSDT.P: Next Move
🎨 RENDERUSDT.P: Opportunity of the Month
💎 ETHUSDT.P: Where to Retrace
🟢 BNBUSDT.P: Potential Surge
📊 BTC Dominance: Reaction Zone
🌊 WAVESUSDT.P: Demand Zone Potential
🟣 UNIUSDT.P: Long-Term Trade
🔵 XRPUSDT.P: Entry Zones
🔗 LINKUSDT.P: Follow The River
📈 BTCUSDT.P: Two Key Demand Zones
🟩 POLUSDT: Bullish Momentum
🌟 PENDLEUSDT.P: Where Opportunity Meets Precision
🔥 BTCUSDT.P: Liquidation of Highly Leveraged Longs
🌊 SOLUSDT.P: SOL's Dip - Your Opportunity
🐸 1000PEPEUSDT.P: Prime Bounce Zone Unlocked
🚀 ETHUSDT.P: Set to Explode - Don't Miss This Game Changer
🤖 IQUSDT: Smart Plan
⚡️ PONDUSDT: A Trade Not Taken Is Better Than a Losing One
💼 STMXUSDT: 2 Buying Areas
🐢 TURBOUSDT: Buy Zones and Buyer Presence
🌍 ICPUSDT.P: Massive Upside Potential | Check the Trade Update For Seeing Results
🟠 IDEXUSDT: Spot Buy Area | %26 Profit if You Trade with MSB
📌 USUALUSDT: Buyers Are Active + %70 Profit in Total
🌟 FORTHUSDT: Sniper Entry +%26 Reaction
🐳 QKCUSDT: Sniper Entry +%57 Reaction
📊 BTC.D: Retest of Key Area Highly Likely
📊 XNOUSDT %80 Reaction with a Simple Blue Box!
📊 BELUSDT Amazing %120 Reaction!
📊 Simple Red Box, Extraordinary Results
I stopped adding to the list because it's kinda tiring to add 5-10 charts in every move but you can check my profile and see that it goes on..

Time to short MES (S&P500) - CRASH in comingThe assumptions are:
1) The economy is slowing down. Employment data will show it shortly and convincingly. Therefore a summer or fall crash is very likely.
2) The top for S&P 500 is already in. There is always the possibility for a melt up before the crash but I think the melt up has already occured.
3) The next drop will fall below the 2022 low and above or near the covid low.
4) This is obviously not going to be as clean as depicted but the drop is going to be fast and between 40 to 50% from the 2024 top.
5) This is a swing trade over a 6 months to 18 months timeframe.
6) Trump is going to keep messing with the tariffs until the damage to the economy takes a very long time to recover. Markets will discount this at a higher interest rate which will be very harsh for the markets.
I am starting to take positions now and will add if it moves up.

S&P 500, is a return to the all-time high reliable?Introduction: The equity market has been on a bullish upswing since mid-April (we invite you to reread our bearish analysis of the VIX at the end of April), against a backdrop of trade diplomacy, particularly between China and the USA. Now that the S&P 500 index has returned to equilibrium since the start of the year (i.e., its annual performance is no longer negative), is it credible from a fundamental and technical point of view to expect the equity market to move towards its all-time record in the coming weeks?
1) A trade appeasement that forged the bullish rally
The United States and China have announced a temporary cut in their respective tariffs, marking a major de-escalation in their trade war. Since May 14, Washington has reduced its taxes on Chinese products from 145% to 30%, including those on fentanyl, while Beijing has lowered its duties from 125% to 10%. This agreement offers a 90-day period in which to pursue negotiations, with no guarantee of success, but with the aim of avoiding a return to tariff increases in the short term.
This truce had an immediate effect on the markets: US equities rebounded strongly, while China suspended certain retaliatory measures, notably on rare earths. On the other hand, the surtaxes put in place during Trump's first term remain in place. Both countries wish to avoid a total economic breakdown, even if the United States maintains a policy of protection in sectors deemed strategic (semi-conductors, steel, pharmaceuticals).
The United States wants to reduce its trade deficit with Beijing, and has hinted that the truce could be extended if dialogue remains constructive. This episode is a reminder, however, that relations remain tense and that a truly comprehensive agreement will take time to materialize, just like the first trade war over the years 2018/2019. Despite everything, appeasement and trade diplomacy appear to be convincing fundamental factors for considering erasing the losses of last March/April's bearish shock. But it will take more in terms of fundamentals to consider surpassing the S&P 500's all-time record, which currently stands at 6166 points on the future contract.
2) Corporate profit forecasts remain optimistic
Of all the fundamental factors driving equity market trends, there is one that has a dominant influence: corporate profit forecasts.
Below, you can see two charts that illustrate the continued marked optimism regarding profit expectations of the companies that make up the S&P500 index. Successful trade diplomacy is essential to sustain these optimistic expectations and enable the S&P500 to return to its all-time high.
3) Reaching the all-time high on the S&P 500 is credible according to technical analysis of the financial markets
The technical rally in the S&P 500 future contract originated close to the major support at 4800 points, the former all-time high for the year 2021 and chartist guarantor of the underlying uptrend.
The rebound has taken the form of a “V-shaped trough” chart configuration, with a bullish gap recently opened in daily data and the 200-day moving average (in dark blue on the chart below, which displays daily Japanese candlesticks).
Technical analysis suggests that the market can continue to trend towards its all-time record as long as the 5700/5800 chart support is preserved. A breach of this support level on a daily closing basis would invalidate this market view.
DISCLAIMER:
This content is intended for individuals who are familiar with financial markets and instruments and is for information purposes only. The presented idea (including market commentary, market data and observations) is not a work product of any research department of Swissquote or its affiliates. This material is intended to highlight market action and does not constitute investment, legal or tax advice. If you are a retail investor or lack experience in trading complex financial products, it is advisable to seek professional advice from licensed advisor before making any financial decisions.
This content is not intended to manipulate the market or encourage any specific financial behavior.
Swissquote makes no representation or warranty as to the quality, completeness, accuracy, comprehensiveness or non-infringement of such content. The views expressed are those of the consultant and are provided for educational purposes only. Any information provided relating to a product or market should not be construed as recommending an investment strategy or transaction. Past performance is not a guarantee of future results.
Swissquote and its employees and representatives shall in no event be held liable for any damages or losses arising directly or indirectly from decisions made on the basis of this content.
The use of any third-party brands or trademarks is for information only and does not imply endorsement by Swissquote, or that the trademark owner has authorised Swissquote to promote its products or services.
Swissquote is the marketing brand for the activities of Swissquote Bank Ltd (Switzerland) regulated by FINMA, Swissquote Capital Markets Limited regulated by CySEC (Cyprus), Swissquote Bank Europe SA (Luxembourg) regulated by the CSSF, Swissquote Ltd (UK) regulated by the FCA, Swissquote Financial Services (Malta) Ltd regulated by the Malta Financial Services Authority, Swissquote MEA Ltd. (UAE) regulated by the Dubai Financial Services Authority, Swissquote Pte Ltd (Singapore) regulated by the Monetary Authority of Singapore, Swissquote Asia Limited (Hong Kong) licensed by the Hong Kong Securities and Futures Commission (SFC) and Swissquote South Africa (Pty) Ltd supervised by the FSCA.
Products and services of Swissquote are only intended for those permitted to receive them under local law.
All investments carry a degree of risk. The risk of loss in trading or holding financial instruments can be substantial. The value of financial instruments, including but not limited to stocks, bonds, cryptocurrencies, and other assets, can fluctuate both upwards and downwards. There is a significant risk of financial loss when buying, selling, holding, staking, or investing in these instruments. SQBE makes no recommendations regarding any specific investment, transaction, or the use of any particular investment strategy.
CFDs are complex instruments and come with a high risk of losing money rapidly due to leverage. The vast majority of retail client accounts suffer capital losses when trading in CFDs. You should consider whether you understand how CFDs work and whether you can afford to take the high risk of losing your money.
Digital Assets are unregulated in most countries and consumer protection rules may not apply. As highly volatile speculative investments, Digital Assets are not suitable for investors without a high-risk tolerance. Make sure you understand each Digital Asset before you trade.
Cryptocurrencies are not considered legal tender in some jurisdictions and are subject to regulatory uncertainties.
The use of Internet-based systems can involve high risks, including, but not limited to, fraud, cyber-attacks, network and communication failures, as well as identity theft and phishing attacks related to crypto-assets.

Sideways marketThe structure in the S&P 500 daily chart implies the set up for a sideways market for Thursday's action. It's important to remember that PPI and retail sales will be announced on Thursday and could add volatility to this market.

Can upside momentum be maintained?Can the upside momentum be maintained in the daily chart on the S&P 500? The momentum does continue at a respectable pace to the upside and was fundamental support the expectation is to see new highs on Wednesday. The upside objective is 5970.

How to Set Up and Use OCO Orders on TradingViewThis tutorial video explains what OCO (Order cancels orders) are, how they work, how to place them in Tradingview, and how they relate to bracket orders.
You'll learn how to add them to new entry orders as well as existing positions.
There is a substantial risk of loss in futures trading. Past performance is not indicative of future results. Please trade only with risk capital. We are not responsible for any third-party links, comments, or content shared on TradingView. Any opinions, links, or messages posted by users on TradingView do not represent our views or recommendations. Please exercise your own judgment and due diligence when engaging with any external content or user commentary.

AMP Futures - How to use the data windowIn this idea we will show you how to access pin point data information for specific areas on your chart using Tradingview.

How to Use Drawing Tools on TradingViewThis tutorial video discusses why and how traders use different types of trading tools, how to access the trading tools in Tradingview, and a few examples of how and why you might apply them.
Learn more about using Tradingview to trade futures with Optimus Futures:
optimusfutures.com
Disclaimer: There is a substantial risk of loss in futures trading. Past performance is not indicative of future results. Please trade only with risk capital. We are not responsible for any third-party links, comments, or content shared on TradingView. Any opinions, links, or messages posted by users on TradingView do not represent our views or recommendations. Please exercise your own judgment and due diligence when engaging with any external content or user commentary.

S&P 500 Technical Analysis: Testing the Axis LineThe S&P is now reaching the axis line, where heavy selling emerged months ago. It’s reasonable to expect a pause at this level, followed by a continuation of the strong uptrend.
Volume Analysis
Looking at the recent chart pattern, we can observe that the volume became quite climactic right on the break. It’s particularly noteworthy that the current bar is at the same level as previous significant price action. This pattern suggests we’re essentially going through the same cycle again, repeating familiar market behavior.
The Critical Axis Line
This axis line is critical for traders to monitor. If the market can successfully break above this level and then consolidate, spending sufficient time above this resistance, we’re likely going to experience a rally.
Chart Pattern Observations
The chart shows several technical elements:
Multiple touch points along the resistance level
Previous price action at similar levels
The market cycling through similar patterns again
Conclusion
The S&P is at a critical juncture, testing a well-established axis line. If we can get above it and then just consolidate, spending some time there, we’re probably going to have a rally.
How to Set Up Multi-Timeframe Analysis (MTF) in TradingViewThis tutorial video explains what a time frame is, why traders use multiple time frames for their analysis, and how to set them up in TradingView for futures and other products.
Disclaimer:
There is a substantial risk of loss in futures trading. Past performance is not indicative of future results. Please trade only with risk capital. We are not responsible for any third-party links, comments, or content shared on TradingView. Any opinions, links, or messages posted by users on TradingView do not represent our views or recommendations. Please exercise your own judgment and due diligence when engaging with any external content or user commentary.

Liberation, Altercation & Boom: US China Trade talks CME_MINI:ES1!
Pointing to our previously written blog post (Liberation, Altercation or Doom) on March 31st. A mix of all scenarios played out.
Global universal tariffs with reciprocal tariffs layered on top. It resulted in a huge sell-off on April 2nd.
After months of tit-for-tat tariffs and growing economic friction, the US and China have agreed to hit pause. In a joint statement that’s given markets some breathing room, both countries announced a 90-day suspension on a large portion of their punitive tariffs—an initial step toward dialing back tensions and restarting dialogue.
Key Tariff Measures from US-China Joint Statement (90-Day Pause)
US Tariff Reductions:
Tariffs on Chinese goods were reduced from 145% to 30% for a 90-day period.
24 percentage points suspended, leaving a 10% base tariff in place.
China Tariff Reductions:
Tariffs on US goods reduced from 125% to 10% for the same 90-day period.
China also suspends 24 percentage points of additional ad valorem duties.
Retains a 10% baseline tariff on US imports.
Non-Tariff Measures: China to suspend or remove all non-tariff countermeasures imposed since April 2.
Includes sanctions on certain US companies.
Lifts export controls on some critical minerals.
Timeline & Commitment:
Both parties agree to implement these actions by May 14.
Commitment to continue trade and economic talks through a new bilateral mechanism.
Talks may be held in alternating locations (US/China) or via third-party venues.
No Agreement On:
Currency policy.
E-commerce “de minimis” exemptions.
Sector-specific tariff frameworks.
Future Key Dates and Timeline:
May - Potential US semiconductor tariffs.
May/June - Potential US pharmaceutical tariffs.
July 8th - 90-day tariff lowering for "worst offenders" expires.
July 14th - US tariffs on Mexican agriculture goes into effect.
August 10th - US-China tariff relief expires.
Was this really mutual or just a game of chicken?
There’s an argument to be made that this is more of a tactical pause than a full reconciliation. With China’s GDP in purchasing power parity terms now surpassing that of the US, and its continued technological advancements across sectors like aerospace, semiconductors, and critical minerals, the balance of economic leverage is shifting. For investors, this isn’t just about tariffs—it’s about the evolving structure of global trade.
Geopolitical undercurrents continue to shape the backdrop. China’s strategic influence in regional security, technology supply chains, and commodity access adds another layer to its negotiating position. Recent developments—such as China's reassertion of dominance in strategic corridors and growing control over key mineral exports—suggest its economic posture is becoming more assertive. This, in turn, has implications for US firms dependent on Chinese inputs or facing retaliatory restrictions.
In short, the 90-day window presents a tactical opportunity, but the structural story remains complex. Investors would be wise to monitor not just tariff updates, but broader shifts in trade alliances, export controls, and supply chain vulnerabilities—especially in sectors like tech, energy, and defense-adjacent industries.
ES Futures:
ES Futures and risk on assets are positive across the board following this announcement.
Key Levels:
Key LVN/ Key LIS: 5861-5837.25
200 Day MA: 5872.99
0.786 Fib Retracement level: 5921.75
0.618 Fib Retracement level: 5688.75
pWkHi: 5741
mCVAL 2025: 5639.75
Expectations for the week ahead:
US CPI and Retail Sales data on the docket this week along with slew of FED speakers.
Scenario 1: Risk on
ES Futures get back above 200-day moving average clearing the key LVN resistance zone and our key LIS, head towards 0.786 Fib retracement level before pulling back and consolidating for the remainder of the week.
Example trade:
Entry: 5861
Stop: 5837
Target: 5921.75
Risk: 96 ticks
Reward: 243 ticks
Risk/Reward ratio: 2.5 R
Scenario 2: Further consolidation
Markets consolidate below the key LVN resistance zone and prior weekly high.
Example Trade:
Entry: 5837
Stop: 5861
Target: 5741
Risk: 96 ticks
Reward: 384 ticks
Risk/Reward ratio: 4 R
Glossary:
VA: Value Area
VPOC: Volume Point of Control
VAL: Value Area Low
C: Composite (used as a prefix: VA, VAL, VAH, VPOC, etc.)
mC: micro Composite (used as a prefix: mCVA, mCVAL, etc.)
LNV: Low Volume Node
LIS: Line in Sand
Important Notes:
These are example trade ideas not intended to be a recommendation to trade, and traders are encouraged to do their own analysis and preparation before entering any positions.
Stop losses are not guaranteed to trigger at specified levels, and actual losses may exceed predetermined stop levels.

phantom buyers = phantom sup es up +150 pts higher than last print on di+ for the month of may.
appreciate the risk.
___
n200 @ 5818
interim r1 on 1d @ 5994 s1 @ 5921
bearish below 5994
macro r1 on 1w @ 6040 r2 @ 6049
bearish below 6049
macro s1 on 1d @ 5586 s2 @ 5451
bullish above 5451

ES: Testing Yearly Open at 5950
Current Market Structure
Market completed successful retest of 2024 value area low (~20% correction from ATH)
We are currently engaged in value discovery journey back toward developing POC near ATH
Yearly open at ~5950 serves as current battleground level.
Friday's Action Analysis
Multiple rotations between yearly open (5950) and value area low (5925-5930)
Staying within and expanding above yesterdays upper distribution
Bulls eventually won the day, pushing +20 points to 5975
Key concern: Post-close liquidation break erased gains, returning to 5950
Suggests weak hands accumulated during the drift higher
Technical Structure Issues
White House announcement-driven moves created weak structure below current levels
Multiple unfilled gaps and single prints underneath
Weekly & Monthly VPOCs (virgin points of control) present structural vulnerabilities
Path of least resistance technically up, but lacking conviction
While the path of least resistance is upward, we really don't have a lot of people looking to start new positions here. Unless other timeframe traders come in and start finding value, we're just going to chop around. The market wants to get back to that POC near the highs, but it's getting artificial help every time we hit a pivotal point which is creating weak structure underneath us.

ES1! (S&P500 Mini Futures) - Support Trendline Price Test -DailyES1! (S&P500 Mini Futures) price is currently testing a support trendline around $5900.
If several daily Price candles close below $5865 this month, a pullback in the price can occur (rising wedge pattern).
Volume has been decreasing in May 2025, compared to March and April.
Finance and Technology corporate earnings season has passed. The U.S. government 90-day tariff pause is set to expire in early July (pending trade deal negotiations with other countries).
Tariff and trade deal news, breaking news, corporate earnings, government law changes, consumer sentiment, inflation data, the FOMC, and presidential announcements can all affect the prices of stocks and ETFs.

Buyers Stand By And Be Ready! In this Weekly Market Forecast, we will analyze the S&P 500, NASDAQ, DOW JONES, Gold and Silver futures, for the week of May 18 - 24th.
The Stock Indices remain bullish. So buys are warranted for next week.
Gold and Silver pulled back last week on news of Trump's deals and sanction relief. But Gold is at support now. Watch for bullish setups for buys or a bearish market structure shift before seeking sells.
Crude Oil is near buy side liquidity. Look for short term buys before a longer term, high probability sell setup to form.
Enjoy!
May profits be upon you.
Leave any questions or comments in the comment section.
I appreciate any feedback from my viewers!
Like and/or subscribe if you want more accurate analysis.
Thank you so much!
Disclaimer:
I do not provide personal investment advice and I am not a qualified licensed investment advisor.
All information found here, including any ideas, opinions, views, predictions, forecasts, commentaries, suggestions, expressed or implied herein, are for informational, entertainment or educational purposes only and should not be construed as personal investment advice. While the information provided is believed to be accurate, it may include errors or inaccuracies.
I will not and cannot be held liable for any actions you take as a result of anything you read here.
Conduct your own due diligence, or consult a licensed financial advisor or broker before making any and all investment decisions. Any investments, trades, speculations, or decisions made on the basis of any information found on this channel, expressed or implied herein, are committed at your own risk, financial or otherwise.

ES or SP500 Futures (Y25.P2.E1). Bullish macroHi Traders,
Some time back we called this out in our forum to go long and our anchored vwap approach was ideal.
All the best,
S.SAri

Long ESHere we go! Broke above our breakout line, came back and tested, rejected to the up side.
Bulls coming in. I want to see price hold above $5944 until London open which should bring us to our take profit at the $6000.
My mental SL is the breakout Line.

ES1! LongES1! is now net long on the regression break.
I ma considering my options this morning on the whole market.

Confident close.The S&P 500 on Friday had a confident close going into the weekend. The challenge will be follows through on Monday to maintain this momentum to the upside.
