ES Futures Weekly Summary — Bullish Bias into June 7, 2025📈 ES Futures Weekly Summary — Bullish Bias into June 7, 2025
🧠 Model Consensus Overview
Model Bias Strategy Entry SL TP Size Confidence
Grok/xAI Mod. Bullish Long 5,980 5,880 6,120 2 65%
Claude Mod. Bullish Long 5,979 5,850 6,100 1 72%
Llama Mod. Bullish Long 5,950 5,850 6,050 1 70%
Gemini Mod. Bullish Long 5,979 5,929 6,079 1 70%
DeepSeek Mod. Bullish Long 5,979 5,880 6,080 1 65%
✅ Trade Recommendation
📈 Direction: LONG ES Futures
🎯 Entry Price: 5,979.00 (market open)
🛑 Stop Loss: 5,880.00
🎯 Take Profit: 6,080.00
📏 Size: 1 Contract
📈 Confidence: 70%
⏰ Entry Timing: Market Open
🔍 Key Technicals
Price is above 20/50/200 SMAs on daily and intraday charts
RSI ~63–65 → Healthy but not yet overbought
MACD divergence or slowdown flagged as short-term caution
Near or at upper Bollinger Band = possible consolidation ahead
⚠️ Key Risks & Considerations
🧭 Bearish MACD crossover could trigger early pullback
🧊 Price at upper Bollinger band → short-term pause likely
🔀 Watch for volatility at open or index correlation breaks
📰 Unexpected macro news could shift bias
ES1! trade ideas

S&P 500: Coiling Tight as Bulls Eye 6000 BreakIf at first you don’t succeed, try, try again.
I suspect that’s what S&P 500 bulls are contemplating when it comes to clearing the psychologically important 6000 level in futures—although this time may meet with more success than when last tested in late May.
Coiling within an ascending triangle pattern, and with bullish momentum starting to flick higher again, the ducks are starting to line up for a possible topside break.
If the price can pierce 6000 and take out the May 29 high, consider establishing longs with a stop beneath 6000 for protection against reversal. Some resistance may be encountered at 6100, although the obvious target for bulls will be to take out the record high set in February.
Should the price be unable to clear 6000 and break uptrend support running from the May 23 low, it would favour range trade down to support at 5740.
Good luck!
DS

Support and Resistance Areas: 5879.75-5972.75
Hello, traders.
Please "Follow" to get the latest information quickly.
Have a nice day today.
-------------------------------------
(ES1! 1D chart)
There are two important support and resistance areas.
5879.75-5972.75 and 5664.75-5720.50 sections.
If it rises after receiving support near the 5879.75-5972.75 section, it is expected that the 6031.75-6051.50 section will act as resistance.
If it falls in the 5879.75-5972.75 section,
1st: 5664.75-5720.50
2nd: M-Signal indicator on the 1M chart
You should check whether there is support near the 1st and 2nd sections above.
-
Thank you for reading to the end.
I hope you have a successful trade.
--------------------------------------------------

06/02/25 Trade Journal, and Where is the Stock Market going tomo**EOD accountability report: +1176**
Sleep: 6 hours , Overall health: Health is getting better as I am getting a bit more rest, but can't seem to push past 6 hours of sleep. Might attempt to sleep earlier as i am usually heading to be around 1-2 am and waking up around 9. Also learned that I have pretty high cholesterol last week, so I plan to start implementing fiber pills into my night stack as it is essential to flooding out cholesterol.
**Should I release my daily supplement stack?**
What was my initial plan?
Bullish going into the market as we went over $5900, and looking for BTD at MOB, Flipped Bearish as we lost MOB.
**Daily Trade recap based on VX Algo System**
— 10:00 AM VXAlgo ES X3 Sell Signal
— 10:30 AM Market Structure flipped bearish on VX Algo X3!
— 11:26 AM VXAlgo YM X1 Sell Signal
— 2:00 PM VXAlgo NQ X3 Sell Signal
Next day plan--> Above 5900 = Bullish, Under 5880 = Bearish
Video Recaps -->https://www.tradingview.com/u/WallSt007/#published-charts

Weekly Market Forecast: Monday UPDATES!How accurate were the forecasts for S&P 500, NASDAQ, DOW JONES, Gold and Silver futures given in the Weekly Market Forecast for this week?
BULLSEYE!
Enjoy!
May profits be upon you.
Leave any questions or comments in the comment section.
I appreciate any feedback from my viewers!
Like and/or subscribe if you want more accurate analysis.
Thank you so much!
Disclaimer:
I do not provide personal investment advice and I am not a qualified licensed investment advisor.
All information found here, including any ideas, opinions, views, predictions, forecasts, commentaries, suggestions, expressed or implied herein, are for informational, entertainment or educational purposes only and should not be construed as personal investment advice. While the information provided is believed to be accurate, it may include errors or inaccuracies.
I will not and cannot be held liable for any actions you take as a result of anything you read here.
Conduct your own due diligence, or consult a licensed financial advisor or broker before making any and all investment decisions. Any investments, trades, speculations, or decisions made on the basis of any information found on this channel, expressed or implied herein, are committed at your own risk, financial or otherwise.

Anxiety marketThe global tension has created a high level of anxiety in the markets which results in an increase in volatility. Buyers are present in the S&P 500 but can they get a close above 5980 the next objective to the upside.

ES - Day Trading Analysis With Volume ProfileOn ES , it's nice to see a strong sell-off from the price of 5989. It's also encouraging to observe a strong volume area where a lot of contracts are accumulated.
I believe that sellers from this area will defend their short positions. When the price returns to this area, strong sellers will push the market down again.
Fair Value GAP (FVG) and Volume cluster are the main reasons for my decision to go short on this trade.
Happy trading,
Dale

Understanding VWAP In TradingWhat is VWAP?
VWAP is a price benchmark that gives more importance to prices where higher trading volume occurs. Unlike simple moving averages, which treat each price point equally, VWAP provides a volume-weighted perspective, making it more representative of market activity.
Traders use VWAP to gauge market trends, confirm trade entries and exits, and measure the quality of executions relative to the market's liquidity.
How Institutional Traders Use VWAP
Large financial institutions and mutual funds execute large orders over time to minimize their market impact.
VWAP helps them:
Achieve better execution by ensuring their orders are filled at a price close to the session's average.
Reduce market impact by avoiding aggressive buying or selling at extreme price points.
Gauge liquidity and time their orders efficiently.
Role of VWAP in Algorithmic Trading
VWAP is integral to algorithmic trading strategies that automate order execution.
Algorithms use VWAP in:
VWAP Trading Strategies: Algorithms execute orders in line with VWAP to avoid moving the market.
Mean Reversion Trading: Traders look for deviations from VWAP, buying when the price is below and selling when it is above.
Liquidity-Based Order Execution: Algorithms track VWAP to execute trades more efficiently, particularly in high-frequency trading (HFT).
Why VWAP is a Critical Benchmark for Intraday Traders
For short-term traders, VWAP provides key insights into market behavior:
Trend Confirmation: If the price is above VWAP, it indicates bullish sentiment; below VWAP suggests bearish conditions.
Entry and Exit Points: Traders use VWAP as support/resistance for trade decisions.
Institutional Footprint: Retail traders track VWAP to understand where large orders might be executing.
Since VWAP resets daily, it remains a highly relevant indicator for gauging intraday momentum and trend strength.
Calculation
Where:
Price = (High + Low + Close) / 3 (Typical Price for each period)
Volume = The total number of shares/contracts traded in the period
Understanding How VWAP is Calculated:
Calculate the Typical Price (TP): TP=High+Low+Close/3
Multiply TP by Volume for each time period to get the Cumulative Price-Volume product.
Sum the Price-Volume values cumulatively throughout the day.
Divide by the cumulative volume up to that time.
Since VWAP is cumulative from the market open, it resets at the start of each trading day.
Difference Between VWAP and Moving Averages
VWAP
Volume-weighted
Resets daily
Determines fair value in a session
Reacts to volume spikes
Moving Averages (SMA/EMA)
Equal-weighted (SMA) or Exponentially weighted (EMA)
Continuous across multiple sessions
Identifies overall trend direction
Reacts to price changes
How to Interpret VWAP
When the price is above VWAP: It suggests that the market is in an uptrend, and VWAP may act as support if the price retraces.
When the price is below VWAP: It signals a downtrend, and VWAP may act as resistance if the price attempts to rise.
Reclaiming VWAP: If the price moves below VWAP but then breaks back above it, this could signal a bullish reversal. The opposite is true for a bearish scenario.
VWAP and Market Trend Identification
Uptrend: If the price remains consistently above VWAP and VWAP itself is sloping upward, the market is in an uptrend.
Downtrend: If the price stays below VWAP and VWAP is sloping downward, the market is in a downtrend.
Sideways Market: If the price oscillates around VWAP and VWAP remains flat, the market is range-bound.
VWAP Standard Deviations (Bands) and Their Significance
First Standard Deviation (VWAP ±1σ)
Represents a normal fluctuation around VWAP.
Prices bouncing within this range indicate balanced market activity.
Second Standard Deviation (VWAP ±2σ)
Suggests stronger price movement.
A move beyond this level may indicate an overbought (above VWAP) or oversold (below VWAP) condition.
Third Standard Deviation (VWAP ±3σ)
Extreme price movement; rarely sustained.
A reversion back toward VWAP is highly likely.
Misinterpreting VWAP Signals
Many traders assume that VWAP alone dictates market direction. However, simply being above or below VWAP does not automatically mean the market is bullish or bearish. Market structure, momentum, and external factors such as news events or institutional order flows must also be considered.
How to Avoid It?
Look for Confirmation: Use VWAP in combination with price action and other indicators, such as volume, market structure, and momentum oscillators (e.g., RSI or MACD).
Check the Trend of VWAP: If VWAP is sloping upward and price is above it, this signals strength. Conversely, a downward-sloping VWAP with price below it indicates weakness.
Observe Price Interaction with VWAP: If the price consistently bounces off VWAP and continues in the trend direction, it confirms its role as dynamic support or resistance. If the price frequently crosses VWAP back and forth without clear direction, it signals a choppy, range-bound market.
Strategies
VWAP Bounce
If the price pulls back to VWAP and holds, traders may look for a long entry (in an uptrend) or a short entry (in a downtrend).
Stop-loss orders are often placed slightly beyond VWAP in case of a trend reversal.
VWAP Breakout
If the price consolidates near VWAP and then breaks out strongly, traders may enter in the direction of the breakout.
A sustained break above VWAP signals strength, while a break below VWAP signals weakness.
VWAP as a Reversion Point
Traders monitor price deviations from VWAP. If the price moves too far from VWAP, a reversion trade back toward VWAP may be expected.
Key Takeaways
VWAP Represents Fair Value – It calculates the average price of a security, weighted by volume, giving traders insight into where most of the trading activity has occurred.
Intraday Benchmark – VWAP resets daily and is primarily used by intraday traders and institutions to assess whether prices are trading at a premium or discount.
Support and Resistance Tool – VWAP often acts as dynamic support in uptrends and resistance in downtrends, helping traders make entry and exit decisions.
Institutional Trading Guide – Large institutions use VWAP to execute orders efficiently, minimizing market impact and ensuring better fills.
VWAP vs. Moving Averages – Unlike moving averages, which continue across multiple sessions, VWAP is cumulative from the market open and resets each day.
Trend Confirmation – Price above a rising VWAP signals a strong uptrend, while price below a declining VWAP suggests a downtrend.
Avoid Over-Reliance – While useful, VWAP should be combined with volume analysis, price action, and other indicators to avoid false signals.
VWAP Bands for Overbought/Oversold Levels – Standard deviation bands around VWAP can help identify price extremes and potential mean reversion setups.
VWAP is more than just an average—it's the heartbeat of market sentiment, revealing where true liquidity and fair value align.
Stay sharp, stay ahead, and let’s make those moves. Until next time, happy trading!

S&P 500 – Projection to the SouthLooking at the market's behavior using the orange median line/fork, one can clearly see how the market reacts when it touches one of the lines.
Median lines/forks are not an oracle. They simply project the highest probable path of the price based on a mathematical calculation inherent to the tool.
If you follow the rule set, money management, and risk management, you have a wonderful framework that offers a significant advantage in trading the markets.
Let’s take a look at the current situation:
The orange fork:
– Price closes outside the fork (1)
– Multiple retests of the L-MLH (textbook behavior) (2)
– Break of the 1/4 line, heading toward the 1st warning line (3)
Next movement pattern according to the median line framework:
– Drop to the white centerline (4)
– Retest of the centerline (5)
– 1/4 line (6)
– Lower median line parallel (7) with a possible retest
– Orange centerline of the pendulum fork (8)
Wishing everyone a wonderful start to the week.

Super Over bought on Stochastics 2 min 5 min 15 minSuper Over bought on Stochastics 2 min 5 min 15 min, waited for price to drop to a 1 hour support line, had a buy order just under that with confirmation from ALGO volume to get in there. Take profit just above at stop loss under where i entered. Great trade could have rid it longer

Weekly Market Forecast: Stocks, Gold, Silver & Crude OilIn this Weekly Market Forecast, we will analyze the S&P 500, NASDAQ, DOW JONES, Gold and Silver futures, for the week of June 2 - 6th.
Stock Indices are looking more bullish than bearish. Valid buys only!
Gold is moving sideways. Wait for confirmation before a buy/sell signal.
Oil prices may tick lower. Trade carefully.
Enjoy!
May profits be upon you.
Leave any questions or comments in the comment section.
I appreciate any feedback from my viewers!
Like and/or subscribe if you want more accurate analysis.
Thank you so much!
Disclaimer:
I do not provide personal investment advice and I am not a qualified licensed investment advisor.
All information found here, including any ideas, opinions, views, predictions, forecasts, commentaries, suggestions, expressed or implied herein, are for informational, entertainment or educational purposes only and should not be construed as personal investment advice. While the information provided is believed to be accurate, it may include errors or inaccuracies.
I will not and cannot be held liable for any actions you take as a result of anything you read here.
Conduct your own due diligence, or consult a licensed financial advisor or broker before making any and all investment decisions. Any investments, trades, speculations, or decisions made on the basis of any information found on this channel, expressed or implied herein, are committed at your own risk, financial or otherwise.

#ES_F Weekly Prep 06.01 - 06.06.25Last week we have consolidated, built a cost basis under HTF Edge Top and made a push into new HTF Ranges Value on Wednesday after some news, we made it into the Mean of that range but failed to hold before the open trapping Supply in Value. Thursday held under the Edge and by Friday built up enough supply to flush Holiday Cost basis into lower Value where the selling stopped at the Mean and we started covering, being mid day Friday and End of Month we got strong enough covering to take us all the way back into the Edge/into current Intraday Ranges top which is around 930 - 25 Area.
Question for this week is, was that a strong bid on Friday which will give us a hold and continued pushes into above VAL over the Edge or was it just a retest of this Edge top from below, momentum traders pushed us out on news and now we are back inside 930 - 770s HTF Range ?
Looking at our structure, we had Trend Change on Thursday during RTH Open and for now we have closed Friday in downward correction Trend. This tells us that its possible that we have failed to accept inside new above HTF Range and if that is the case then we could target moves back down towards lower areas of VAH / Mean / VAL and if there will be volume moves under it.
For things to change and to see stability + strength out of here we would need to see a good push over 930s which could hold over AND see a move over 941 - 45 area, without that need to be careful with longs into those areas as our Supply and Sellers are around and over us.
Things have been slow and moves take a while to set up so Current Intraday Range could act as support and we can see price trade back and forth inside it with Holiday Cost basis providing Support, BUT if we do get through that under VAH then we can see further moves down towards Mean and VAL which has another cost basis there that we can try to fill out and it could hold the price around it, to see any more weakness from there we would need to find ourself under VAL and be able to get into that 800 Balance area, it is new Month and we do have Market Moving Data this week so it could happen.
If this will be the case good entry areas for continuation lower could be found around
914 - 10 // 900 - 896 // 869 - 65 // 855 - 51 careful around 824 - 20 and IF we attempt for move into lower Balance could find entries for it at 810 - 06
IF Trend does change and we hold over the Edge OR we hold Current Intraday Range and some of the weekly Data/News will push us over 941 - 45 then we could see moves into above VAL / Mean and would look for Entries around 955 - 59 // 986 - 90 if this will be the case need to be careful with looking for too much continuation over the Mean as there will be selling closer to above VAH we get and especially if we see pushes into/over it as there is more supply above, if move higher happens we would probably look to stay under 630 - 20s and If Holiday Cost Basis holds as Support the could also find long entries at 896 - 900 area after we hold under but need to be careful with looking for big moves and try to grab area to area as market moves and back fills very efficiently lately so watch out for back and forth trading while its moving towards targets.

Neutral zone trade environmentThe S&P 500 daily chart on Friday completes a neutral zone trade structure. This implies a sideways move on Monday to higher close.

S&P 500 Futures Stock Chart Fibonacci Analysis 053025Trading Idea
1) Find a FIBO slingshot
2) Check FIBO 61.80% level
3) Entry Point > 5929/61.80%
Chart time frame:A
A) 15 min(1W-3M)
B) 1 hr(3M-6M)
C) 4 hr(6M-1year)
D) 1 day(1-3years)
Stock progress: B
A) Keep rising over 61.80% resistance
B) 61.80% resistance
C) 61.80% support
D) Hit the bottom
E) Hit the top
Stocks rise as they rise from support and fall from resistance. Our goal is to find a low support point and enter. It can be referred to as buying at the pullback point. The pullback point can be found with a Fibonacci extension of 61.80%. This is a step to find entry level. 1) Find a triangle (Fibonacci Speed Fan Line) that connects the high (resistance) and low (support) points of the stock in progress, where it is continuously expressed as a Slingshot, 2) and create a Fibonacci extension level for the first rising wave from the start point of slingshot pattern.
When the current price goes over 61.80% level , that can be a good entry point, especially if the SMA 100 and 200 curves are gathered together at 61.80%, it is a very good entry point.
As a great help, tradingview provides these Fibonacci speed fan lines and extension levels with ease. So if you use the Fibonacci fan line, the extension level, and the SMA 100/200 curve well, you can find an entry point for the stock market. At least you have to enter at this low point to avoid trading failure, and if you are skilled at entering this low point, with fibonacci6180 technique, your reading skill to chart will be greatly improved.
If you want to do day trading, please set the time frame to 5 minutes or 15 minutes, and you will see many of the low point of rising stocks.
If want to prefer long term range trading, you can set the time frame to 1 hr or 1 day.

How to Read Market Depth in TradingViewThis tutorial video covers what Depth of Market (Market Depth) is, how to read it, and how traders might use it.
Learn more about trading futures with Optimus Futures using the TradingView platform here: optimusfutures.com/Platforms/TradingView.php
Disclaimer: There is a substantial risk of loss in futures trading. Past performance is not indicative of future results. Please trade only with risk capital. We are not responsible for any third-party links, comments, or content shared on TradingView. Any opinions, links, or messages posted by users on TradingView do not represent our views or recommendations. Please exercise your own judgment and due diligence when engaging with any external content or user commentary.
Order flow and DOM data reflect market participant activity but do not guarantee future price movement or execution certainty. These tools are best used as part of a broader trading strategy that includes risk management and market understanding.

FED, a hidden rate cut?1) Money supply at an all-time high: an apparent paradox given that the Fed is no longer lowering interest rates
The M2 money supply in the United States has just reached a new all-time high, even though the Federal Reserve has not lowered its key interest rate since December 2024. This may come as a surprise: how is such an influx of liquidity possible without explicit action by the Fed on rates? However, this phenomenon is providing strong support for risky assets, starting with the S&P 500 index, which has rebounded sharply since April. For the record, M2 includes immediately available liquidity in the economy: currency in circulation, demand deposits, time deposits, money market funds, and highly liquid assets. It is therefore a key indicator of the spending and investment capacity of economic agents.
This rebound in money supply comes against a backdrop of macroeconomic resilience in the United States: commercial bank lending is picking up again, the labor market remains strong, and wages continue to rise. At the same time, the long-term upward trend in US stock markets remains intact. All these factors are fueling endogenous monetary expansion, regardless of immediate monetary policy decisions on interest rates. This strong return of liquidity is in turn fueling the markets, creating a self-reinforcing loop between rising asset prices, economic confidence, and credit injection.
The chart below shows the overlap between US M2 money supply and the S&P 500 futures trend.
2) Implicit monetary easing: has the Fed already pivoted without saying so?
The main explanation for this monetary expansion lies in an implicit pivot by the Fed, not through the Fed Funds rate, but via two less visible but equally powerful channels: the RRP (Reverse Repo Facility) and QT (Quantitative Tightening).
On the one hand, use of the RRP program has been in free fall for several months. This tool allows money market funds to place their excess short-term liquidity with the Fed. When the RRP declines, it means that this liquidity returns to the financial system to be reinvested elsewhere (Treasury bills, money markets, risky assets). This simple shift in cash constitutes an implicit easing of monetary conditions, lowering real short-term rates and increasing the availability of capital.
On the other hand, the Fed has significantly slowed its quantitative tightening program. In May 2025, it lowered its monthly cap on Treasury reductions to just $5 billion (down from $25 billion previously). This amounts to slowing the contraction of its balance sheet, thereby removing less structural liquidity from the economy. The result: the two levers, less sterilization via the RRP and less contraction via QT, combine to form de facto monetary easing, without any official change in the key interest rate.
3) So what are the consequences for the S&P 500 index?
In this context, the rebound in the S&P 500 can be explained not only by the current phase of trade diplomacy but also by hidden monetary easing. From a technical analysis perspective, the S&P 500 futures contract remains in a medium-term uptrend as long as the major support level of 5700/5800 points is maintained.
DISCLAIMER:
This content is intended for individuals who are familiar with financial markets and instruments and is for information purposes only. The presented idea (including market commentary, market data and observations) is not a work product of any research department of Swissquote or its affiliates. This material is intended to highlight market action and does not constitute investment, legal or tax advice. If you are a retail investor or lack experience in trading complex financial products, it is advisable to seek professional advice from licensed advisor before making any financial decisions.
This content is not intended to manipulate the market or encourage any specific financial behavior.
Swissquote makes no representation or warranty as to the quality, completeness, accuracy, comprehensiveness or non-infringement of such content. The views expressed are those of the consultant and are provided for educational purposes only. Any information provided relating to a product or market should not be construed as recommending an investment strategy or transaction. Past performance is not a guarantee of future results.
Swissquote and its employees and representatives shall in no event be held liable for any damages or losses arising directly or indirectly from decisions made on the basis of this content.
The use of any third-party brands or trademarks is for information only and does not imply endorsement by Swissquote, or that the trademark owner has authorised Swissquote to promote its products or services.
Swissquote is the marketing brand for the activities of Swissquote Bank Ltd (Switzerland) regulated by FINMA, Swissquote Capital Markets Limited regulated by CySEC (Cyprus), Swissquote Bank Europe SA (Luxembourg) regulated by the CSSF, Swissquote Ltd (UK) regulated by the FCA, Swissquote Financial Services (Malta) Ltd regulated by the Malta Financial Services Authority, Swissquote MEA Ltd. (UAE) regulated by the Dubai Financial Services Authority, Swissquote Pte Ltd (Singapore) regulated by the Monetary Authority of Singapore, Swissquote Asia Limited (Hong Kong) licensed by the Hong Kong Securities and Futures Commission (SFC) and Swissquote South Africa (Pty) Ltd supervised by the FSCA.
Products and services of Swissquote are only intended for those permitted to receive them under local law.
All investments carry a degree of risk. The risk of loss in trading or holding financial instruments can be substantial. The value of financial instruments, including but not limited to stocks, bonds, cryptocurrencies, and other assets, can fluctuate both upwards and downwards. There is a significant risk of financial loss when buying, selling, holding, staking, or investing in these instruments. SQBE makes no recommendations regarding any specific investment, transaction, or the use of any particular investment strategy.
CFDs are complex instruments and come with a high risk of losing money rapidly due to leverage. The vast majority of retail client accounts suffer capital losses when trading in CFDs. You should consider whether you understand how CFDs work and whether you can afford to take the high risk of losing your money.
Digital Assets are unregulated in most countries and consumer protection rules may not apply. As highly volatile speculative investments, Digital Assets are not suitable for investors without a high-risk tolerance. Make sure you understand each Digital Asset before you trade.
Cryptocurrencies are not considered legal tender in some jurisdictions and are subject to regulatory uncertainties.
The use of Internet-based systems can involve high risks, including, but not limited to, fraud, cyber-attacks, network and communication failures, as well as identity theft and phishing attacks related to crypto-assets.

UncertaintyThe S&P 500 daily chart for Thursday reflects uncertainty. This structure implies a down day on Friday. We do have fundamentals that may change the markets attitude but right now sellers are present and further movement to the downside is expected

Bloodshed on the Streets.🔻 SPX500M | Potential Breakdown Alert
Timeframe: 15m | Contract: June 2025
We are watching a technical rejection at a key trendline, confirming a potential double top formation. Price failed to hold the ascending structure, suggesting a loss of bullish momentum.
📉 Bearish Confluences:
Clear break and retest of the rising trendline.
Multiple rejections near 5,925 — acting as a hard ceiling.
A visible liquidity gap below, likely to attract sell-side pressure.
Measured move points toward the gap fill target near 5,681.63.
🧠 If this level breaks decisively, it could confirm short-term bearish continuation. Keep an eye on volume and order flow near 5,875 – 5,850 to confirm participation.
⚠️ Risk: Rising volatility into early June with major macro data (jobs, ISM, Fed speak) potentially acting as a catalyst.
📍Strategy Suggestion:
Scalp shorts below 5,900 with risk above 5,930. Target the gap zone with trailing stops once momentum picks up.
💼 Post by WaverVanir International LLC – Applying discretionary strategy with macro + technical alignment.

Bull Are Still In PlayLooking at the last idea, this would be the structural plays that I am looking at for the intraday buys.
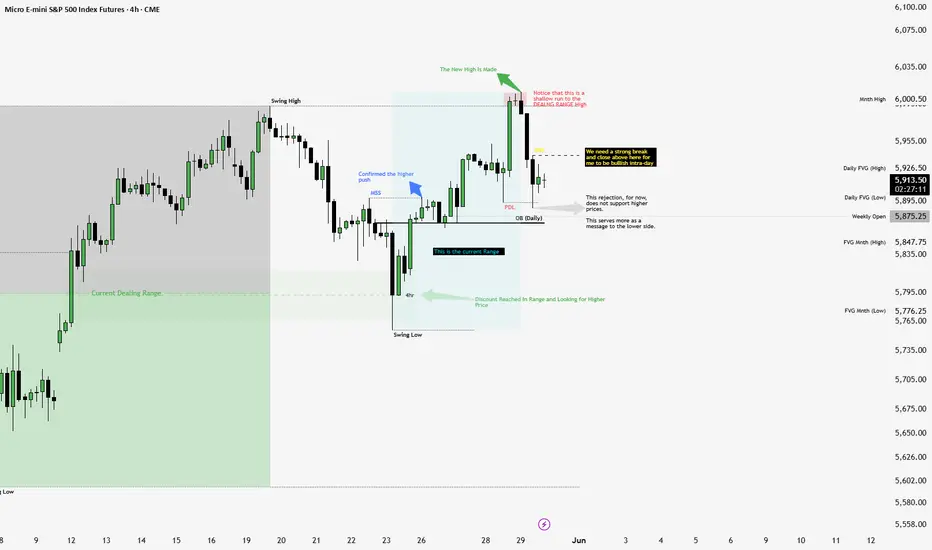
Bullish Bias, Patient Mindset — Here’s What I’m WatchingAlmost a month ago, we talked about a bullish setup — and that perspective hasn’t changed. I mentioned then that I was “slightly bullish but waiting for confirmation,” and the market has continued to respect that bias.
We're still on that train. 🚆
Take a walk with me as I break down the key areas I'm watching for bullish plays — not just for the next day or two, but looking out into the coming weeks and months. These are the zones I’m monitoring closely for entries, reactions, or potential shifts in structure.
Confirmation is everything. Momentum is building, but patience is how we stay on the right side of the trade.
Potential 2:1 SetUP foir a Swing Trade
Buy levels: : 5940
Aggressive entry: 5890 (One opportunity given today)
Passive entry: 5940 (waiting on price)
Take profit : New High : 6166
Stoploss : 5755


Markets Lower Ahead of Nvidia Earnings Equity Indices traded loEquity Indices traded lower on the session today after seeing strong gains yesterday to start the week with the Russell leading the downside pressure being down near 1%. The FOMC minutes were released this afternoon and showed that the Fed was comfortable with rates remaining unchanged for the time being, and equity markets fell while traders saw Bond Yields trade higher. Gold, Silver and Copper also saw losses on the session with Copper leading the selling pressure being down near 1.5%.
The big news today came after the bell with Nvidia reporting earnings, where they saw a beat on both EPS and Revenue, and the S&P and Nasdaq are seeing some after hours gains. There was news this afternoon as well where President Trump ordered US chip designers to stop selling software to China, which could have longer term effects on the global supply and demand. Looking ahead for the rest of the week, traders will see key economic data looking at jobs and GDP that can add volatility to the equity indices and outside markets like the precious metals or crypto markets.
If you have futures in your trading portfolio, you can check out on CME Group data plans available that suit your trading needs tradingview.com/cme/
*CME Group futures are not suitable for all investors and involve the risk of loss. Copyright © 2023 CME Group Inc.
**All examples in this report are hypothetical interpretations of situations and are used for explanation purposes only. The views in this report reflect solely those of the author and not necessarily those of CME Group or its affiliated institutions. This report and the information herein should not be considered investment advice or the results of actual market experience.

Down to go Up?Looking for demand at lower prices, in order to go up?
Or is this more downside? Thoughts Id like to go lower to tag a demand area, to then go higher into the day, use 3 screen approach
