Absorption dayAfter the S&P break to the downside on the daily chart, the expectation is that on Thursday the market will trade inside the range of Wednesday's action as the market absorbs what happened with fundamental comments on Wednesday. New bearish news could push the market lower but that is not expected for Thursday.
ES1! trade ideas

ES UpdateSame as NQ, indicators did not go oversold yet, but looks like the EUros set up for an ECB rate cut bump tomorrow morning. MFI might hit oversold premarket tomorrow.
Note that ES filled the NVDA gap but still has the original tariff gap above.

How To Connect Your NinjaTrader Account To TradingViewHow to connect your NinjaTrader brokerage account to be able to trade on TradingView.

SPY Futures April 2025Trump imposes new tariffs on imports from China, investors panic, and the market chops. A good level to look at on SPY Futures for the next couple weeks is 5528.00. I believe a break upwards can give bullish investors some confidence , while a rejection could bring even more downside. If we break upwards, possibly revisiting 5840.00, we're going to have to see if we can break that level and get back to the all time high. If we reject and price falls, the level to look at is 4833.00. A break of that support could mean a lot more downside in the coming months. But we're going to have to be patient allow Trump vs China to unfold.

April 15th Trade Journal & Stock Market AnalysisEOD accountability report: +940
Sleep: 8 hour, Overall health: Good
**Daily Trade Recap based on VX Algo System **
9:30 AM Market Structure flipped bullish on VX Algo X3! - easy money
10:10 AM VXAlgo ES X1 Sell Signal - easy money
1:02 PM Market Structure flipped bearish on VX Algo X3! - easy money
1:40 PM VXAlgo ES X1 Buy signal (triple signal) -a bit tuff but still work out
3:30 PM VXAlgo ES X1 Sell Signal (double signal) - a bit tuff but still work out
**Wed plan: ** Watch for 48M support or 195M support to tag around 5200-5300s.

Neutral zone marketThe structure in the S&P for the last couple days implies a neutral zone market. This means that both buyers and sellers are present with no one group being dominant. The expectation is for a sideways move until we get fundamental information primarily tariff information that will give the market an excuse to rally or break.

The stage is set for the markets next move! #SPX SP:SPX levels to watch!
4600-4800 must hold or we could see 3400-3500 as our next major area of support!
S&P 500 and Bitcoin are bearish. Big dump incoming.We bounced back thanks to Trump's bullish announcements but we're right back up at major resistance and we're moving sideways. With major resistance, you want to see price cut straight through like a laser. You don't want to see price hesitating. A bearish geometric pattern leading up to resistance almost always rejects and retests the lows.

Daily Price Action: Futures S&P500 Emini ES1! Tuesday 4/15/2025 In this video, we are looking into the potential daily price action of ES1!.

Has the S&P 500 bottomed out?A global stock market crash under pressure from the trade war
Since its all-time high last February, the S&P 500 has lost 20%, dragging all global equity markets into a general sell-off. This downward movement concerns not only the United States, but also the MSCI World index, confirming that a global aversion to risk has taken place. And unlike other periods of tension, this time there were no safe havens, except perhaps gold and certain bond segments. All sectors, even defensive ones, were affected.
The source of this intense pressure on the markets? The trade war waged by the Trump administration against over 70 countries, with China leading the retaliatory tariffs. This highly conflicted geopolitical context has rekindled fears of a global economic slowdown, hence the massive flight to liquidity.
The market is hoping for a PIVOT: but which one?
Faced with this situation, only one thing can reverse the trend: a PIVOT. In other words, a major policy change capable of reversing the current dynamics of the financial markets.
Two types of pivot are possible in the spring of 2025: that of the Federal Reserve (the FED) or that of the Trump administration.
The FED's pivot is a monetary reversal. This would involve the central bank lowering interest rates again and halting the reduction of its balance sheet - in other words, injecting more liquidity into the system. In fact, the FED already slowed the reduction of its balance sheet in April, a sign that it may be getting ready to move. Two key dates to watch: May 7 and June 18, the next monetary policy decisions.
But this pivot will depend on two essential conditions: the evolution of inflation and the unemployment rate. If these two variables warrant emergency support, the Fed could initiate the resumption of the federal funds rate cut.
Trump's pivot: tax and trade diplomacy
The other scenario is the Trump pivot. It rests on two pillars: trade diplomacy and fiscal policy. On the trade side, it would involve a return to the negotiating table, with the signing of agreements that would put an end to the spiral of customs sanctions. On the tax side, Trump continues to deploy a very marked pro-business strategy.
Already, his first term (2017-2021) had been marked by a massive reduction in corporate taxes (from 35% to 21%) and tax cuts for households via the Tax Cuts and Jobs Act. For this second term, starting in January 2025, Trump proposes to go even further with his “One Big Beautiful Bill” project: perpetuate the 2017 cuts, abolish taxes on tips, overtime, even pensions.
Above all, Trump is considering a 15% corporate tax cut, especially for industries that produce in the United States. This would be a major fiscal shock, which could boost growth expectations and thus... the equity markets.
Spring 2025 is a critical time window. The market can no longer afford to navigate uncertainty without a strong signal. Either the Fed will change its tone, or Trump will bend his economic and trade line. A pivot is essential if the S&P 500 is to validate a major market low.
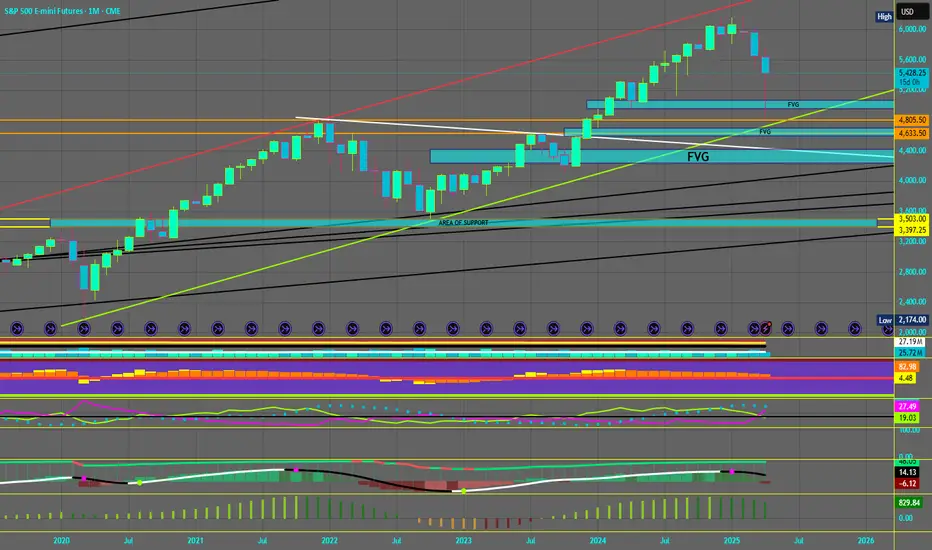
In terms of technical analysis of the financial markets, the S&P 500 index thus corrected by 20% before recovering last week close to the major technical support of 4800 points.
This major chartist support (see the chart of the S&P 500 future contract attached to this analysis) corresponds to the peak of the equity market at the end of 2021 and the starting point of the bear market in 2022, against the backdrop at the time of the Central Banks' commitment to fighting inflation.
This 4800-point level represents the guarantee of the uptrend initiated at the end of 2022. Note that this horizontal support is underpinned by a graphic uptrend line that joins all major market lows since the stock market shock of the health crisis.
Another factor reinforcing the strength of this support is the quantitative aspect, which describes an extreme oversold technical situation conducive to a low point. The percentage of S&P 500 shares above the 50-day moving average has fallen below 10%, a threshold that has seen market stabilizations for over 15 years.
The S&P 500 chart and the quantitative chart are attached to this analysis.
DISCLAIMER:
This content is intended for individuals who are familiar with financial markets and instruments and is for information purposes only. The presented idea (including market commentary, market data and observations) is not a work product of any research department of Swissquote or its affiliates. This material is intended to highlight market action and does not constitute investment, legal or tax advice. If you are a retail investor or lack experience in trading complex financial products, it is advisable to seek professional advice from licensed advisor before making any financial decisions.
This content is not intended to manipulate the market or encourage any specific financial behavior.
Swissquote makes no representation or warranty as to the quality, completeness, accuracy, comprehensiveness or non-infringement of such content. The views expressed are those of the consultant and are provided for educational purposes only. Any information provided relating to a product or market should not be construed as recommending an investment strategy or transaction. Past performance is not a guarantee of future results.
Swissquote and its employees and representatives shall in no event be held liable for any damages or losses arising directly or indirectly from decisions made on the basis of this content.
The use of any third-party brands or trademarks is for information only and does not imply endorsement by Swissquote, or that the trademark owner has authorised Swissquote to promote its products or services.
Swissquote is the marketing brand for the activities of Swissquote Bank Ltd (Switzerland) regulated by FINMA, Swissquote Capital Markets Limited regulated by CySEC (Cyprus), Swissquote Bank Europe SA (Luxembourg) regulated by the CSSF, Swissquote Ltd (UK) regulated by the FCA, Swissquote Financial Services (Malta) Ltd regulated by the Malta Financial Services Authority, Swissquote MEA Ltd. (UAE) regulated by the Dubai Financial Services Authority, Swissquote Pte Ltd (Singapore) regulated by the Monetary Authority of Singapore, Swissquote Asia Limited (Hong Kong) licensed by the Hong Kong Securities and Futures Commission (SFC) and Swissquote South Africa (Pty) Ltd supervised by the FSCA.
Products and services of Swissquote are only intended for those permitted to receive them under local law.
All investments carry a degree of risk. The risk of loss in trading or holding financial instruments can be substantial. The value of financial instruments, including but not limited to stocks, bonds, cryptocurrencies, and other assets, can fluctuate both upwards and downwards. There is a significant risk of financial loss when buying, selling, holding, staking, or investing in these instruments. SQBE makes no recommendations regarding any specific investment, transaction, or the use of any particular investment strategy.
CFDs are complex instruments and come with a high risk of losing money rapidly due to leverage. The vast majority of retail client accounts suffer capital losses when trading in CFDs. You should consider whether you understand how CFDs work and whether you can afford to take the high risk of losing your money.
Digital Assets are unregulated in most countries and consumer protection rules may not apply. As highly volatile speculative investments, Digital Assets are not suitable for investors without a high-risk tolerance. Make sure you understand each Digital Asset before you trade.
Cryptocurrencies are not considered legal tender in some jurisdictions and are subject to regulatory uncertainties.
The use of Internet-based systems can involve high risks, including, but not limited to, fraud, cyber-attacks, network and communication failures, as well as identity theft and phishing attacks related to crypto-assets.


S&P Daily RangeA hold above Prior Weekly Close can have us trade towards Prior Week High / Prior Daily Candle gap.
Failure to do so can trade back towards prior Intra-Week highs.
5400 for 5550
#decipherthealgo

April 14th Trade Journal & Market AnalysisApril 14th Trade Journal & Market Analysis
EOD accountability report: +565
Sleep: 6 hour, Overall health: recovering, cant seem to get over 6 hour sleep.
**Daily Trade Recap based on VX Algo System **
9:30 AM VXAlgo ES X1 Sell Signal (triple sell signal)
9:41 AM Market Structure flipped bearish on VX Algo X3
11:02 AM Market Structure flipped bullish on VX Algo X3!
12:20 PM VXAlgo ES X1 Buy signal (Triple buy signal)
2:11 PM Market Structure flipped bullish on VX Algo X3!
3:20 PM VXAlgo ES X1 Sell Signal (triple sell again)
Today traded inside the zone, tested the 10min MA from the other day, held very well and bounced strong.
Bot alerts were on fire today.
Tuesday plan: Look for a backtest to support again on 48 min and push up to the MOB.

ES 3hr UpdateNo idea what this market is doing, it wants the gap fill but can't figure out a way to get there, lol. It did fill the gap up from last night though.
Indicators are neutral, Powell speaks Wed, ECB meeting premarket Thu so I dumped my gold premarket today. Basically a wash trade, I wish I had figured out what was going on sooner. If ECB cuts rates, you'll see the EUro drop, which could cause a drop in gold in US dollars. Also, Euro gapped up last night which scared me, because that gap also needs to fill.
All cash, can't keep up with the news while I'm working. I saw automakers got an exemption though, lol.
We'll see a gap up Thu if ECB cuts rates, so staying cash, not shorting anything. I gotta fly out to WA to get my house ready for sale next week, might just take a break unless I see something.
WIth Trump in office, teh market is bound to go oversold again, might just wait until I sell my house before resuming trading. We'll see.

Neutral environmentThe S&P 500 daily chart structure implies a neutral environment and a sideways move as the market waits for additional tariff announcements this week.

ES/SPY Bottoming Process Gaining More ClarityThe George W Bush pattern still seems to be forming...taking the longer larger and more powerful form. Will the right lower part of the W take place above the lower left side, dead even or below. Certainly sentiment would lead us to believe it will be well below the left side. However, today failed to make a lower low. Selling may resume Sunday night/Monday morning or the double bottom retest may be complete....OR of course we can keep charging significantly lower.

Fibs to Watch For Traps - ES/MESNew fib channels to keep your eyes on for ES and levels I will be eyeing for the next few weeks or so.
ES - Day Trading Analysis With Volume ProfileOn ES , it's nice to see a strong buying reaction at the price of 5075.00.
There's a significant accumulation of contracts in this area, indicating strong buyer interest. I believe that buyers who entered at this level will defend their long positions. If the price returns to this area, strong buyers will likely push the market up again.
Uptrend and high volume cluster are the main reasons for my decision to go long on this trade.
Happy trading
Dale

SP500 Weekly Action Areas & Price Targets 14/04/25In this update we review the recent price action in the emini SP500 futures contract and identify high-probability trading opportunities and price targets for the trading week ahead. To review today's video analysis, click here!

AT - Net ProbabilityThe AT Indicator also shows candle-by-candle the evolution of Net Probabilites —i.e., the difference between the probability of a Bullish trend and of a Bearish trend—. It usually helps the trader understand what the most likely direction is, and if the probability is gaining or losing momentum.

Futures Hold Firm—Is This the Floor for the S&P 500?Market Overview:
As inflation data continues to shape rate expectations and earnings season kicks off, traders are watching for signs of whether the recent selling pressure is fading or if volatility has more room to run. In today’s look at the S&P 500 Futures, we’ll break down trend conditions, price behavior, and the key Fibonacci levels that could play a role in where we go from here.
Bearish/Bullish Trend Analysis
Trend Condition:
Bullish Trends: 7
Bearish Trends: 7
Overview: The market is currently split, with 7 bullish and 7 bearish trend lines, reflecting indecision and a possible tug-of-war between buyers and sellers. This balanced trend condition suggests the market is in a potential transition phase rather than clearly trending in one direction.
Price Action and Momentum Zones
Current Price and Change:
Currently, the S&P 500 Futures are at 5,428.50, up by 32.75 points or +0.61%.
Market Behavior: This week’s gain is a modest move higher following a period of downside pressure. It could represent the start of a stabilization attempt, though stronger confirmation is still needed.
Momentum Zones:
The index is holding above the deeper momentum zones, testing resistance near the top of the current bearish swing range. It’s attempting a rebound, but within the broader mixed trend structure.
Fib Retracement Levels
Current Position Relative to Levels:
The current price levels are just above the 38.2% Fibonacci retracement level.
Key Fibonacci Levels:
23.6% → 5,537.68
38.2% → 5,148.66
50.0% → 4,834.25
61.8% → 4,519.84
Analysis: Remaining above the 38.2% retracement level is important. This level often acts as a support zone in a broader uptrend, especially during corrective pullbacks. If price can stay above this level, it would suggest some stabilization is taking place and may invite more bullish momentum.
Overall Market Interpretation
The current positive movement doesn’t drastically change the mixed market picture. The market is still in a state of indecision, with neither bulls nor bears clearly in control. Holding above the 38.2% Fibonacci level, however, could be an early sign of strength and a possible short-term pivot higher.
Summary
The S&P 500 Futures are showing moderate strength to start the week, though the broader sentiment remains mixed. The move back above the 38.2% Fibonacci level is a key development, acting as support in what may become a base for recovery. It’s still too early to call a reversal, but this level will be important to watch as traders gauge whether the market can firm up or continue to drift lower.

Weekly Market Forecast: Stocks Markets Could Push Higher!In this video, we will analyze the S&P 500, NASDAQ, and DOW JONES futures for the week of April 14-18th.
The Stock Market Indices ended a turbulent week on a bullish note, and next week could see some continuation. The markets have peeked above the consolidation, and could be on the way to resume the overall bullish trend.
Wait for confirmations of the trend before jumping in! One bad report of tariffs or geo-political news can turn the markets down at any time.
Enjoy!
May profits be upon you.
Leave any questions or comments in the comment section.
I appreciate any feedback from my viewers!
Like and/or subscribe if you want more accurate analysis.
Thank you so much!
Disclaimer:
I do not provide personal investment advice and I am not a qualified licensed investment advisor.
All information found here, including any ideas, opinions, views, predictions, forecasts, commentaries, suggestions, expressed or implied herein, are for informational, entertainment or educational purposes only and should not be construed as personal investment advice. While the information provided is believed to be accurate, it may include errors or inaccuracies.
I will not and cannot be held liable for any actions you take as a result of anything you read here.
Conduct your own due diligence, or consult a licensed financial advisor or broker before making any and all investment decisions. Any investments, trades, speculations, or decisions made on the basis of any information found on this channel, expressed or implied herein, are committed at your own risk, financial or otherwise.

ES-DailyLevels-14042025-30mThose are daily levels to watch for 14042025, short and long 30m. Supply and demand zones
