MES!/ES1! Day Trade Plan for 02/13/25MES!/ES1! Day Trade Plan for 02/13/25
📈6100-6120
📉6060-6040
Like and share for more daily ES/NQ levels 🤓📈📉🎯💰
(💎: IF THERE IS NOT MUCH VOLATILITY; FOCUS ON ZONES VERSES INDIVIDUAL PRICE LEVELS)
*These levels are derived from comprehensive backtesting and research, demonstrating over 90% accuracy. This statistical foundation suggests that price movements are likely to exceed initial estimates.*
ES1! trade ideas

ES Morning Update Feb 14thYesterday morning, a reclaim of 6066-70 zone in ES kicked off an easy long trigger, with 6125 set as the final target and 6139 as a bonus. We managed to tag 6139 overnight before the market pulled back to 6125.
As of now:
• Let the runners keep working, as thats all i do on Fridays mainly.
• 6120-23 is acting as support (it held, but it’s showing some weakness).
• Holding above this level keeps 6133, 6137, and 6154 in play.
• If 6120 fails, expect a dip to 6113, then 6098.

14 February 2025The S&P rose on Thursday after President Donald Trump announced plans for reciprocal tariffs but postponed their implementation. Investors also reacted to a new report indicating that inflation may be picking up again.
Despite Trump’s tariff announcement, markets remained steady. During a briefing, he emphasized the need for “fair and reciprocal” tariffs on all U.S. trading partners. However, the order he signed did not immediately enforce the tariffs. Instead, they are set to take effect as early as April, allowing time for potential negotiations with other countries.

MES1 THE LEAP BULISHMES1 is another asset representing the S&P 500 during the current leap. It is currently showing a bullish movement. The targets, danger zone, and stop loss levels are marked on the chart.
Please pay close attention to the danger zone and stop loss.
Note: My ideas are not intended for any type of scalping or scalpers!
You can find the full list of my ideas here: www.tradingview.com
Here are some of my ideas:

ES1! Back in for a FREE TRADE!I'm looking at a bearish reentry for the ES1 (E-mini S&P 500 futures) as recent price action suggests weakness following a correction. After a strong sell-off, we've seen a brief pullback or consolidation, which could be setting up for a continuation of the bearish trend, especially if the price fails to break key resistance levels

A small range is expectedA smaller range for the S&P 500 daily chart is expected for Friday. Although we had a strong move to the upside on Thursday the same size of move would not be expected for Friday. However a positive close above 6150 would be the next objective to the upside.

OTEUM EXPERT CALL: Afraid of Tarrifs? SP500 Intraweek Short!🚨 E-mini S&P 500 (ESH2025) | Inflation & Tariff Pressure Short Setup 🔻
This chart screams "bearish vibes" 📉 as inflation heats up and tariff talks continue, casting a shadow over market optimism. We will be opening up NY session in a critical value area 🔴, signaling a potential continuation of the sell-off.
🎯 Riding this wave could unlock some sweet profit potential as macro pressures keep the market under fire. Stay sharp, traders! ⚡💼

Looking out on ESFib extensions and Elliot waves line up nicely. Today had a wild pump, two days against lots of bearish news... See what's to come in this pyramid scheme


ES Morning Update6020 has been the pivotal level in ES. It needed to hold after CPI yesterday to set up a rally toward 6070. It held perfectly, pushed through the 6066-70 zone, and later hit a bonus target at 6087 overnight. The range between 6020 and 6125 has become choppy, with 6070 acting as the key magnet.
As of now:
• Bulls want to hold 6058/recover 6070.
• Keeps 6087, 6104, 6125 live.
• 6020 fails, sell.

Bearish Intraday Position Started on ES1! price action suggests a potential downward move, with key resistance levels being tested. Watch for any breakdowns below support for further confirmation. Stay cautious and manage risk as the session progresses. Keep an eye on market sentiment, news, and volume for any shifts.

Buying the breakBuyers bought the break or lower prices in the S&P 500 daily chart for Wednesday. The challenge now is will the PPI economic numbers support buyers moving this market above the 6110 level.

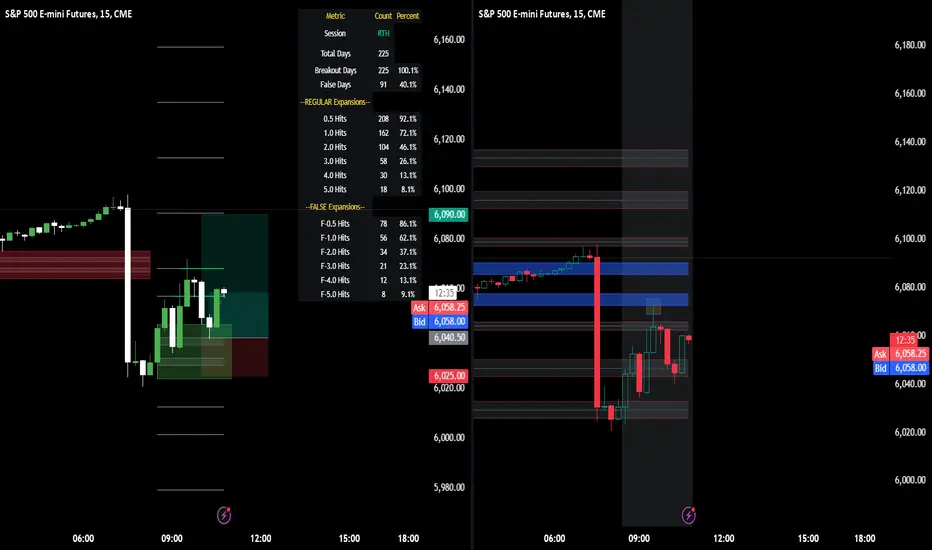
Es going to full recovery based off of probabilitiesLooking at Stats from the Opening Range Breakout we still have a 46% probability of hitting the 2STD of the 15 min opening range which would be a full recovery. I can see us possibly making new highs through the week based off of this recovery if it holds today.
ES Short Round 2I swear the audio is Congress talking!
Round 2 Shorts, Rejection off the .5 on my Exit FIB.

SPY/QQQ Plan Your Trade For 2-12: Base Rally PatternAlthough I believe the Base Rally pattern is still valid, the markets have been wound tightly near recent highs and I belive this unwinding/breakdown is what I have been suggesting (the Deep-V breakdown) for more than 35+ days.
I believe the sticky inflation data (CPI) will overpower the Base Rally pattern today and we will see the SPY/QQQ move downward into the Deep-V lows - likely setting up by Friday/Monday of this week.
I'm sorry I'm not able to create a morning video. I'm taking my disabled VET father to his annual checkup this morning. He is still sleeping and I don't want to wake him up.
So, you get this content as a substitute.
Be prepared for the markets to FLUSH OUT a low and try to grab some easy profits throughout today and tomorrow as the markets struggle to find support.
Remember, the broader cycle patterns can sometimes overpower the Daily Cycle Patterns. This happens when NEWS overpowers a Daily cycle pattern construct. In this case, the CPI data is overpowering the Base Rally Daily Cycle Pattern.
Ultimately, the markets will find support and move into a brief recovery phase.
Get some.

ES Morning Update CPI DayYesterday’s setup came from a failed breakdown of the 6066-70 zone at 9:30 AM in ES. The daily target of 6093 was reached at 11 AM, and sellers have held below that level since. With CPI scheduled at 8:30 AM today, it’s time to let the runners work if you have them. Or sit on hands til after
As of now:
• 6078 and 6066-70 must hold through any CPI traps to keep 6109, 6115, and 6126+ in play
• If the price dips below 6066, expect a move down to 6020
Check my CPI Trading Guide I sent out yesterday evening on how to trade days like today.

S&P 500Hello & welcome to this analysis
The index has entered into the potential reversal zone (PRZ) of a Bearish Harmonic ABCD pattern suggesting a higher probability of completion of an uptrend and likely reversal.
The likelihood of reversal confirmation would require it to start sustaining below 5900 on weekly basis since this is a pattern formed in the monthly time frame.
Harmonic Patterns are based on unique structures backed by specific Fibonacci ratios.
Regards

ES Shorts on the Leap!lets seeeeeeeee, I am always early so need to deal with a little drawdown.
$5980ish Target

Bullish biasThe daily structure in the S&P 500 after Tuesday's session has a bullish bias. The CPI number coming out Wednesday may provide the impetus for this market to trade higher. 6110 is the objective.

Important Support and Resistance Points: 6066.50
Hello, traders.
If you "Follow", you can always get new information quickly.
Please click "Boost".
Have a nice day today.
-------------------------------------
(ES1! 12M chart)
When looking at the Fibonacci ratio, the area marked with a circle is an important support and resistance area.
If there is an additional rise in the area where the current price is located, it is expected to determine the trend again around the left Fibonacci ratio point of 3.618 (6579.25).
If it fails to rise, it is expected to fall to the Fibonacci ratio range of 0.618 (5273.25) ~ 2.618 (5434.75).
-
(1D chart)
The point to watch is which direction it deviates from the box range of the HA-High indicator.
The HA-High indicator is formed at the 6066.50 point.
-
Since the MS-Signal (M-Signal on the 1D chart) indicator is passing around 6066.50, the 6066.50 point is expected to play an important role as support and resistance.
Accordingly, the key is whether it can be supported in the 6066.50-6106 range and rise to around the Fibonacci ratio 1 (6178.50).
If it falls below 6066.50, it is expected to fall to around 5935.75-5972.75.
-
Ultimately, if it cannot get out of the box range of the HA-High indicator, you should trade within the box range.
The box range of the HA-High indicator is 5906.50-6148.0.
-
Thank you for reading to the end.
I wish you successful trading.
--------------------------------------------------

MES Futures – Critical Supply & Demand Zones Based on VPThe current price action in MES Futures is approaching a key supply zone while sitting above multiple demand levels, creating a pivotal moment for the next significant move.
Based on historical volume profile analysis, the following zones are identified:
Supply Zone (6,087-6,104): Sellers have previously stepped in aggressively in this range, making it a strong resistance area. If price rejects here, we could see a pullback toward lower demand zones.
Initial Demand Zone (6,040-6,060): This area has seen notable buyer activity in the past. If price pulls back but holds this zone, it could act as the first support level for a potential bounce.
Deeper Support from Major Buyer Aggression (6,013-6,020): If selling pressure continues, this level is where significant buyers previously stepped in. A test of this zone could result in a strong reaction and possible reversal.
Major Demand Zone (5,975-5,988): This is a key structural support area where large institutional buying has been recorded. If price reaches this level, it would be a crucial inflection point, with a high likelihood of buyers stepping in to defend.
Possible Scenarios:
Bullish Continuation: If price holds above the initial demand zone (6,040-6,060) and breaks above 6,100, momentum could push MES toward 6,147-6,150.
Pullback Before Higher Move: A rejection at the supply zone could lead to a retracement toward 6,040-6,060 for a support test before another breakout attempt.
Deeper Correction: If 6,040 fails, price may move toward 6,013-6,020, where stronger buyer activity is expected. A failure at this level could send price to the major demand zone at 5,975-5,988 for a structural retest.
This analysis highlights key reaction zones based on historical liquidity and volume profile data. Traders should monitor price action at these levels to confirm strength or weakness before entering trades.

ES Morning Update Feb 11thThe past week in ES has centered around 6066-70, which served as a solid support last Thursday and again yesterday, keeping targets 6086, 6093+ in play for now. Now, we’re back at this level—it’s become a messy, choppy magnet.
As of now:
• The 6066-70 zone needs to push quickly to reclaim 6086 and 6093+
• If that zone fails, expect a dip to 6052, then 6037

10 February 2025S&P 500 saw gains as investors appeared to grow accustomed to President Donald Trump’s latest tariff threats. Many on Wall Street now perceive these announcements as primarily a negotiation tactic.
However, concerns remain that the expanding list of tariff hikes could drive inflation higher, potentially delaying expected interest rate cuts. Investors will closely watch Wednesday’s release of the January Consumer Price Index (CPI) for inflation clues, along with retail sales data later in the week.
Meanwhile, the latest New York Federal Reserve survey, published Monday, revealed that consumers’ long-term inflation expectations have risen to 3%, the highest level since May 2024.
Although markets seem more resilient to tariff-related news, the broader economic consequences of these policies continue to be a key focus for investors and policymakers.
