Large sell-off expected in the stock market.Looking at this chart, unfortunately, I see a significant selling movement, at the very least a major correction, which could potentially be devastating.
It is clearly visible that there were two false breakouts on the daily chart, with the price failing to close above the indicated line. It tested the line multiple times, and this last attempt made it evident that it will require significant momentum to break through. There is a support level that needs to be tested, and if it fails, it will trigger panic and substantial financial losses.
ES1! trade ideas

Possible nestTwo leading diagonals in lower degree with divergence indicating possible 1-2,1-2 nest as long as current lows hold

$ESH2025 bullish running up into Friday, January 31, 2025All the usual disclaimers:
1. I am not registered with FINRA. I am not a financial advisor.
2. Prior performance is not a guarantee of future performance.
3.This post is not and is not intended as financial advice. Instead, this post shares speculation upon hypothetical possible future outcomes.
4. This post uses purely doodling and technical analysis. It is not based to any extent upon education from news sources, information releases from underlying firms, nor upon microeconomic nor macroeconomic principles.
A. The purple rectangle captures the recent downturn movement between December 5-January 14.
B. The green rectangle is a clone of that, based at the golden cross on January 14.
C. The orange rectangle is sized at 100 point range for 1 CME day, centered on last closing price.
D. The rectangle is sized at the 155 point range of December 18, 2024 for 1 CME day, centered on last closing price, starting from the opening bell.
E. Some downturn indicators arrowed to for discussion reference.
I added a collage of prior CME_MINI:ESH2025 declines since September 2024, each at 20% opacity, and appended those atop each other from the Friday, January 24, 2025 close.
We can account for market reactions to Deepseek R1 by compressing the action foreshadowed out to Feb 10 up to the end of trading for Monday, January 27. Going from there, Tuesday's action strongly resembles that foreshadowed Feb 11 rebound. The rest of the week running up to Friday, January 31 is foreshadowed to push bullishly towards 6170.

Will Wednesday Fed action be acceptable?Will the Wednesday Fed action be acceptable to the S&P 500 futures market? The expectation is the Fed will leave interest rates unchanged. In the past this is because bearish stock market conditions or will the Fed announcement be acceptable to the market and it closes above 6120.

ES1 Bullish ES1 crossed over 6075 key level broke back to 5 FVG now holding support so Got in position to break back above 6075

Day After DeepSeek Gap ES & NQ Intraday Update Jan 28 2025Intraday update for emini futures ES & NQ using Market & Volume Profile Techniques

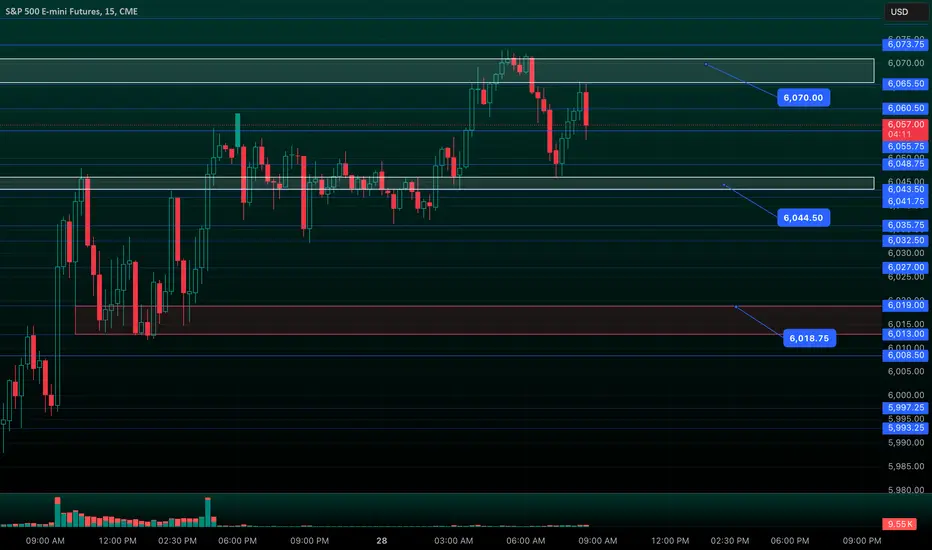
ES Morning UpdateTextbook precision: Yesterday, the 6016-20 reclaim in ES triggered a long setup. I emphasized holding for two key targets: 6049 and 6070. We hit 6070 before pulling back.
As of now:
• 6042 (defended) keeps 6070, 6082, and 6105+ in play
• If 6042 fails, expect a dip back to 6016-20
ES1 BullishAfter a massive bears move price made its way back Bullish. Broke past 6050 came back and now consolidating at 6050 key level just broke bullish on the 1min now waiting on pull back to enter

AMP Futures - Lock chart position when switching intervals.In this idea, we will demonstrate how to lock your chart position when viewing history anytime you switch from one-time interval to another.

Rest dayAfter the volatility and the location of the close on Monday, the expectation is for Tuesday to trade inside the range of Monday. There is a low expectation that Tuesday would test the high or the low of Monday's movement.


Is This Sell-Off Another "Buy the Dip" Opportunity?Macro Update
Index futures sold off during overnight trading as market sentiment turned risk-off.
Newswires reported that, after Colombia denied entry to two U.S. deportation aircraft, President Trump announced emergency tariffs of 25% on all Colombian imports, with plans to increase them to 50% next week. Additionally, The Wall Street Journal noted growing support among President Trump's advisors to impose 25% tariffs on Canada and Mexico as early as Saturday to initiate negotiations.
Meanwhile, Chinese startup DeepSeek is challenging U.S. dominance in the AI sector by introducing a low-cost model rivaling OpenAI's o1. This development may intensify geopolitical and economic tensions.
Adding to the unease, Chinese Manufacturing and Non-Manufacturing PMIs missed expectations. Manufacturing PMI came in at 49.1, below the forecast of 50.1. Markets in China and most of Asia will remain closed starting Tuesday for the Lunar New Year holiday, which could lead to lower regional liquidity.
Looking ahead, the week features several high-impact events:
Wednesday, January 29:
Federal Reserve interest rate decision and the first FOMC press conference of 2025.
Bank of Canada interest rate decision.
Thursday, January 30th:
ECB interest rate decision
Preliminary Q4 GDP data (QoQ).
Friday, January 31st:
Core PCE Price Index (Dec).
ES Futures Update
This week is packed with critical data releases, and macroeconomic developments are having a stronger influence on short-term price fluctuations. It’s an important time to step back, zoom out, and identify key levels of interest to engage with the market.
Despite the overnight sell-off and heightened volatility, the auction process remains orderly. Managing risk is paramount, as losses are an inherent part of trading.
Key Observations:
ES futures bounced off the yearly open in overnight trading, marking it as our critical Line in the Sand (LIS).
If prices stay above the LIS, markets are likely to consolidate further this week, with FOMC and other data releases determining the next move.
A break below the yearly open could open the door to short trade opportunities targeting the support zones identified on the chart.
Scenario 1: Wait and See
Allow the market to digest the sell-off. Look for long setups from the LIS. Key events like the FOMC decision will likely influence market direction, but unexpected negative news could overshadow these data releases.
Scenario 2: Sustained Sell-Off
If a catalyst triggers further downside, the market may test support levels near 5,750 and 5,800. Below the LIS, short setups may be viable if supported by news or price action that aligns with a bearish trade thesis.
For traders looking to manage risk more effectively, consider using Micro E-mini S&P 500 contracts , which are 1/10th the size of standard ES contracts.
This week’s data releases, geopolitical developments, and tariff announcements are likely to shape market sentiment. Stay cautious and adapt to new information as it unfolds. Risk management remains the cornerstone of success in volatile markets.
Not confident to incorporate these into your trading plan? Why not incorporate our trade ideas to your trade plan in TradingView and CME’s paper trading competition; “The Leap”.

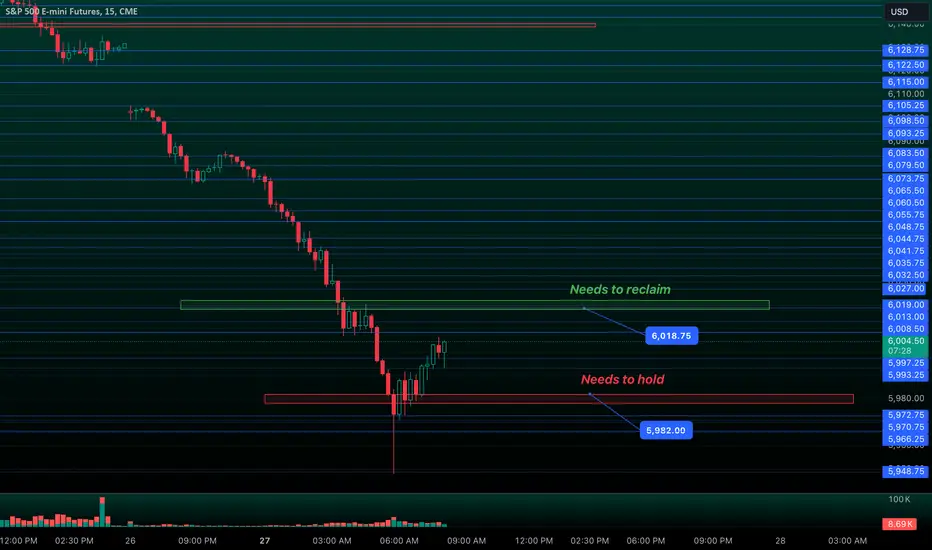
ES/SPX Morning Update Jan 27thOn Friday at 1:30 PM, ES broke below 6135, a key support level it had held for two weeks. Headlines fueled the move, leading to a gap down and a sharp sell-off. Initial targets at 6083 and 6070 were reached, with even more downside following.
As of now:
• 6016-20 must reclaim to trigger a short squeeze from buyers
• If 5982 fails, sellers can easily drop to 5966 and 5949 after that
ES1! 5 minute shorts into Monday 1/27 earningsS&P futures open technically bearish with a 'GAP' down to start off earnings week ( 1/27 - 1/31). We are currently taking advantage of the price action on a shorter time-frame and playing the market structure to its next subsequent down-side targets each pull-back and extension from Sydney, into London session.

#ES_F Day Trading Prep Week 1.26 - 1.31.25Last Week :
Last week we opened over the Value of 6054 - 5933 HTF Range and were able to hold over, when we got over the Edge that brought in more buying that gave us a push into new HTF Value of 6195 - 6074 Range where we have sold off from before after contract roll and we closed Friday with a rejection from a push into VAH.
This Week :
Last week of the month, new president is in, what can we expect this week ?
Well looking at the structure we had a perfect rejection from the top on Friday which of course doesn't exactly have to be a top but if it were one it would be a very good looking one on the Daily TF if it was one.
Going into this week IF we can't get over VAH and hold over 6160 - 70 to build supply to take higher over upper Edge then we could see balancing inside the Intraday Range of current Value to build supply and digest the move we had last week that is IF we have truly accepted in this 6195 - 6074 HTF Range. IF we have not found the needed acceptance here and we start getting continuation into VAL we have Poor/Weak RTH Lows there at 6111 which we could aim for, If taken out that could give us more selling to at least fill the Gap we created into 6093 area.
From there we would watch if we absorb all the selling and can get back into above Value or if we can't and we hold under 6100 then we could see more selling to push into lower Edge and IF we happen to get inside it under 6070 then moves back towards lower VAH/Value are not out of the question as long as we can get through 6050s

#202504 - priceactiontds - weekly update - sp500Good Evening and I hope you are well.
comment: Bulls got another two bigger legs up which now makes it 5. Question now is, how likely is a continuation before a deeper pull-back? I do think Friday’s price action could have been the start of a wider profit taking by more bulls but until the bull channel is clearly broken and we have traded consecutive bars below the 4h 20ema, it won’t mean much. In the past 3 months we had very strong looking legs up, followed by deep pull-backs and we have not made a meaningful higher high since 2024-11-11. It’s reasonable to assume that we can hit 6200 before turning but I have big doubts about more upside beyond.
current market cycle: trading range
key levels: 5800 - 6200
bull case: Bulls made 140 points on the week with 5 clear legs up. Buying above 6130 is just bad no matter how you put it. Scalps ok but we have been in this trading range for 3 months now. Bulls want to print another ath and 6200 is the logical target. As long as the bull channel holds, they are favored and in control. Once we start closing gaps below again, more bulls will likely take profits.
Invalidation is below 5790.
bear case: Bears didn’t do much the past week but we are at big resistance again and shorts are great from a risk:reward perspective. The upside potential is probably limited to 6200/6300 but the downside is clear with 5800. For now you can only short this if you are willing to scale in higher, otherwise you have to wait for better selling pressure and a break of the bull trend line.
Invalidation is above 6300.
short term: Neutral 6100 - 6200, bearish below for 6000 and depending on how we get there, either wait for a lower high or we might continue down.
medium-long term - Update from 2025-01-26: Ultimately 5200-5300 in 2025. For now we are stuck in a range 5800 - 6200.
current swing trade: None
chart update: Adjusted targets and added the current bull channel and two big gaps.
