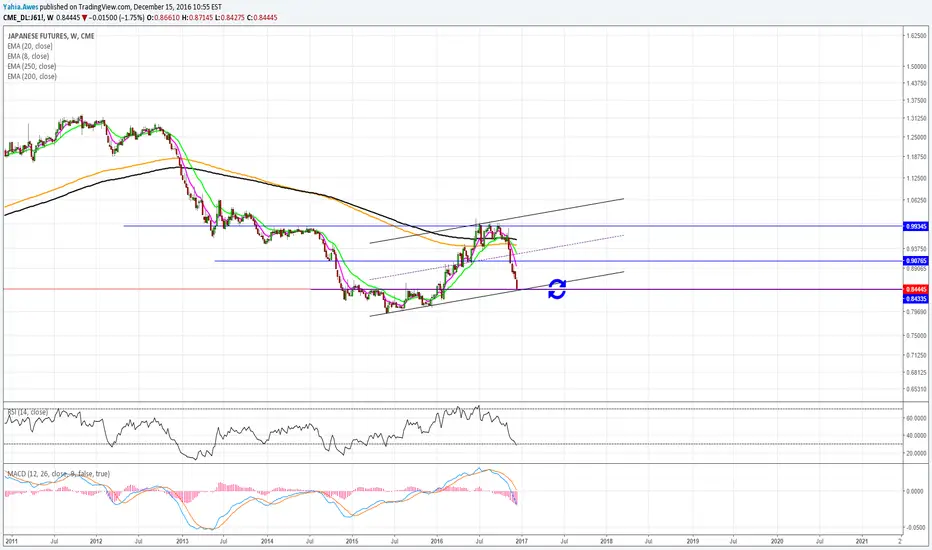
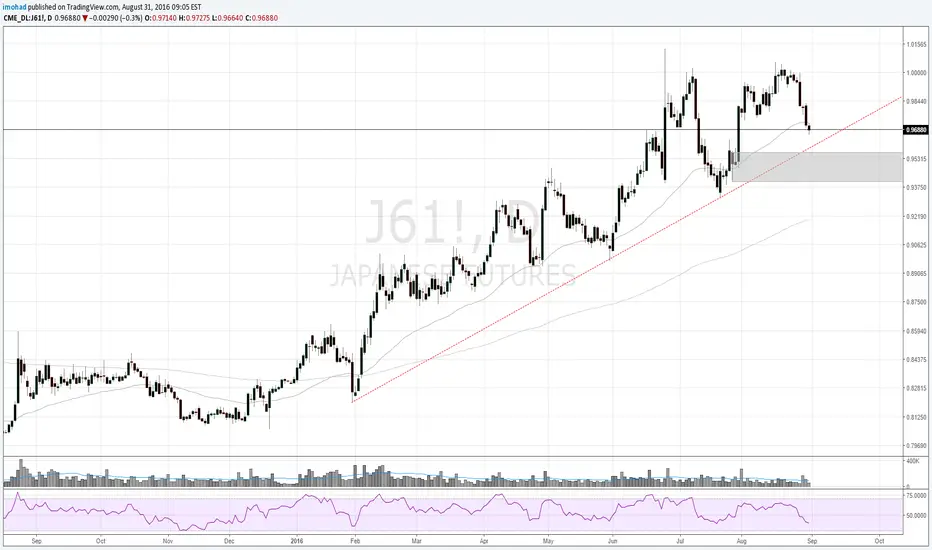
J61!, potential support at necklineAfter peaking up in Jul,
yen wasnt able to break that triple resistance and fell back down
we shall see if price can find support
at the neckline of pseudo inverted H&S
J71! trade ideas

Nikkei index & YEN index - Why i think DXY need rest ? (part 5)Take care and good luck.
Thank you for your support.

Japanese Futures Buy Setup Daily ChartBullish Crab + Candle Stick Reversal Pattern+ Regular Divergence + OverSold

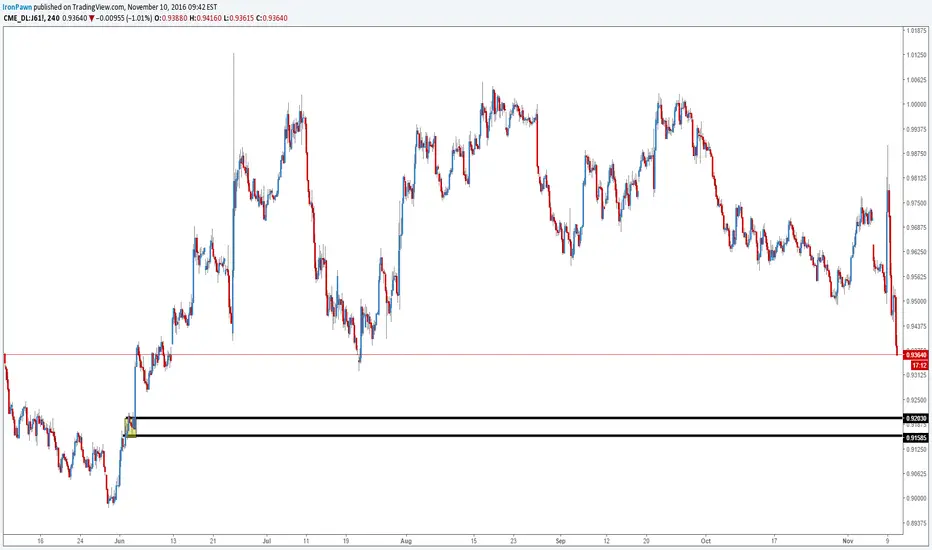
Japanese Futures find a road blockJ61! looked bearish as bearish can be, though they had come out of a larger up trend, so I can only presume that they are correcting and looking for more buyers. "Bulls take the stairs, Bears use an elevator".
The fib says that the Yen has interest here at the 61.8
If you look left we've come down to an area of balance and based on the presumption that we are correcting the up trending channel there should be buyers here.
0.86 and 0.84 are other long areas of interest, so if we don't get a reversal here, look out below.

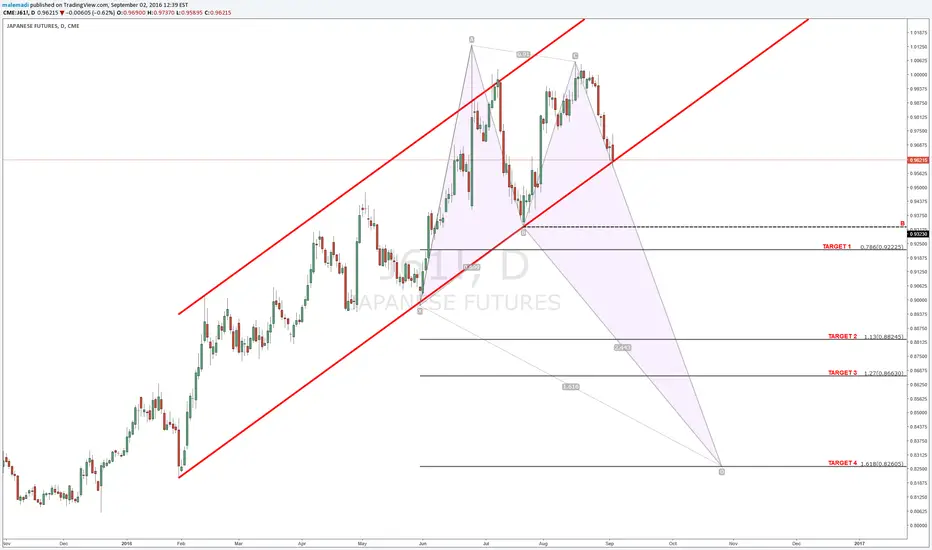
JPY futures analysisComing off a triple top bearish pattern, price is at the lowest level since July. If the current trend continues down I'm looking at the 38.2, 50, and 61.8 Fibonacci retracement levels to cover the position.


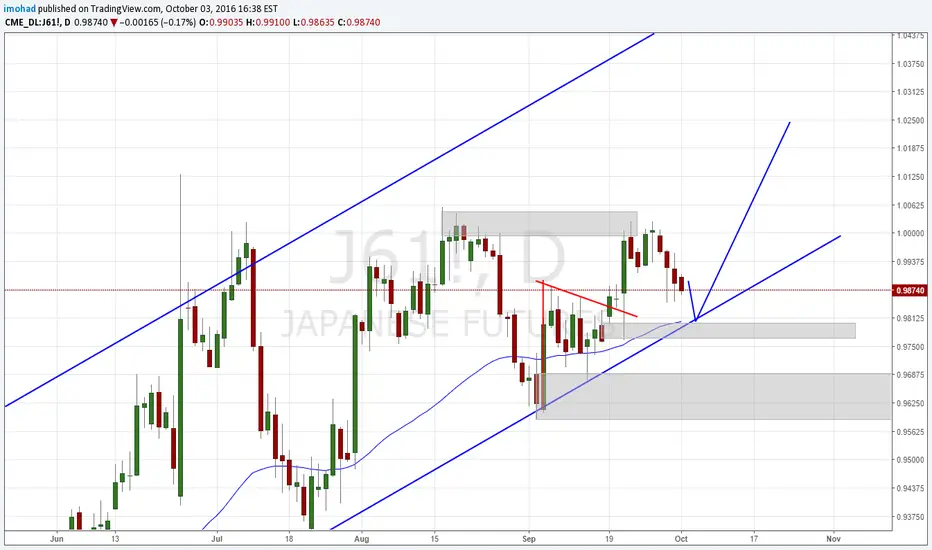
JPY fx daily viewPrice is at a key support level, a turnaround to the upside would confirm the ABCD pattern and retest the highs of the range, A break below support would invalidate idea.

***Long Opp***1) Long term trend is up given by the 89 day sma over the 89 week sma.
2) Recent price action has created a great opportunity to trade with the trend!
3) Spike in volume.
4) Fractal momentum has reached a maximum to the negative.
5) Fractal acceleration has turned positive.
One could buy the future contract or short the put option for a more conservative approach.
Trading futures and derivatives involves serious risk of financial loss and may not be suitable for all investors.

USDJPY: Just a provocation ! Long and think about itI hope you start thinking about the long term view... Would further Yen weakening really surprise you ? Don't you think the current REALLY LONG TERM Support is strong enough. Before betting on further Yen strengthening wait if support breaks.


JPY INDEX as we see the JPY index is very strong. it will take GBPJPY and USDJPY the make a new lower low


JPY index, don't think about selling methis is the JPY index says don't sell me front of any other currency
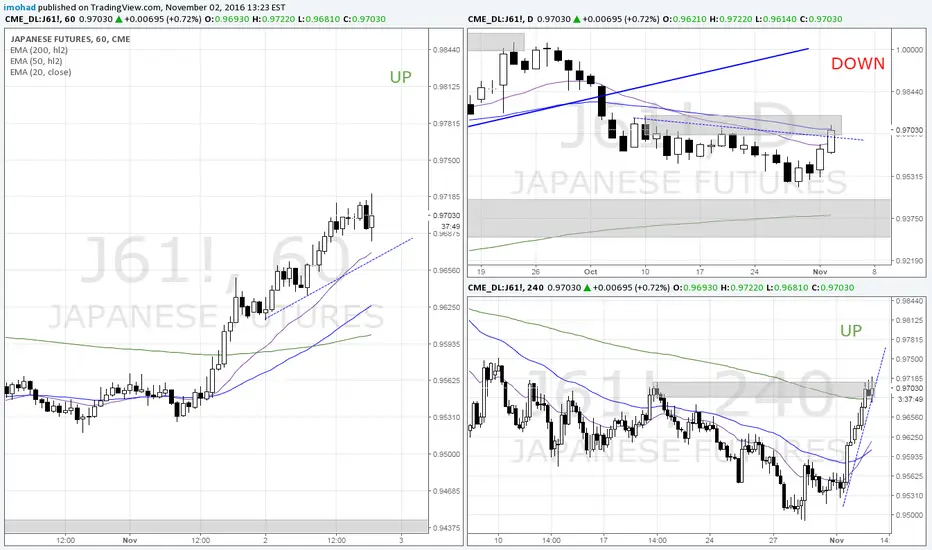
4hr MJY1! 8/7/16This is the futures of USDJPY, which is JPYUSD. The spot price, USDJPY, is the inverse of this chart.
Great short for this pair, which is long USDJPY. Should see a minor low, .9250 is my tgt area currently and once this is achieved we should reverse and rally. When MJY1! is at .9250 this would be a great short in USDJPY.


Bearish setup on JPY Index (J61!)We can see that JPY Index is exhausted right now and we believe we are seeing a setup of a Market Makers Buyers Profile, this means quit a big drop on JPY (Yen pairs) before it eventually turns back up. For now we are VERY BEARISH on JPY Index
